| Param | Original file | Final file |
|---|---|---|
| Filename | modeM0/AS1A10_094T26_9000004558_31408cztM0_level2.evt | modeM0/AS1A10_094T26_9000004558_31408cztM0_level2_quad_clean.evt |
| Size (bytes) | 237,536,640 | 62,029,440 |
| Size | 226.5 MB | 59.2 MB |
| Events in quadrant A | 1,463,517 | 423,688 |
| Events in quadrant B | 2,249,387 | 427,803 |
| Events in quadrant C | 1,522,407 | 416,513 |
| Events in quadrant D | 1,763,267 | 406,938 |
| Mode M0 | |||
|---|---|---|---|
| Quadrant | BADHDUFLAG | Total packets | Discarded packets |
| A | 0 | 6032 | 1 |
| B | 0 | 8765 | 1 |
| C | 0 | 6265 | 1 |
| D | 0 | 7030 | 1 |
| Mode M9 | |||
|---|---|---|---|
| Quadrant | BADHDUFLAG | Total packets | Discarded packets |
| A | 0 | 11 | 0 |
| B | 0 | 11 | 0 |
| C | 0 | 11 | 0 |
| D | 0 | 11 | 0 |
| Mode SS | |||
|---|---|---|---|
| Quadrant | BADHDUFLAG | Total packets | Discarded packets |
| A | 0 | 60 | 0 |
| B | 0 | 60 | 0 |
| C | 0 | 60 | 0 |
| D | 0 | 60 | 0 |
| Quadrant | Total seconds | Saturated seconds | Saturation percentage |
|---|---|---|---|
| A | 2847 | 17 | 0.597120% |
| B | 2847 | 46 | 1.615736% |
| C | 2847 | 62 | 2.177731% |
| D | 2847 | 24 | 0.842993% |
Noise dominated data is calculated using 1-second bins in cleaned event files. If a bin has >2000 counts, and if more than 50% of those come from <1% of pixels, then it is considered to be noise-dominated and hence unusable.
| Quadrant | # 1 sec bins | Bins with >0 counts | Bins with >2000 counts | High rate bins dominated by noise | Noise dominated (total time) | Noise dominated (detector-on time) | Marked lightcurve |
|---|---|---|---|---|---|---|---|
| A | 4007 | 2848 | 0 | 0 | 0.00% | 0.00% |  |
| B | 4007 | 2848 | 0 | 0 | 0.00% | 0.00% |  |
| C | 4007 | 2848 | 0 | 0 | 0.00% | 0.00% | 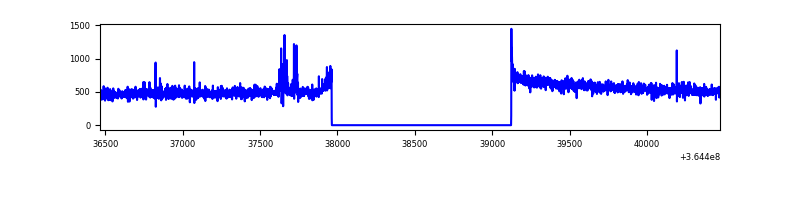 |
| D | 4007 | 2848 | 12 | 12 | 0.30% | 0.42% | 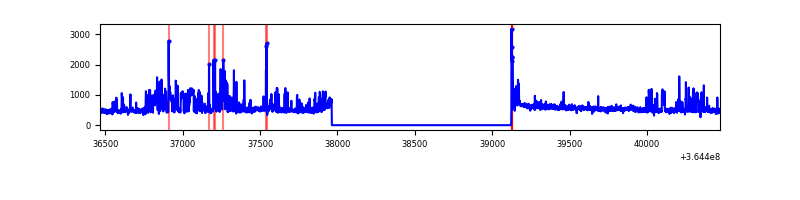 |
Top three noisy pixels from each quadrant. If the there are fewer than three noisy pixels in the level2.evt file, extra rows are filled as -1
| Pixel properties | Quadrant properties | ||||||
|---|---|---|---|---|---|---|---|
| Quadrant | DetID | PixID | Counts | Sigma | Mean | Median | Sigma |
| A | 13 | 254 | 4669 | 56.02 | 379 | 372 | 76.7 |
| A | 3 | 137 | 3658 | 42.84 | 379 | 372 | 76.7 |
| A | 0 | 226 | 3205 | 36.93 | 379 | 372 | 76.7 |
| B | 6 | 159 | 716720 | 10014.27 | 374 | 365 | 71.5 |
| B | 4 | 80 | 35102 | 485.61 | 374 | 365 | 71.5 |
| B | 0 | 190 | 22007 | 302.54 | 374 | 365 | 71.5 |
| C | 14 | 238 | 71234 | 826.82 | 365 | 367 | 85.7 |
| C | 14 | 254 | 16001 | 182.41 | 365 | 367 | 85.7 |
| C | 2 | 114 | 6585 | 72.55 | 365 | 367 | 85.7 |
| D | 8 | 195 | 213015 | 2422.39 | 368 | 358 | 87.8 |
| D | 12 | 218 | 88653 | 1005.77 | 368 | 358 | 87.8 |
| D | 2 | 250 | 28874 | 324.83 | 368 | 358 | 87.8 |
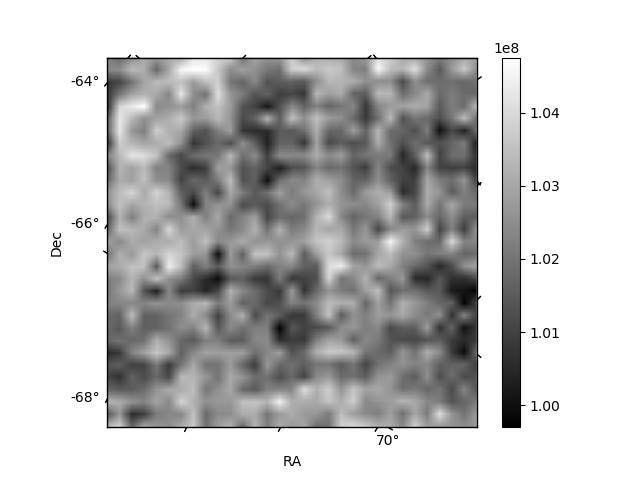
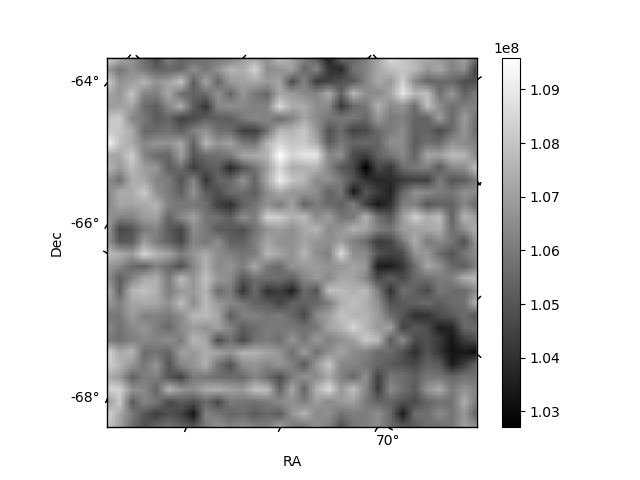
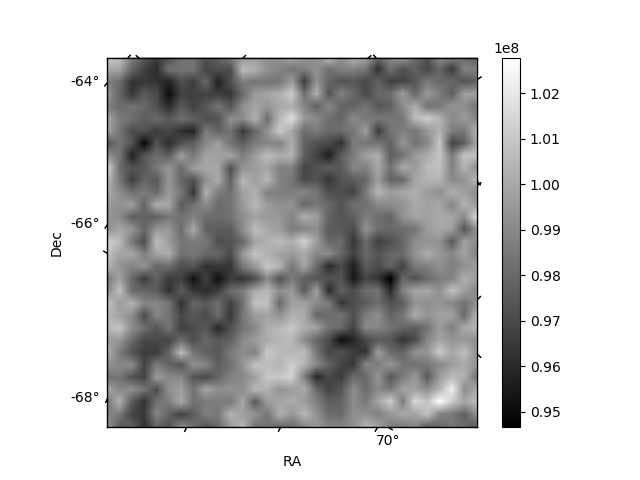
Histogram calculated using DETX and DETY for each event in the final _common_clean file
| Quadrant A | 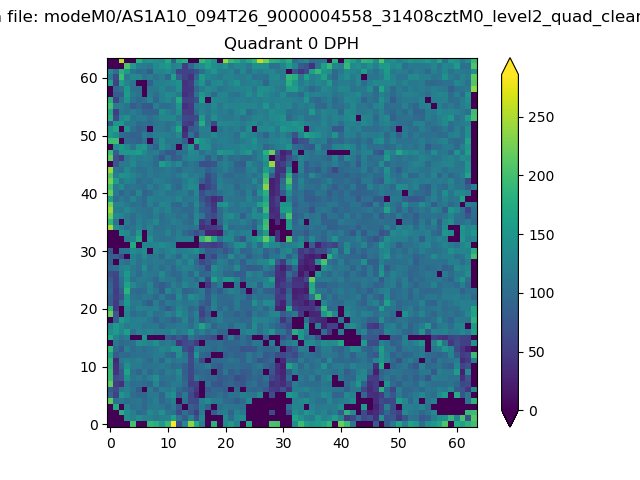 |
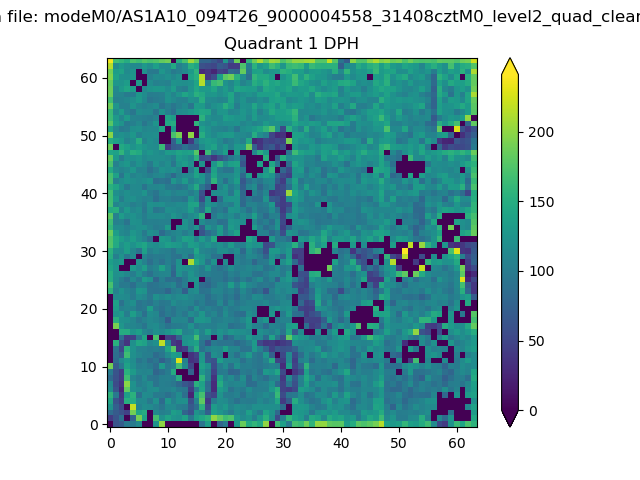 |
Quadrant B |
|---|---|---|---|
| Quadrant D | 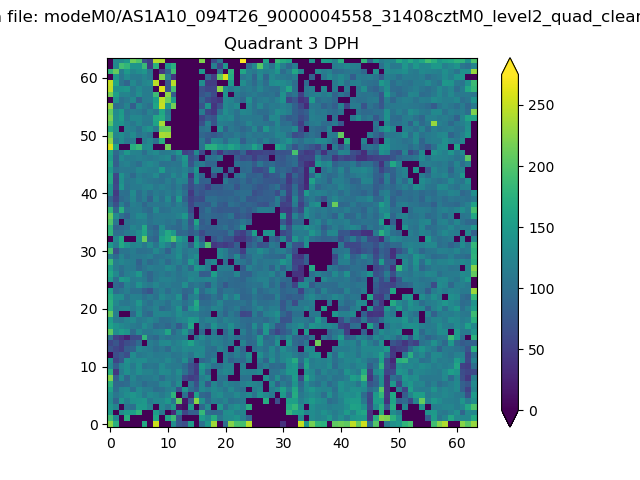 |
 |
Quadrant C |
| Plot type | Count rate plots | Images |
|---|---|---|
| Comparison with Poisson distribution Blue bars denote a histogram of data divided into 1 sec bins. Red curve is a Poisson curve with rate = median count rate of data. |
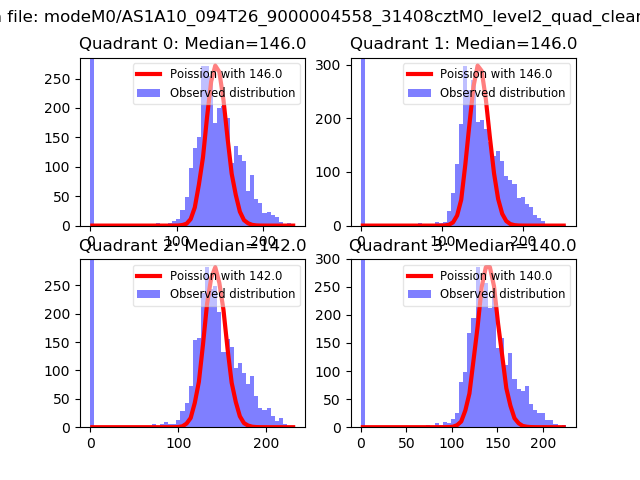 |
 |
| Quadrant-wise count rates Data is divided into 100 sec bins |
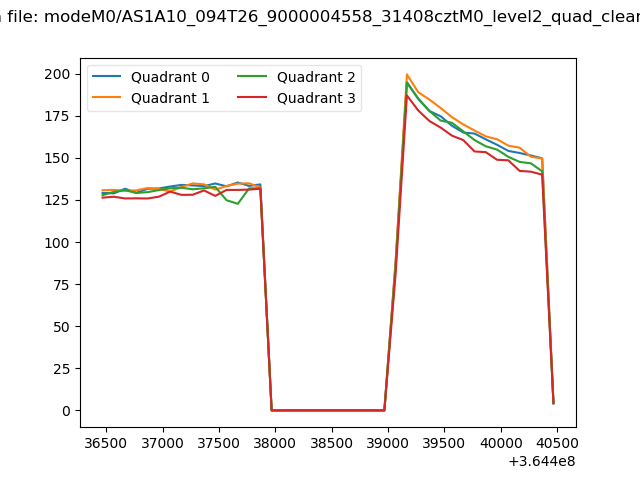 |
|
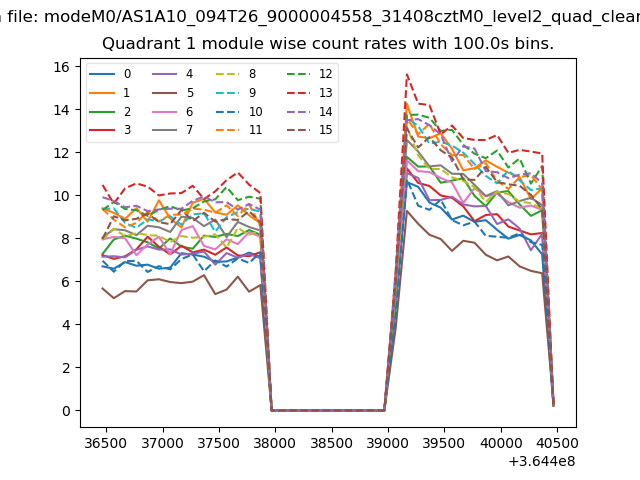
| Module-wise count rates for Quadrant A Data is divided into 100 sec bins |
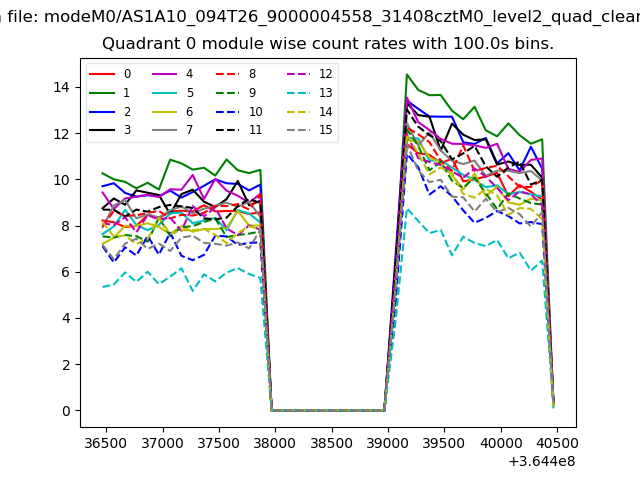 |
 |
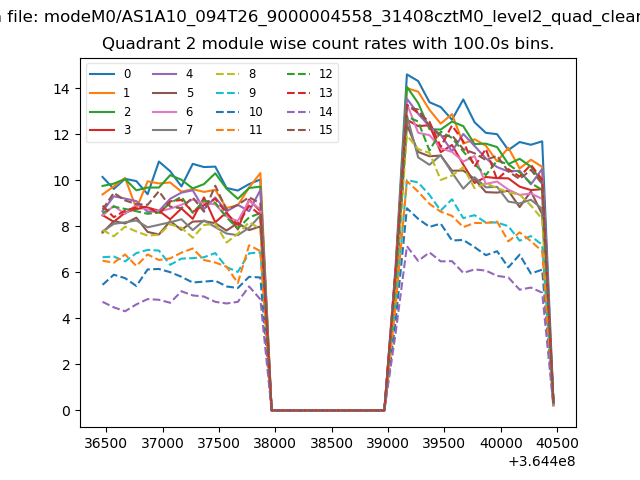
| Module-wise count rates for Quadrant B Data is divided into 100 sec bins |
 |
 |
| Module-wise count rates for Quadrant C Data is divided into 100 sec bins |
 |
 |
| Module-wise count rates for Quadrant D Data is divided into 100 sec bins |
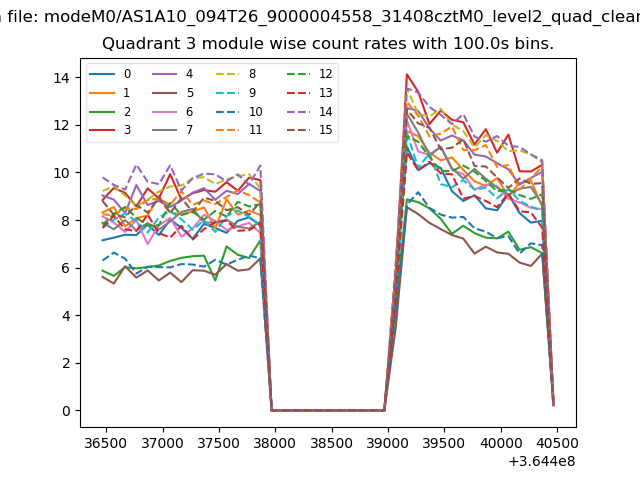 |
 |
| Parameter | Plot |
|---|---|
| CZT HV Monitor | 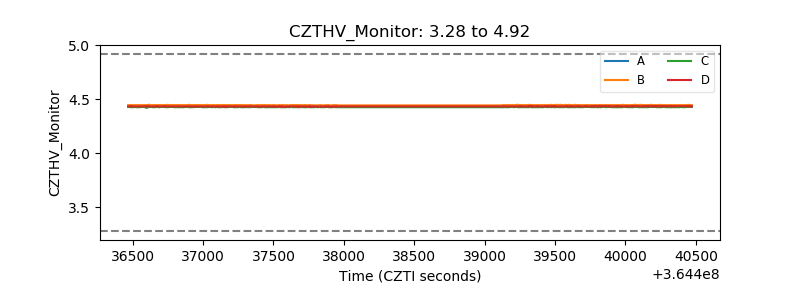 |
| D_VDD | 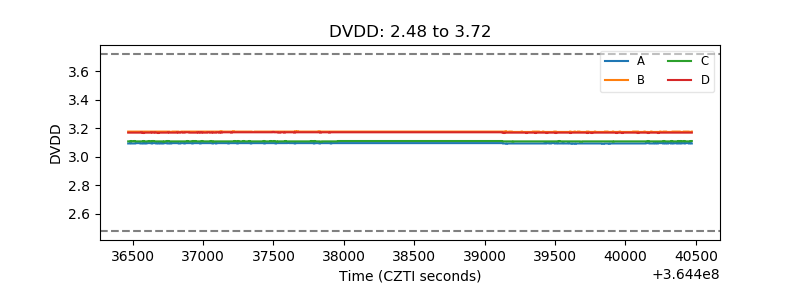 |
| Temperature 1 | 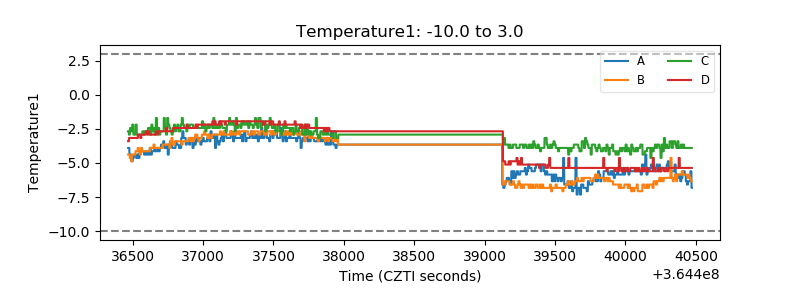 |
| Veto HV Monitor |  |
| Veto LLD | 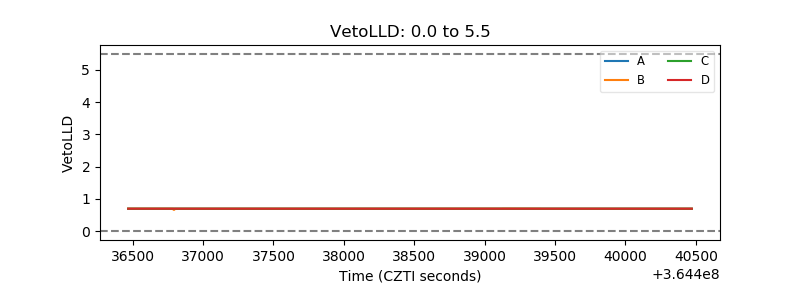 |
| Alpha Counter | 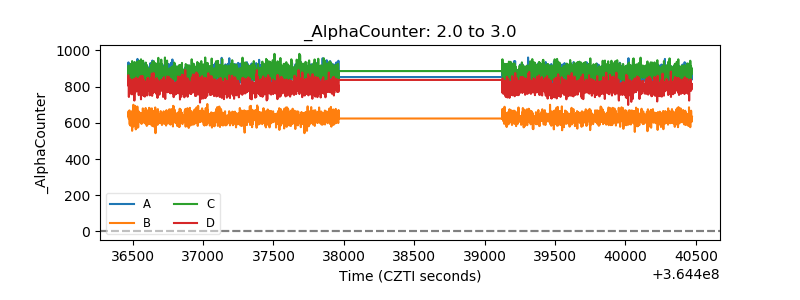 |
| _CPM_Rate | 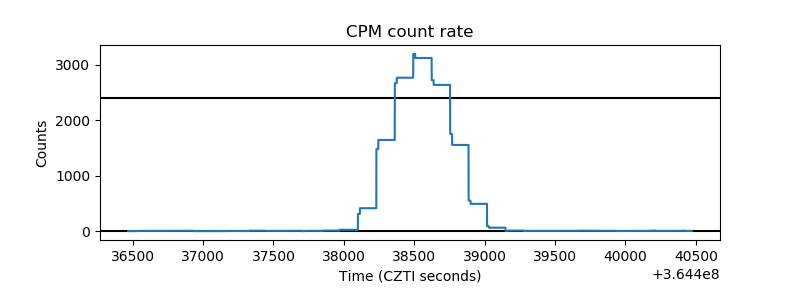 |
| CZT Counter |  |
| +2.5 Volts monitor |  |
| +5 Volts monitor |  |
| _ROLL_ROT | 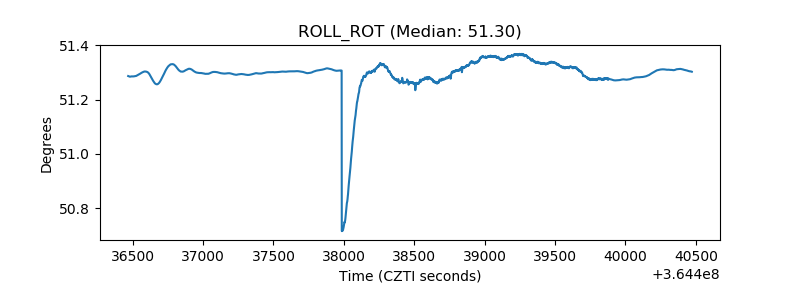 |
| _Roll_DEC | 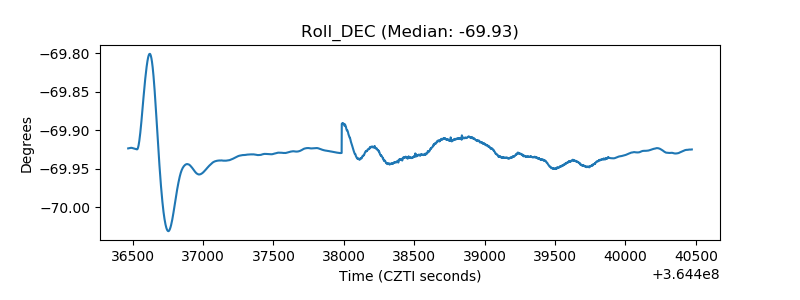 |
| _Roll_RA |  |
| Veto Counter | 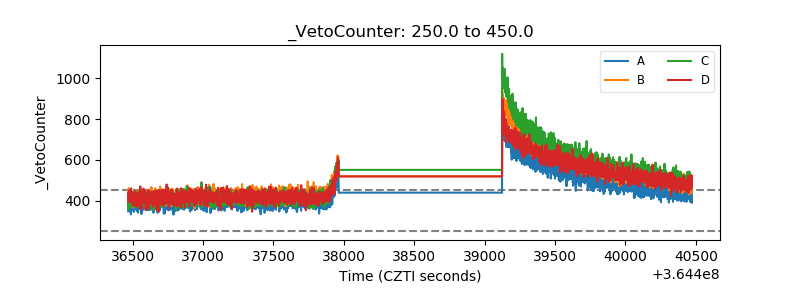 |