| Param | Original file | Final file |
|---|---|---|
| Filename | modeM0/AS1A10_094T26_9000004558_31413cztM0_level2.evt | modeM0/AS1A10_094T26_9000004558_31413cztM0_level2_quad_clean.evt |
| Size (bytes) | 666,953,280 | 174,300,480 |
| Size | 636.1 MB | 166.2 MB |
| Events in quadrant A | 3,977,089 | 1,193,895 |
| Events in quadrant B | 6,221,839 | 1,175,555 |
| Events in quadrant C | 4,391,889 | 1,183,675 |
| Events in quadrant D | 5,054,431 | 1,157,993 |
| Mode M0 | |||
|---|---|---|---|
| Quadrant | BADHDUFLAG | Total packets | Discarded packets |
| A | 0 | 16755 | 1 |
| B | 0 | 24868 | 1 |
| C | 0 | 17898 | 1 |
| D | 0 | 20136 | 1 |
| Mode M9 | |||
|---|---|---|---|
| Quadrant | BADHDUFLAG | Total packets | Discarded packets |
| A | 0 | 13 | 0 |
| B | 0 | 13 | 0 |
| C | 0 | 13 | 0 |
| D | 0 | 13 | 0 |
| Mode SS | |||
|---|---|---|---|
| Quadrant | BADHDUFLAG | Total packets | Discarded packets |
| A | 0 | 166 | 0 |
| B | 0 | 166 | 0 |
| C | 0 | 166 | 0 |
| D | 0 | 166 | 0 |
| Quadrant | Total seconds | Saturated seconds | Saturation percentage |
|---|---|---|---|
| A | 8181 | 52 | 0.635619% |
| B | 8181 | 137 | 1.674612% |
| C | 8181 | 178 | 2.175773% |
| D | 8181 | 156 | 1.906857% |
Noise dominated data is calculated using 1-second bins in cleaned event files. If a bin has >2000 counts, and if more than 50% of those come from <1% of pixels, then it is considered to be noise-dominated and hence unusable.
| Quadrant | # 1 sec bins | Bins with >0 counts | Bins with >2000 counts | High rate bins dominated by noise | Noise dominated (total time) | Noise dominated (detector-on time) | Marked lightcurve |
|---|---|---|---|---|---|---|---|
| A | 9481 | 8183 | 0 | 0 | 0.00% | 0.00% | 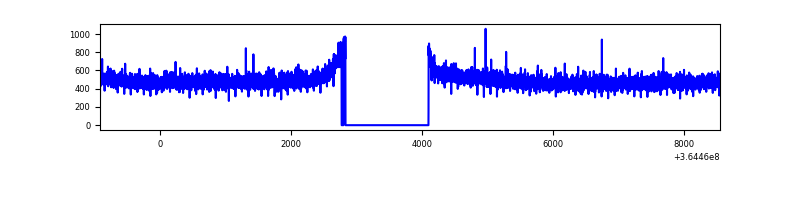 |
| B | 9481 | 8183 | 19 | 19 | 0.20% | 0.23% | 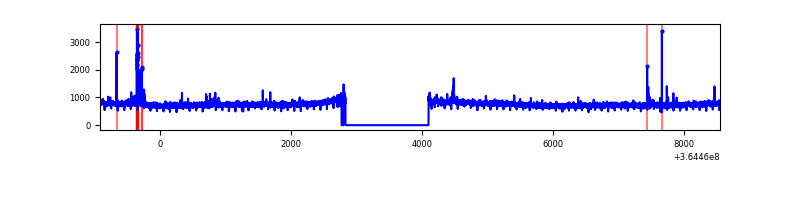 |
| C | 9481 | 8182 | 23 | 23 | 0.24% | 0.28% | 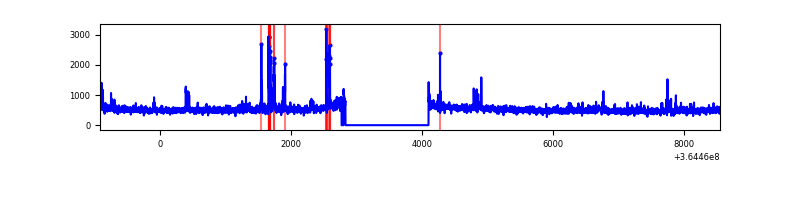 |
| D | 9481 | 8182 | 98 | 98 | 1.03% | 1.20% | 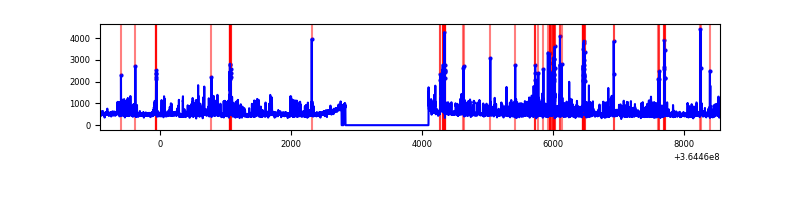 |
Top three noisy pixels from each quadrant. If the there are fewer than three noisy pixels in the level2.evt file, extra rows are filled as -1
| Pixel properties | Quadrant properties | ||||||
|---|---|---|---|---|---|---|---|
| Quadrant | DetID | PixID | Counts | Sigma | Mean | Median | Sigma |
| A | 13 | 254 | 12759 | 57.33 | 1030 | 1011 | 204.9 |
| A | 3 | 137 | 9615 | 41.98 | 1030 | 1011 | 204.9 |
| A | 0 | 226 | 8997 | 38.97 | 1030 | 1011 | 204.9 |
| B | 6 | 159 | 2144167 | 11570.21 | 999 | 977 | 185.2 |
| B | 4 | 80 | 112442 | 601.75 | 999 | 977 | 185.2 |
| B | 12 | 111 | 21952 | 113.24 | 999 | 977 | 185.2 |
| C | 14 | 238 | 171953 | 749.44 | 990 | 996 | 228.1 |
| C | 10 | 22 | 171444 | 747.21 | 990 | 996 | 228.1 |
| C | 3 | 233 | 146697 | 638.72 | 990 | 996 | 228.1 |
| D | 8 | 195 | 666307 | 2834.36 | 1005 | 982 | 234.7 |
| D | 12 | 218 | 366584 | 1557.5 | 1005 | 982 | 234.7 |
| D | 2 | 250 | 92115 | 388.24 | 1005 | 982 | 234.7 |
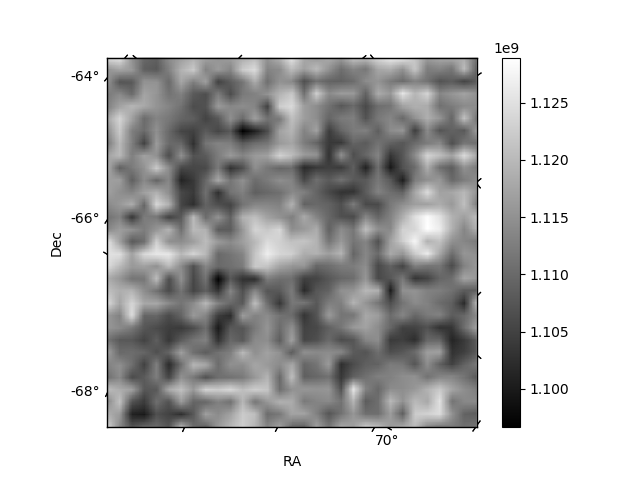
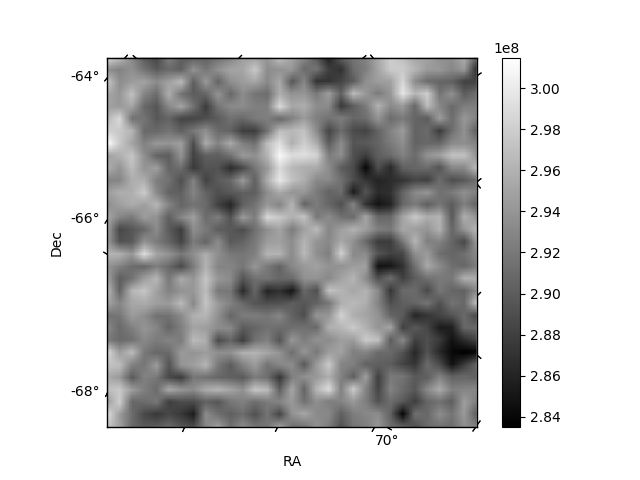
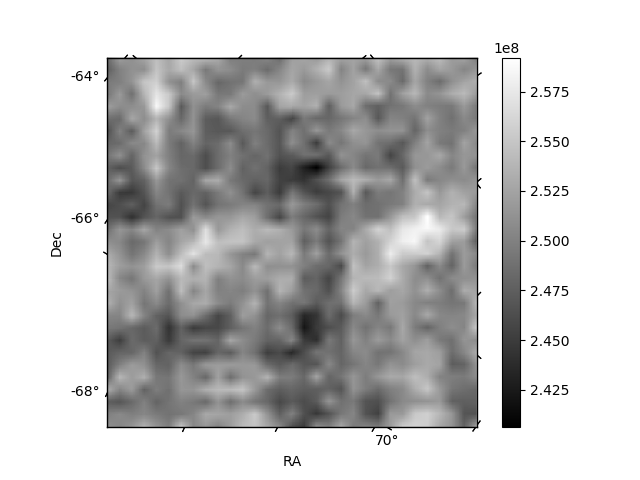
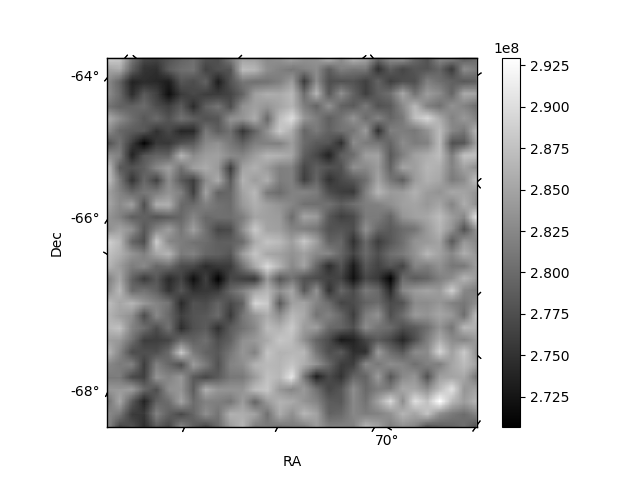
Histogram calculated using DETX and DETY for each event in the final _common_clean file
| Quadrant A | 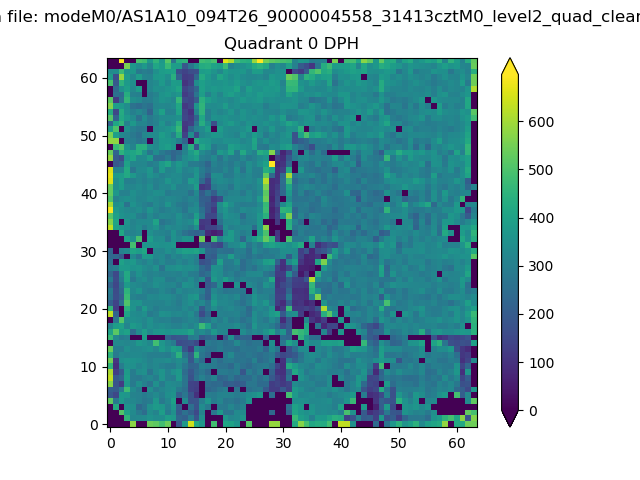 |
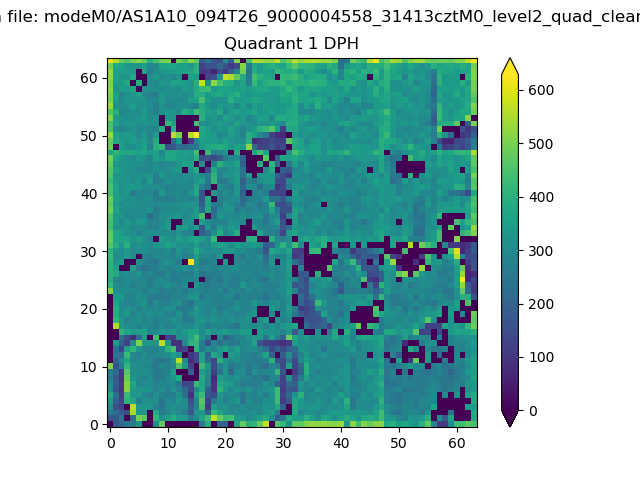 |
Quadrant B |
|---|---|---|---|
| Quadrant D | 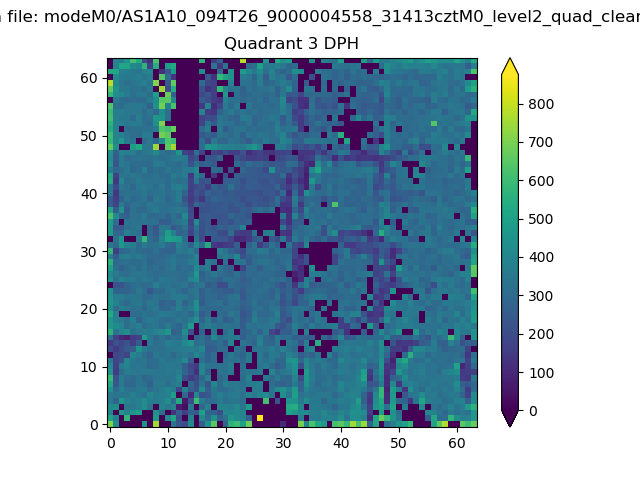 |
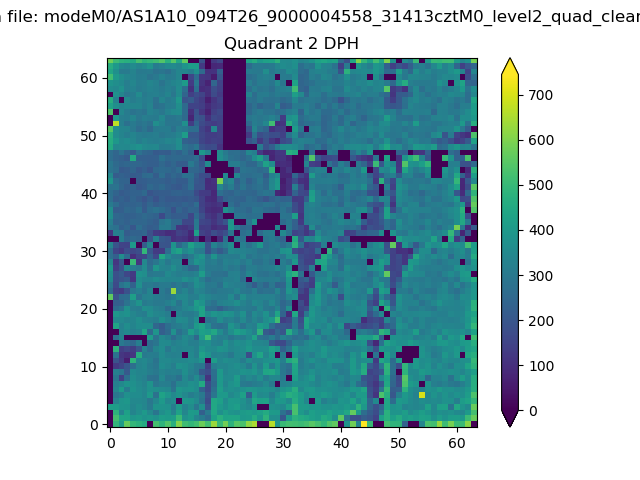 |
Quadrant C |
| Plot type | Count rate plots | Images |
|---|---|---|
| Comparison with Poisson distribution Blue bars denote a histogram of data divided into 1 sec bins. Red curve is a Poisson curve with rate = median count rate of data. |
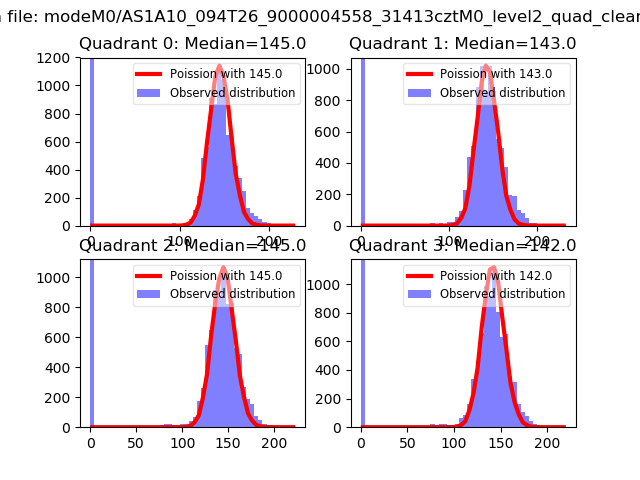 |
 |
| Quadrant-wise count rates Data is divided into 100 sec bins |
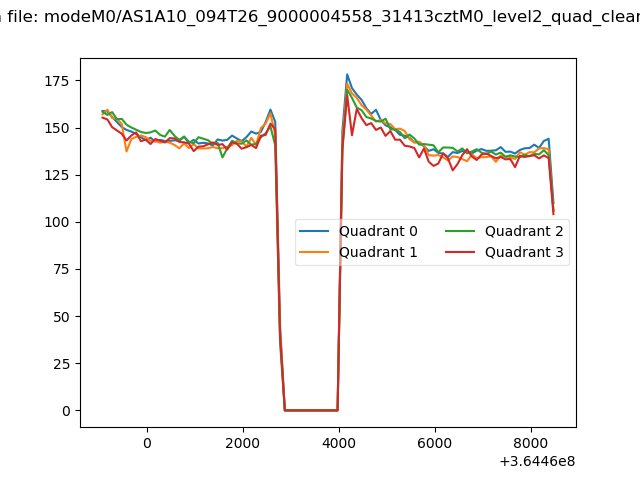 |
|
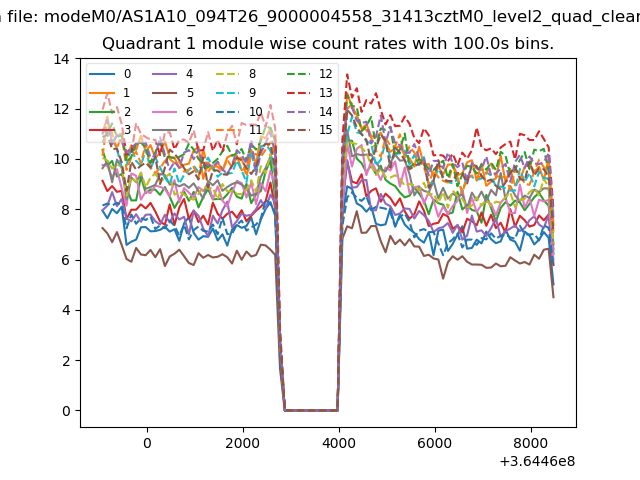
| Module-wise count rates for Quadrant A Data is divided into 100 sec bins |
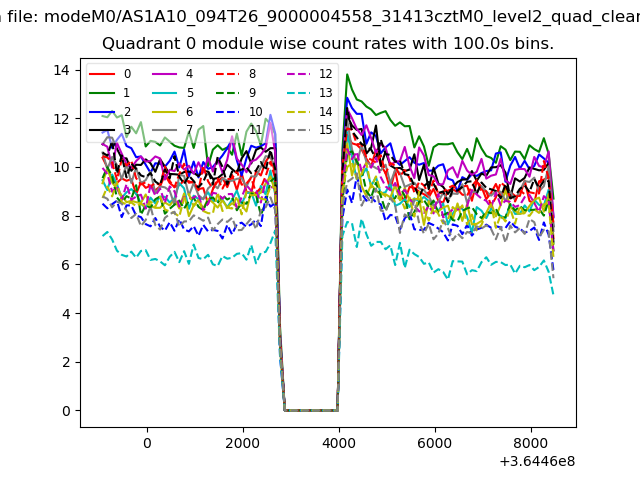 |
 |
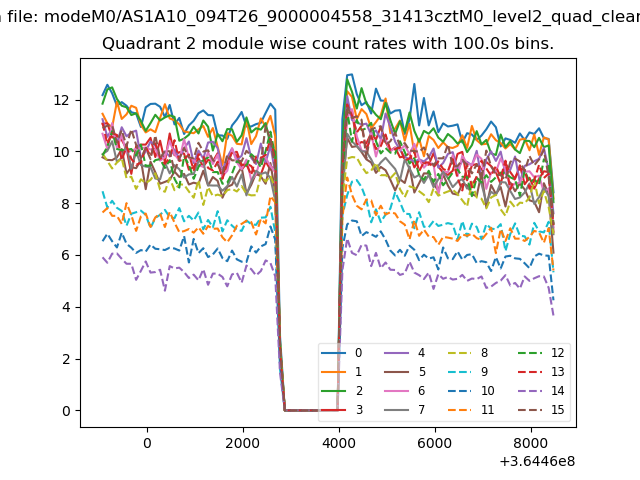
| Module-wise count rates for Quadrant B Data is divided into 100 sec bins |
 |
 |
| Module-wise count rates for Quadrant C Data is divided into 100 sec bins |
 |
 |
| Module-wise count rates for Quadrant D Data is divided into 100 sec bins |
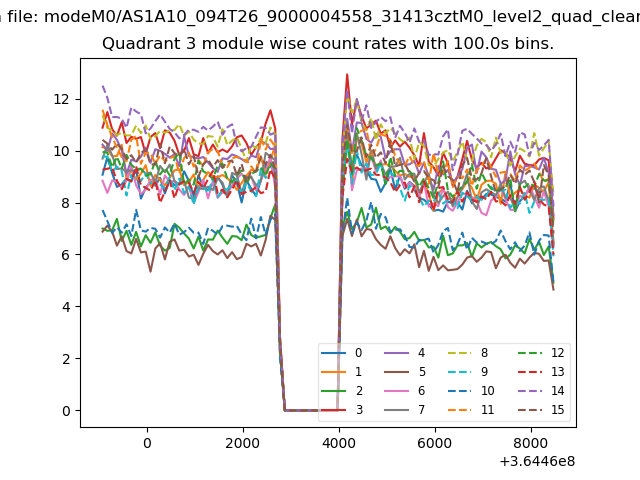 |
 |
| Parameter | Plot |
|---|---|
| CZT HV Monitor | 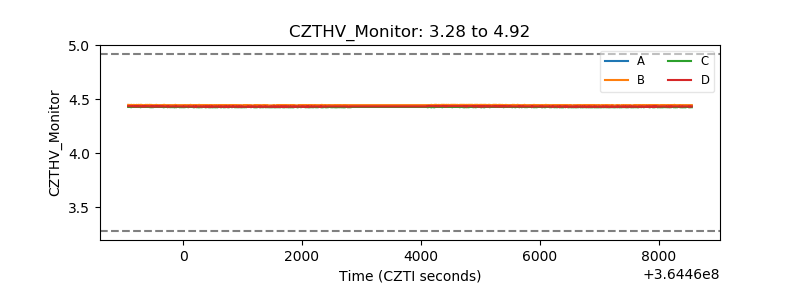 |
| D_VDD | 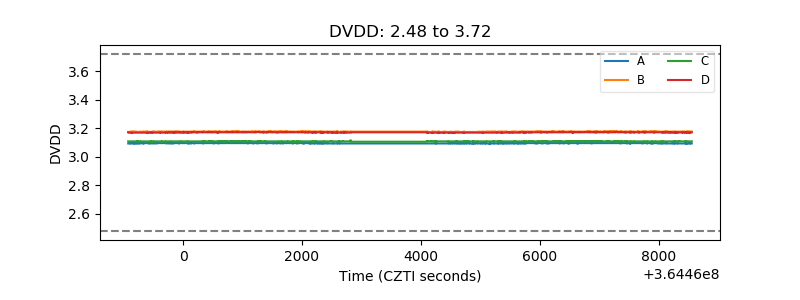 |
| Temperature 1 |  |
| Veto HV Monitor | 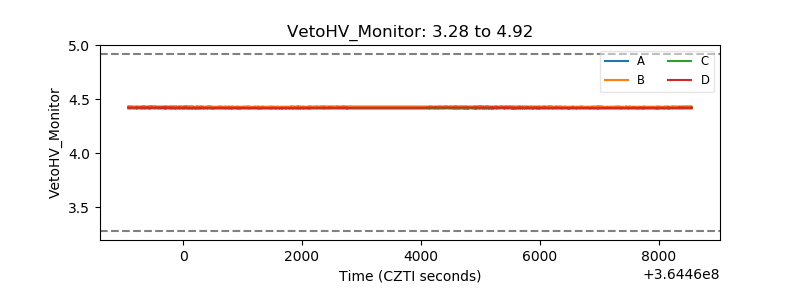 |
| Veto LLD |  |
| Alpha Counter | 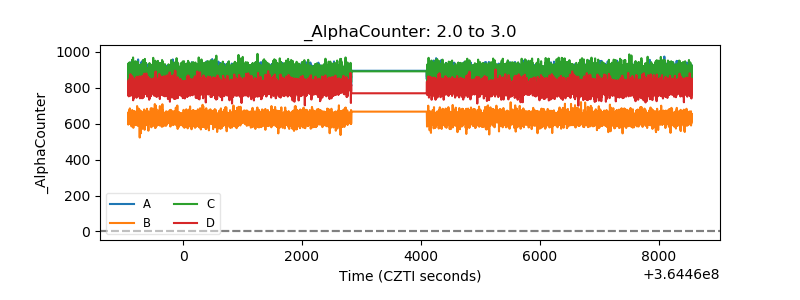 |
| _CPM_Rate | 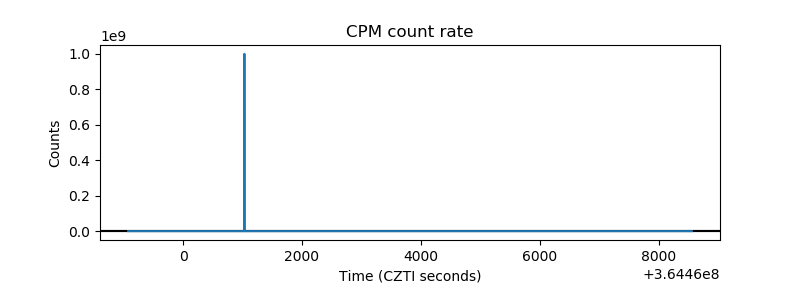 |
| CZT Counter | 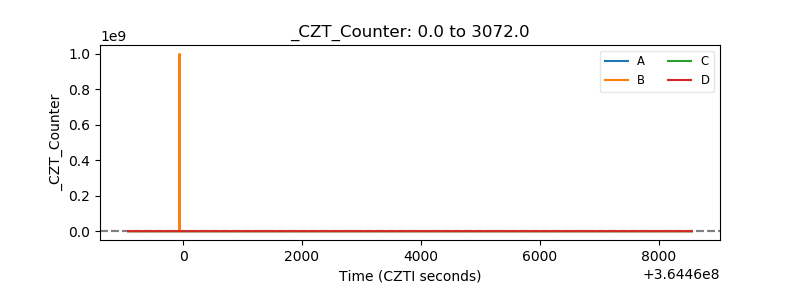 |
| +2.5 Volts monitor |  |
| +5 Volts monitor |  |
| _ROLL_ROT | 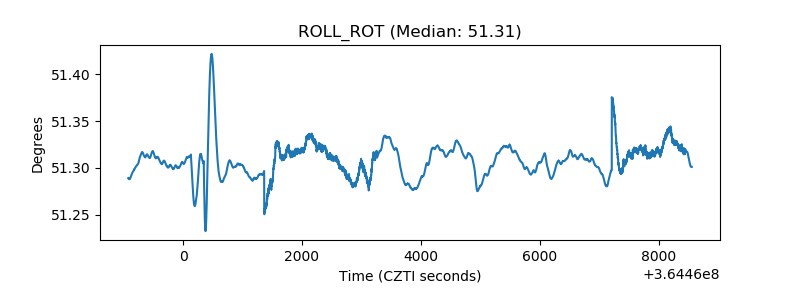 |
| _Roll_DEC |  |
| _Roll_RA | 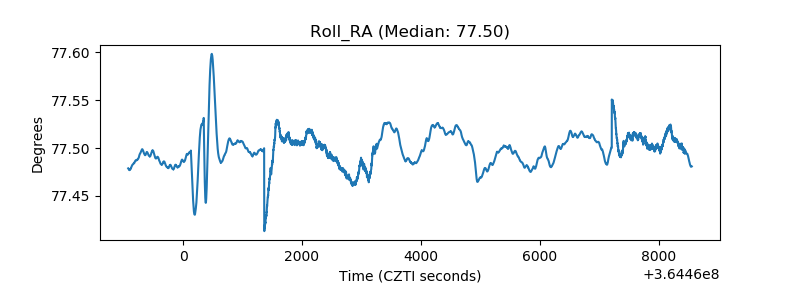 |
| Veto Counter | 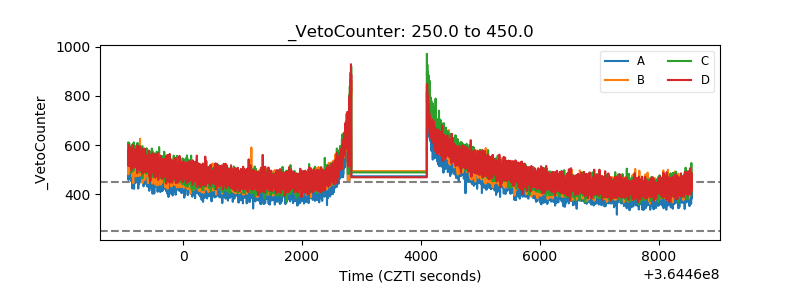 |