| Param | Original file | Final file |
|---|---|---|
| Filename | modeM0/AS1A10_094T29_9000004564cztM0_level2.fits | modeM0/AS1A10_094T29_9000004564cztM0_level2_quad_clean.evt |
| Size (bytes) | 67,993,920 | 71,043,840 |
| Size | 64.8 MB | 67.8 MB |
| Events in quadrant A | 415,918 | 435,577 |
| Events in quadrant B | 389,162 | 425,618 |
| Events in quadrant C | 404,772 | 413,464 |
| Events in quadrant D | 357,264 | 383,858 |
| Mode M0 | |||
|---|---|---|---|
| Quadrant | BADHDUFLAG | Total packets | Discarded packets |
| A | 0 | 14364 | 0 |
| B | 0 | 21597 | 0 |
| C | 0 | 14592 | 0 |
| D | 0 | 16882 | 0 |
| Mode SS | |||
|---|---|---|---|
| Quadrant | BADHDUFLAG | Total packets | Discarded packets |
| A | 0 | 144 | 0 |
| B | 0 | 144 | 0 |
| C | 0 | 144 | 0 |
| D | 0 | 144 | 0 |
| Mode M9 | |||
|---|---|---|---|
| Quadrant | BADHDUFLAG | Total packets | Discarded packets |
| A | 0 | 11 | 0 |
| B | 0 | 11 | 0 |
| C | 0 | 11 | 0 |
| D | 0 | 11 | 0 |
| Quadrant | Total seconds | Saturated seconds | Saturation percentage |
|---|---|---|---|
| A | 7068 | 34 | 0.481041% |
| B | 7068 | 102 | 1.443124% |
| C | 7068 | 82 | 1.160158% |
| D | 7068 | 47 | 0.664969% |
Noise dominated data is calculated using 1-second bins in cleaned event files. If a bin has >2000 counts, and if more than 50% of those come from <1% of pixels, then it is considered to be noise-dominated and hence unusable.
| Quadrant | # 1 sec bins | Bins with >0 counts | Bins with >2000 counts | High rate bins dominated by noise | Noise dominated (total time) | Noise dominated (detector-on time) | Marked lightcurve |
|---|---|---|---|---|---|---|---|
| A | 7987 | 7067 | 0 | 0 | 0.00% | 0.00% | 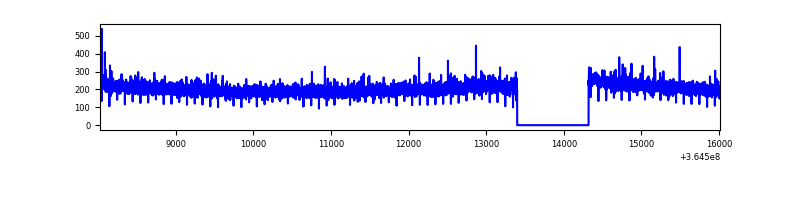 |
| B | 7987 | 7066 | 0 | 0 | 0.00% | 0.00% | 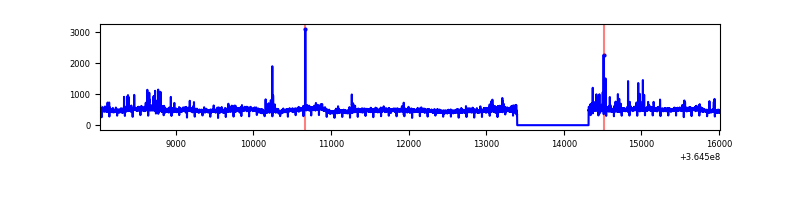 |
| C | 7987 | 7067 | 0 | 0 | 0.00% | 0.00% | 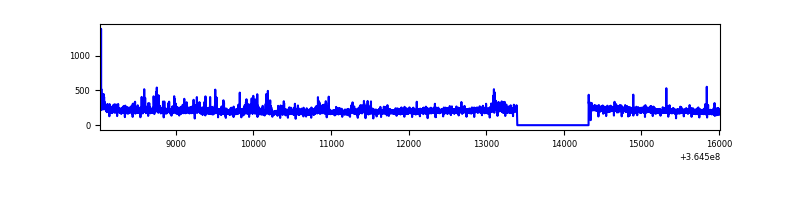 |
| D | 7987 | 7066 | 0 | 0 | 0.00% | 0.00% | 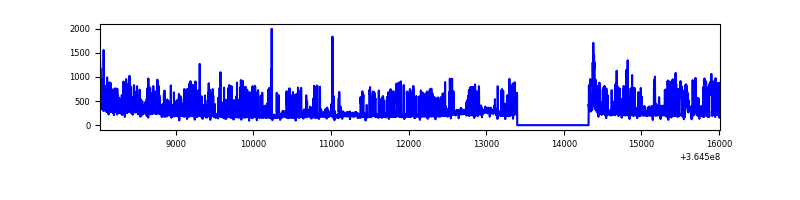 |
Top three noisy pixels from each quadrant. If the there are fewer than three noisy pixels in the level2.evt file, extra rows are filled as -1
| Pixel properties | Quadrant properties | ||||||
|---|---|---|---|---|---|---|---|
| Quadrant | DetID | PixID | Counts | Sigma | Mean | Median | Sigma |
| A | 0 | 29 | 431 | 11.51 | 108 | 102 | 28.6 |
| A | 0 | 30 | 356 | 8.89 | 108 | 102 | 28.6 |
| A | 7 | 110 | 352 | 8.75 | 108 | 102 | 28.6 |
| B | 2 | 9 | 327 | 10.17 | 102 | 98 | 22.5 |
| B | 5 | 232 | 275 | 7.86 | 102 | 98 | 22.5 |
| B | 2 | 8 | 273 | 7.77 | 102 | 98 | 22.5 |
| C | 1 | 81 | 312 | 7.4 | 106 | 100 | 28.7 |
| C | 1 | 65 | 310 | 7.33 | 106 | 100 | 28.7 |
| C | 1 | 80 | 306 | 7.19 | 106 | 100 | 28.7 |
| D | 15 | 47 | 274 | 6.28 | 101 | 92 | 29.0 |
| D | 3 | 14 | 262 | 5.87 | 101 | 92 | 29.0 |
| D | 7 | 3 | 261 | 5.83 | 101 | 92 | 29.0 |
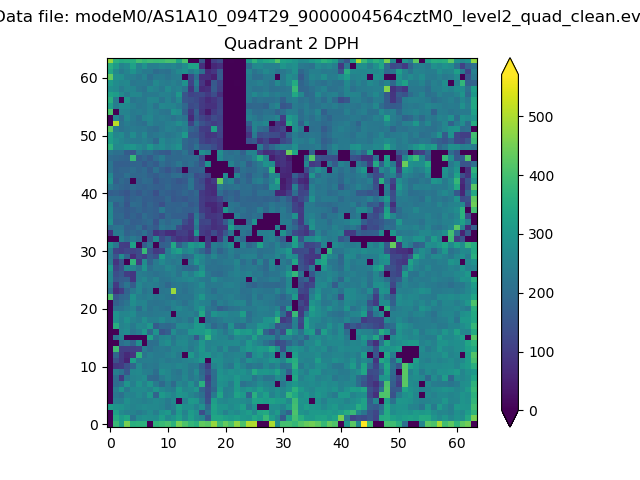
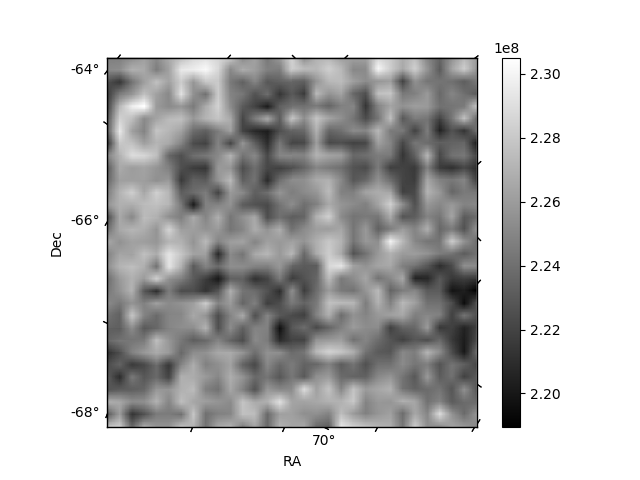
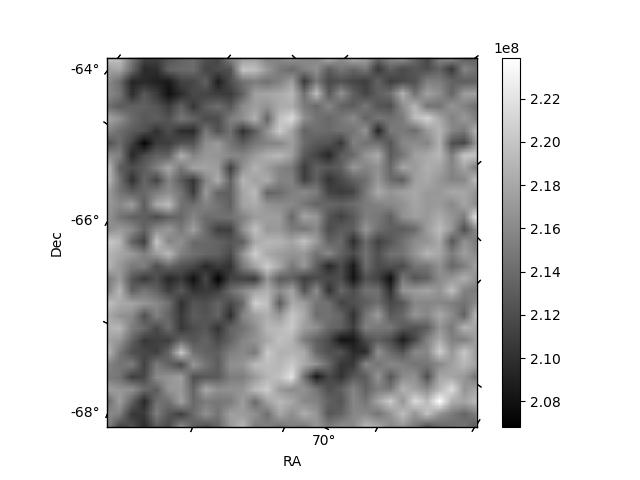
Histogram calculated using DETX and DETY for each event in the final _common_clean file
| Quadrant A | 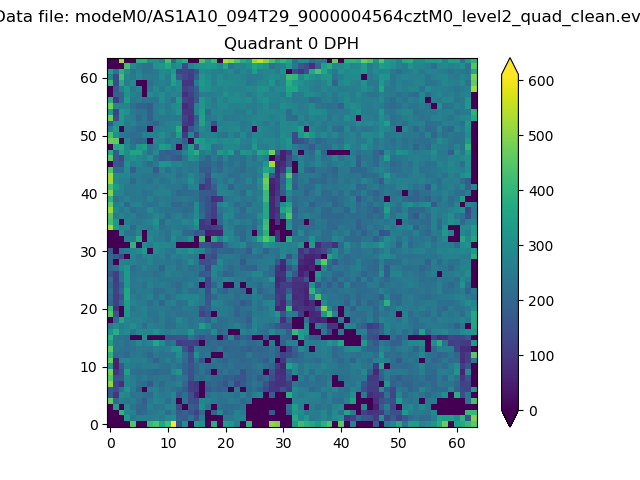 |
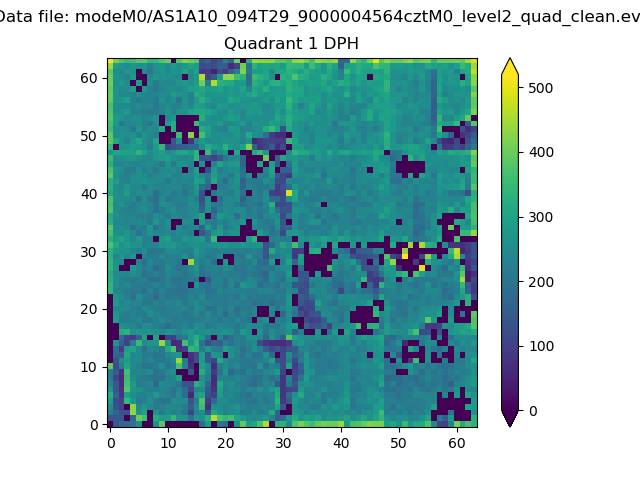 |
Quadrant B |
|---|---|---|---|
| Quadrant D | 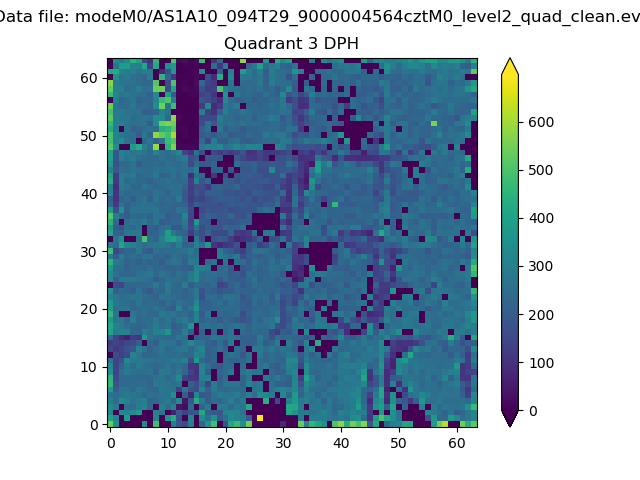 |
 |
Quadrant C |
| Plot type | Count rate plots | Images |
|---|---|---|
| Comparison with Poisson distribution Blue bars denote a histogram of data divided into 1 sec bins. Red curve is a Poisson curve with rate = median count rate of data. |
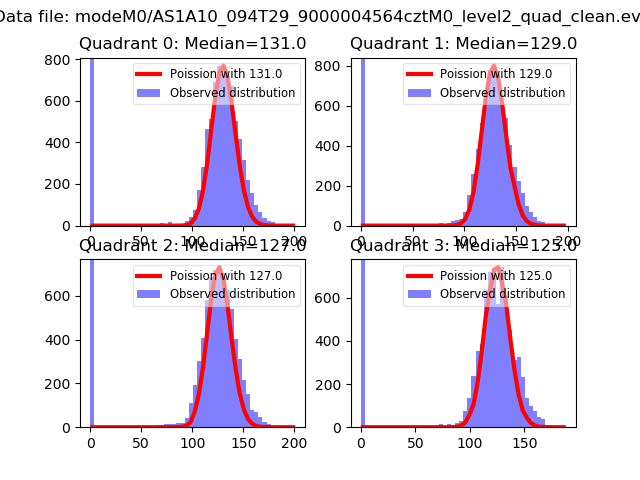 |
 |
| Quadrant-wise count rates Data is divided into 100 sec bins |
 |
|
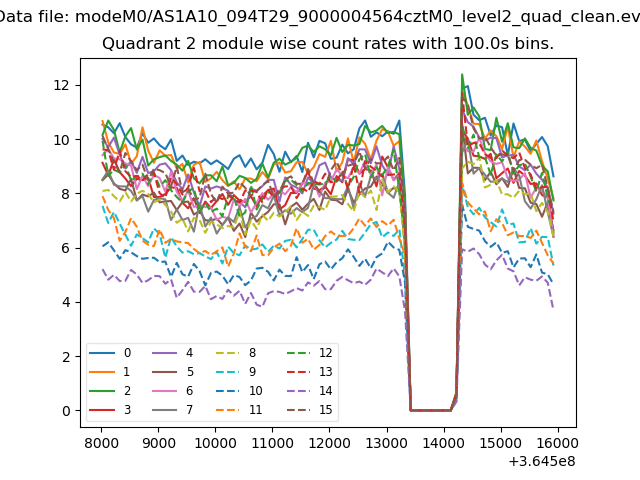
| Module-wise count rates for Quadrant A Data is divided into 100 sec bins |
 |
 |
| Module-wise count rates for Quadrant B Data is divided into 100 sec bins |
 |
 |
| Module-wise count rates for Quadrant C Data is divided into 100 sec bins |
 |
 |
| Module-wise count rates for Quadrant D Data is divided into 100 sec bins |
 |
 |
| Parameter | Plot |
|---|---|
| CZT HV Monitor |  |
| D_VDD | 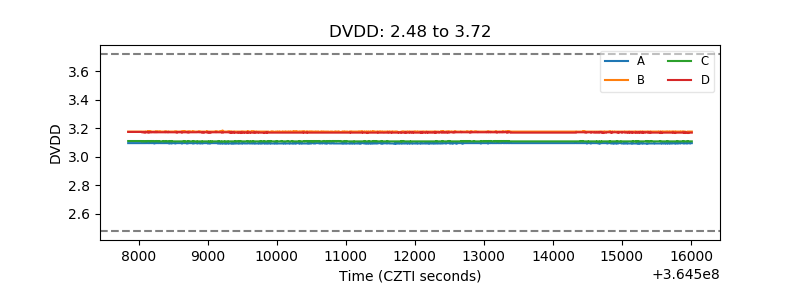 |
| Temperature 1 | 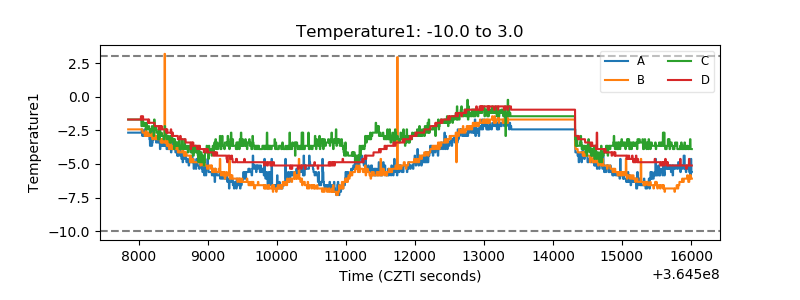 |
| Veto HV Monitor | 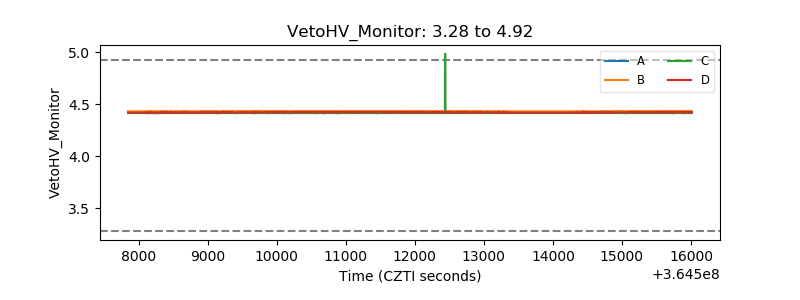 |
| Veto LLD |  |
| Alpha Counter |  |
| _CPM_Rate | 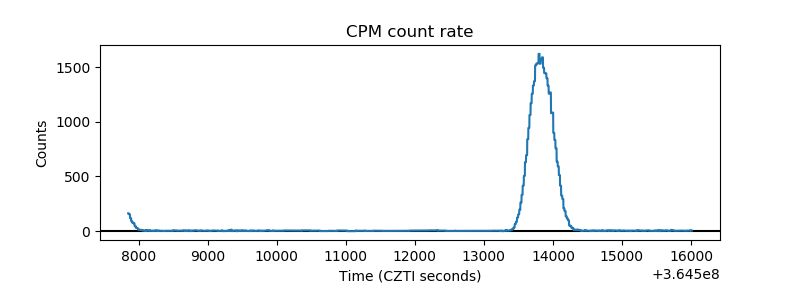 |
| CZT Counter |  |
| +2.5 Volts monitor |  |
| +5 Volts monitor | 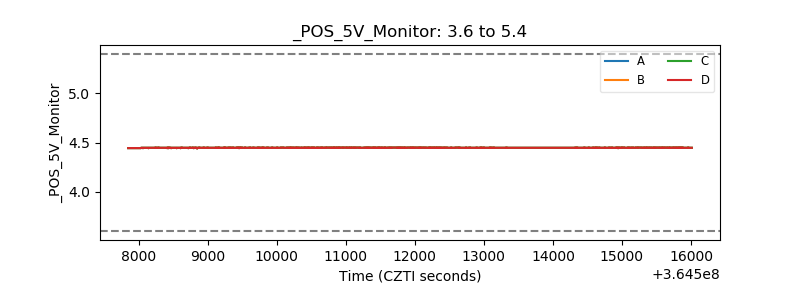 |
| _ROLL_ROT | 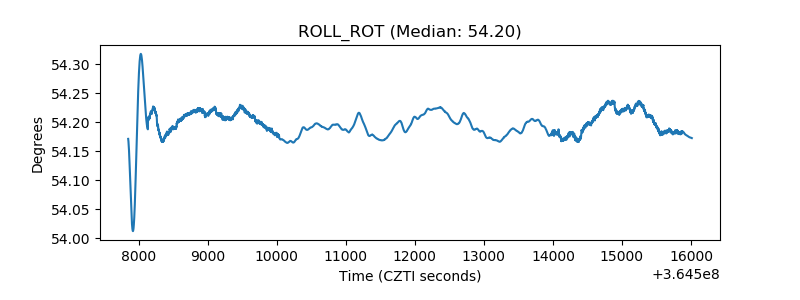 |
| _Roll_DEC |  |
| _Roll_RA |  |
| Veto Counter | 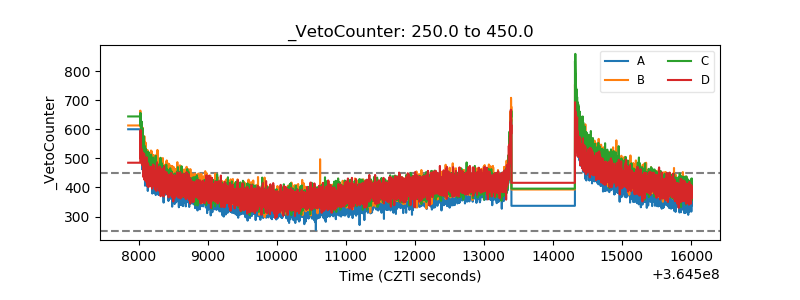 |