| Param | Original file | Final file |
|---|---|---|
| Filename | modeM0/AS1A10_094T29_9000004564_31419cztM0_level2.evt | modeM0/AS1A10_094T29_9000004564_31419cztM0_level2_quad_clean.evt |
| Size (bytes) | 117,417,600 | 28,532,160 |
| Size | 112.0 MB | 27.2 MB |
| Events in quadrant A | 692,864 | 193,125 |
| Events in quadrant B | 1,155,348 | 190,816 |
| Events in quadrant C | 732,618 | 187,792 |
| Events in quadrant D | 873,419 | 183,691 |
| Mode M0 | |||
|---|---|---|---|
| Quadrant | BADHDUFLAG | Total packets | Discarded packets |
| A | 0 | 2966 | 1 |
| B | 0 | 4481 | 1 |
| C | 0 | 3059 | 1 |
| D | 0 | 3566 | 1 |
| Mode SS | |||
|---|---|---|---|
| Quadrant | BADHDUFLAG | Total packets | Discarded packets |
| A | 0 | 30 | 0 |
| B | 0 | 30 | 0 |
| C | 0 | 30 | 0 |
| D | 0 | 30 | 0 |
| Mode M9 | |||
|---|---|---|---|
| Quadrant | BADHDUFLAG | Total packets | Discarded packets |
| A | 0 | 2 | 0 |
| B | 0 | 2 | 0 |
| C | 0 | 2 | 0 |
| D | 0 | 2 | 0 |
| Quadrant | Total seconds | Saturated seconds | Saturation percentage |
|---|---|---|---|
| A | 1454 | 5 | 0.343879% |
| B | 1454 | 22 | 1.513067% |
| C | 1454 | 13 | 0.894085% |
| D | 1453 | 17 | 1.169993% |
Noise dominated data is calculated using 1-second bins in cleaned event files. If a bin has >2000 counts, and if more than 50% of those come from <1% of pixels, then it is considered to be noise-dominated and hence unusable.
| Quadrant | # 1 sec bins | Bins with >0 counts | Bins with >2000 counts | High rate bins dominated by noise | Noise dominated (total time) | Noise dominated (detector-on time) | Marked lightcurve |
|---|---|---|---|---|---|---|---|
| A | 1454 | 1454 | 0 | 0 | 0.00% | 0.00% | 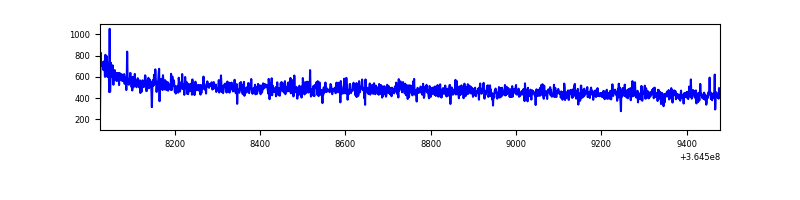 |
| B | 1454 | 1454 | 2 | 2 | 0.14% | 0.14% | 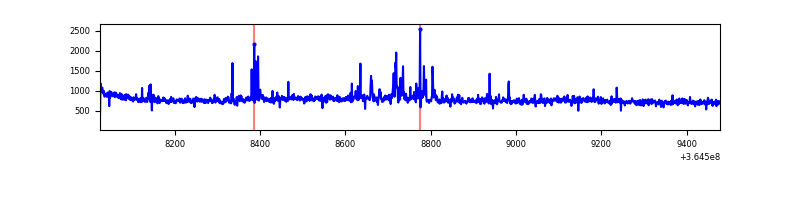 |
| C | 1454 | 1454 | 1 | 1 | 0.07% | 0.07% | 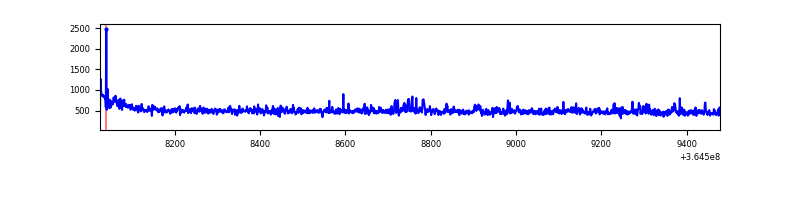 |
| D | 1453 | 1453 | 11 | 11 | 0.76% | 0.76% | 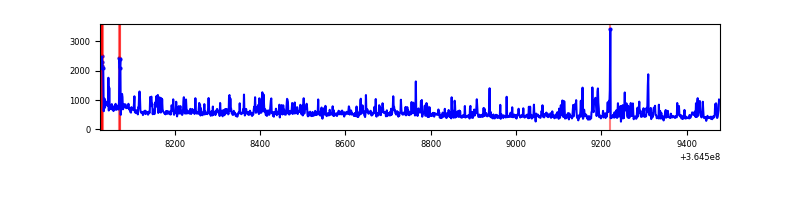 |
Top three noisy pixels from each quadrant. If the there are fewer than three noisy pixels in the level2.evt file, extra rows are filled as -1
| Pixel properties | Quadrant properties | ||||||
|---|---|---|---|---|---|---|---|
| Quadrant | DetID | PixID | Counts | Sigma | Mean | Median | Sigma |
| A | 13 | 254 | 2767 | 68.14 | 179 | 175 | 38.0 |
| A | 3 | 137 | 1904 | 45.45 | 179 | 175 | 38.0 |
| A | 0 | 226 | 1581 | 36.96 | 179 | 175 | 38.0 |
| B | 6 | 159 | 395513 | 10829.97 | 177 | 173 | 36.5 |
| B | 12 | 18 | 22445 | 610.12 | 177 | 173 | 36.5 |
| B | 0 | 199 | 10609 | 285.88 | 177 | 173 | 36.5 |
| C | 3 | 233 | 35808 | 859.03 | 167 | 167 | 41.5 |
| C | 14 | 238 | 27997 | 670.77 | 167 | 167 | 41.5 |
| C | 0 | 10 | 6350 | 149.03 | 167 | 167 | 41.5 |
| D | 8 | 195 | 102115 | 2435.77 | 166 | 161 | 41.9 |
| D | 1 | 52 | 56695 | 1350.64 | 166 | 161 | 41.9 |
| D | 12 | 218 | 31549 | 749.89 | 166 | 161 | 41.9 |
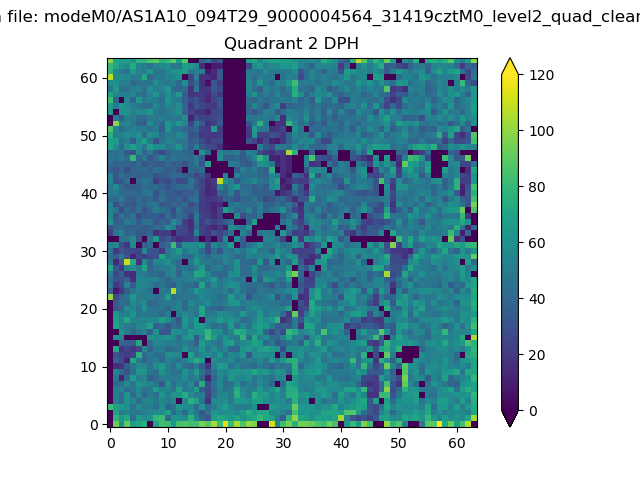
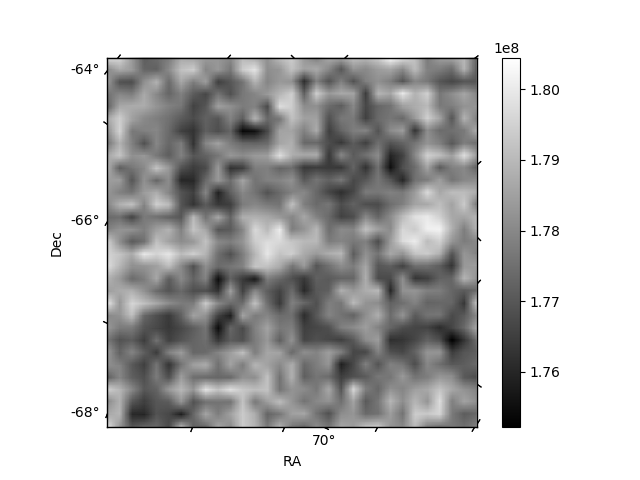
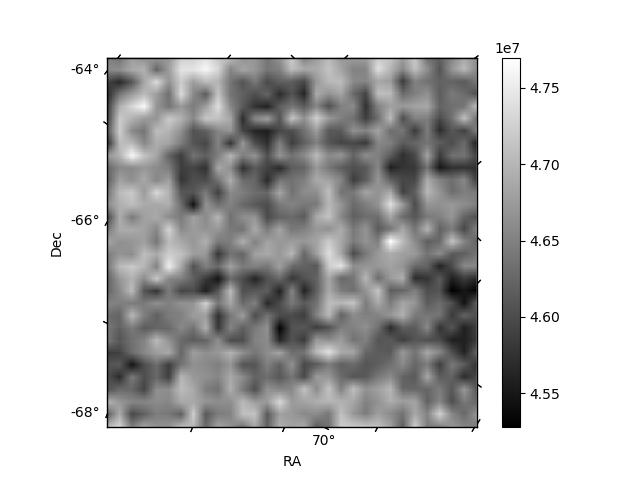
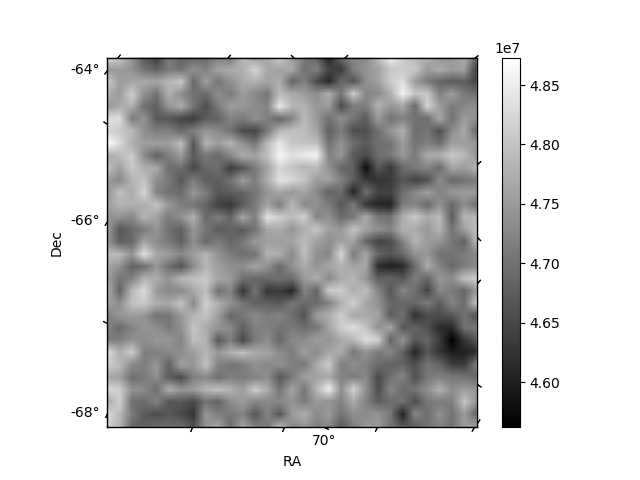
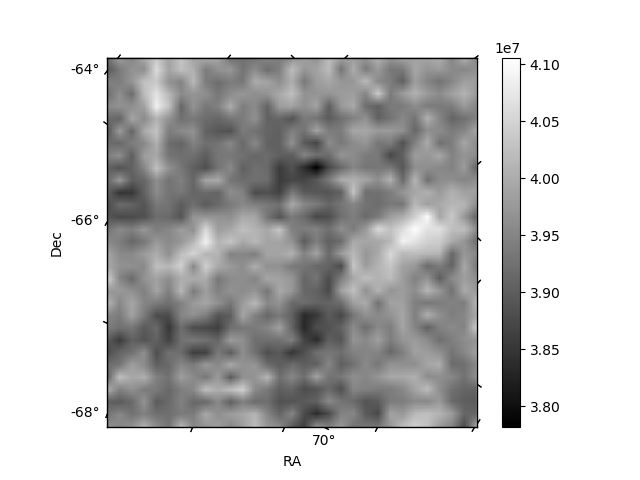
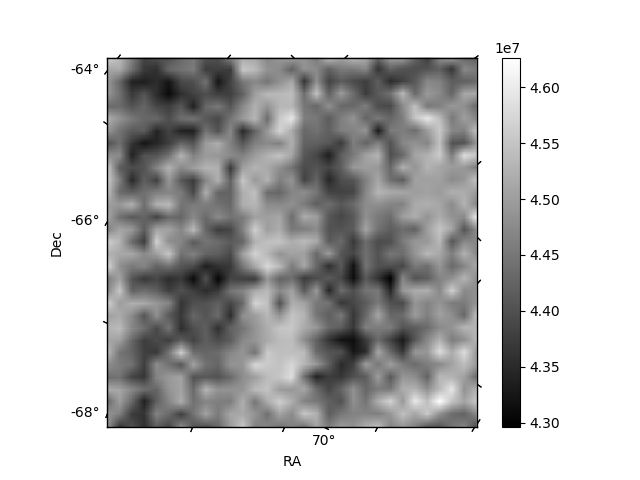
Histogram calculated using DETX and DETY for each event in the final _common_clean file
| Quadrant A | 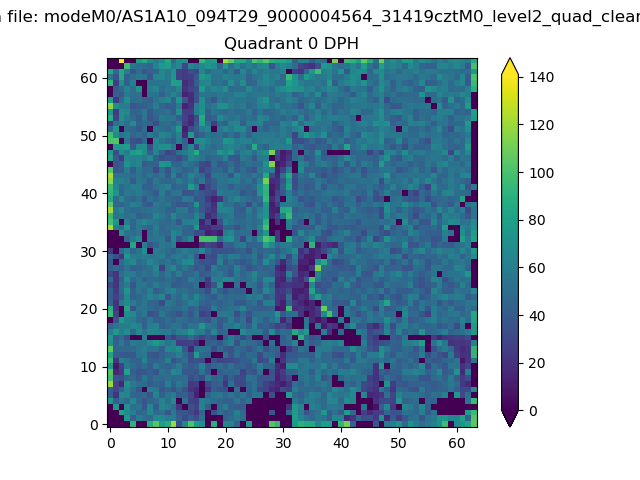 |
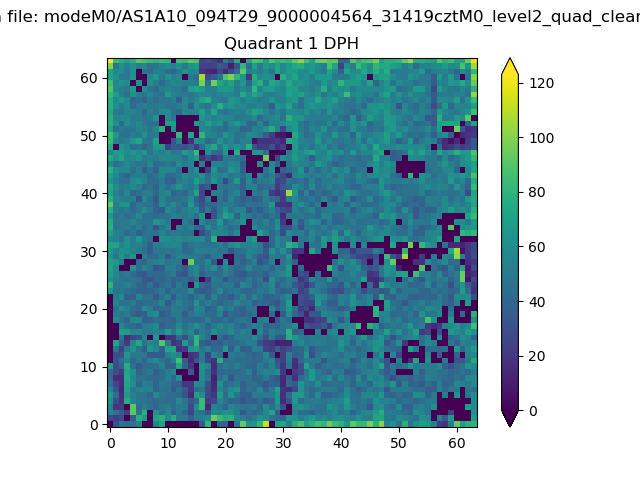 |
Quadrant B |
|---|---|---|---|
| Quadrant D | 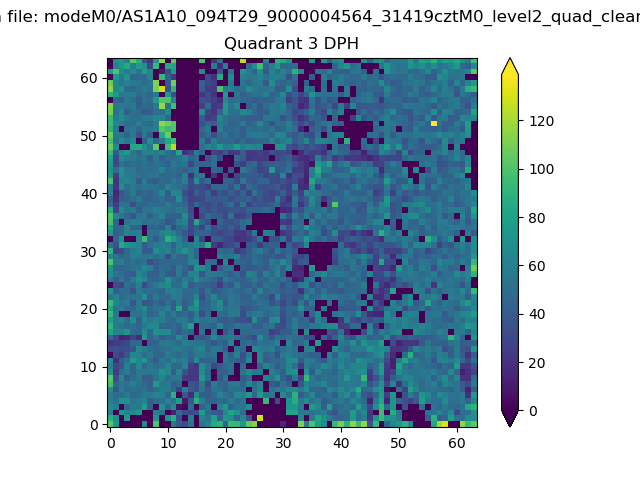 |
 |
Quadrant C |
| Plot type | Count rate plots | Images |
|---|---|---|
| Comparison with Poisson distribution Blue bars denote a histogram of data divided into 1 sec bins. Red curve is a Poisson curve with rate = median count rate of data. |
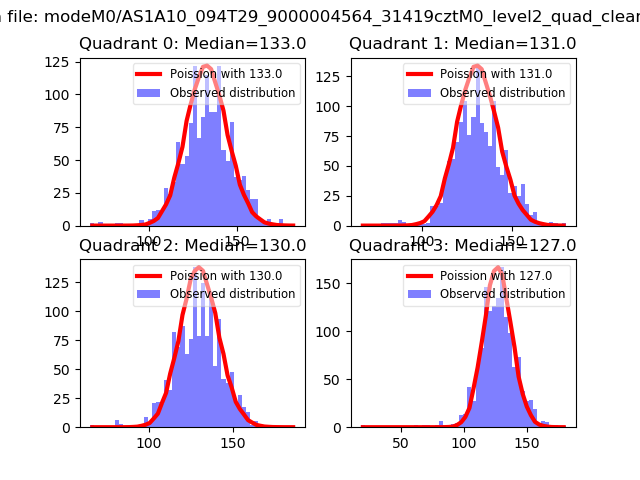 |
 |
| Quadrant-wise count rates Data is divided into 100 sec bins |
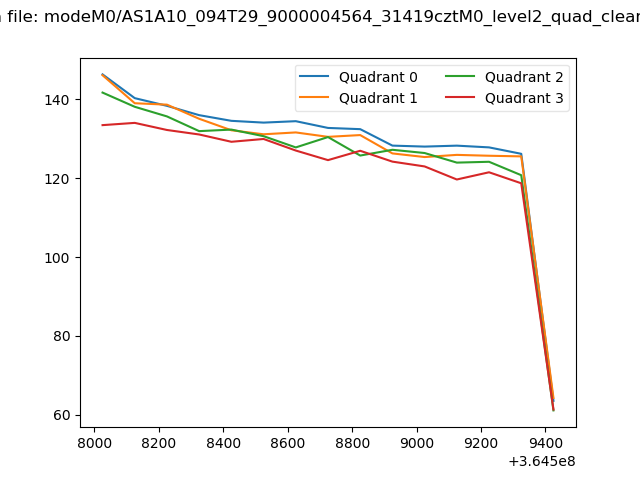 |
|
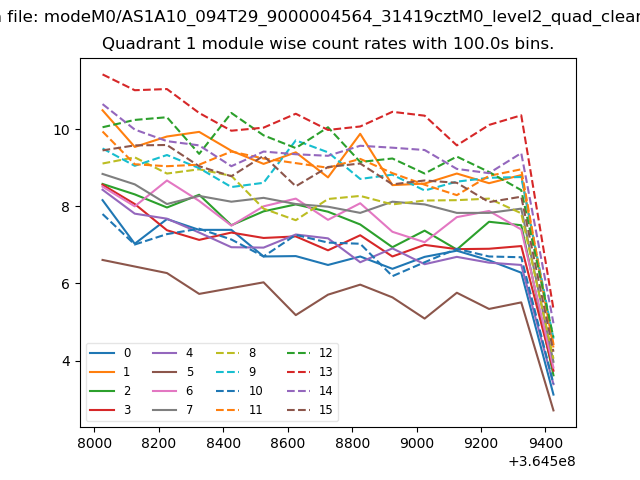
| Module-wise count rates for Quadrant A Data is divided into 100 sec bins |
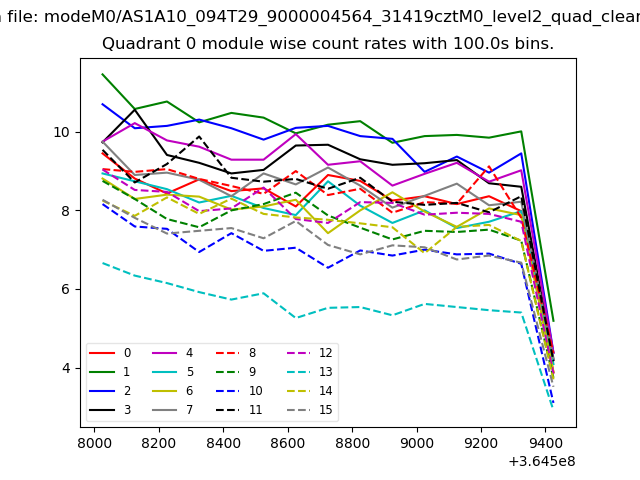 |
 |
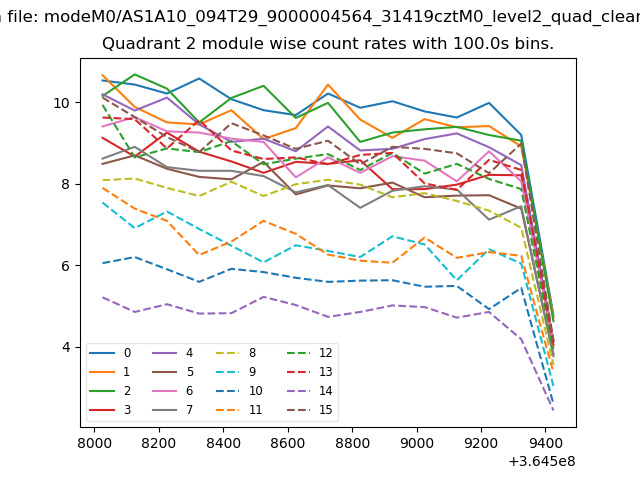
| Module-wise count rates for Quadrant B Data is divided into 100 sec bins |
 |
 |
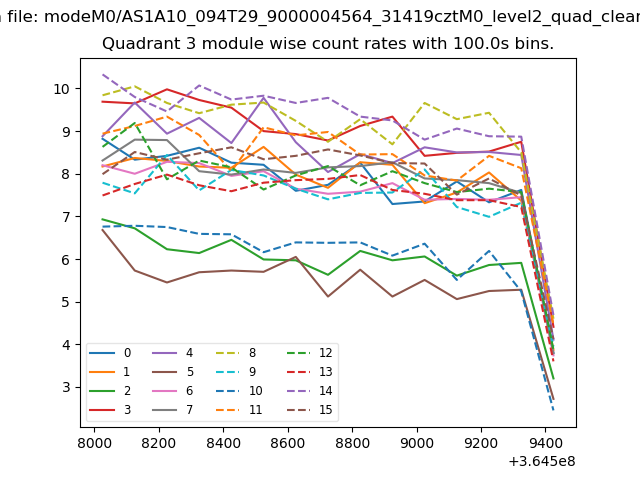
| Module-wise count rates for Quadrant C Data is divided into 100 sec bins |
 |
 |
| Module-wise count rates for Quadrant D Data is divided into 100 sec bins |
 |
 |
| Parameter | Plot |
|---|---|
| CZT HV Monitor | 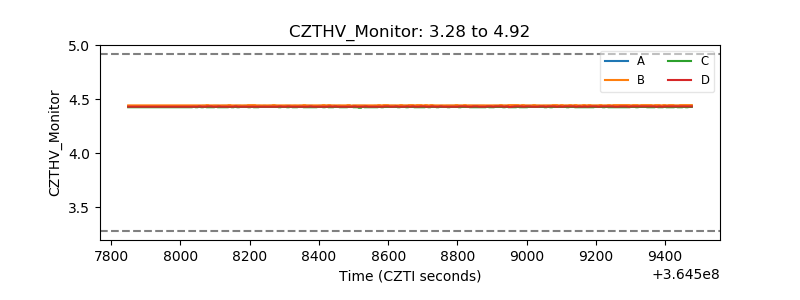 |
| D_VDD | 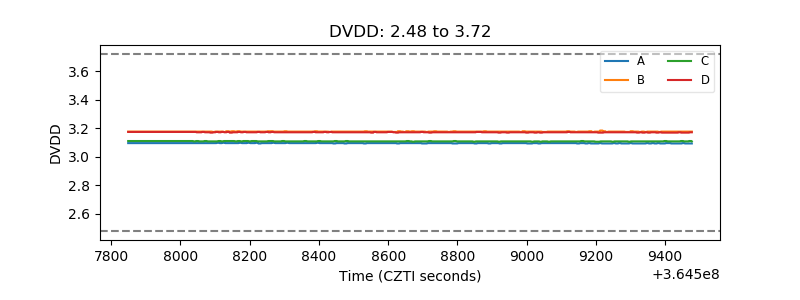 |
| Temperature 1 | 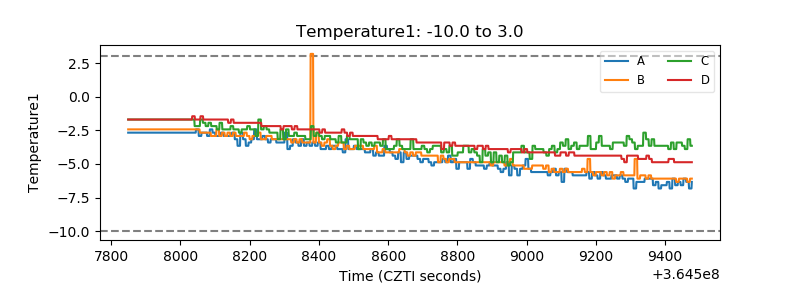 |
| Veto HV Monitor | 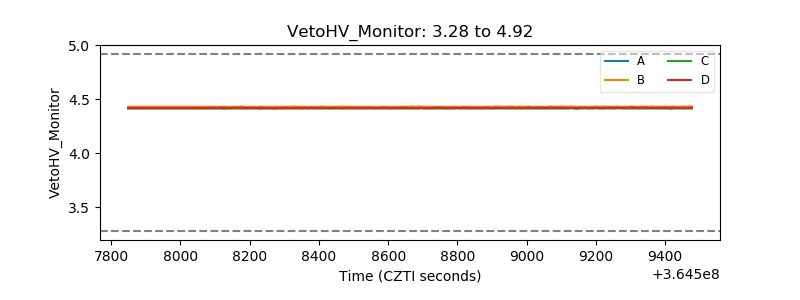 |
| Veto LLD | 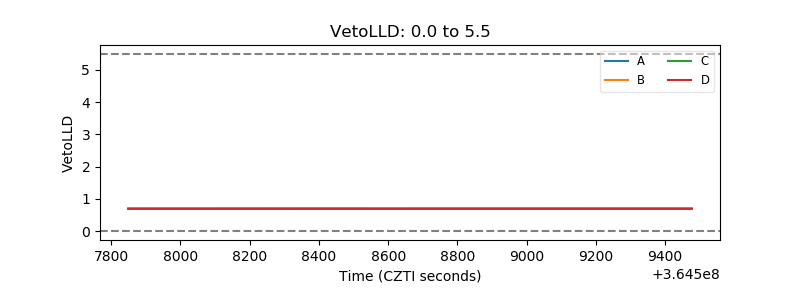 |
| Alpha Counter | 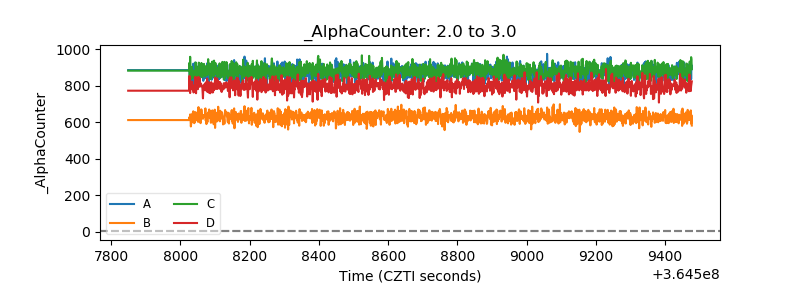 |
| _CPM_Rate | 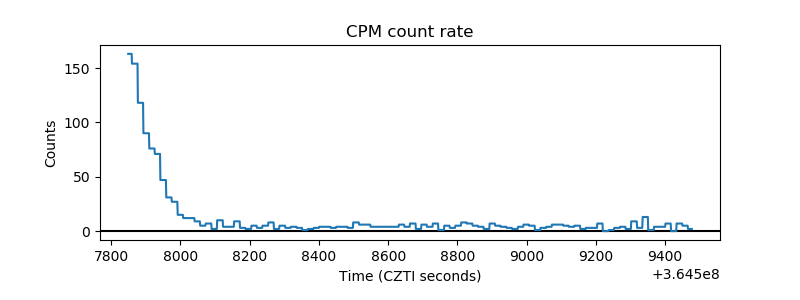 |
| CZT Counter | 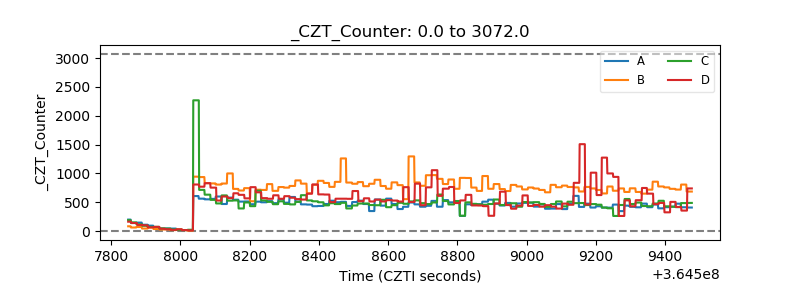 |
| +2.5 Volts monitor |  |
| +5 Volts monitor | 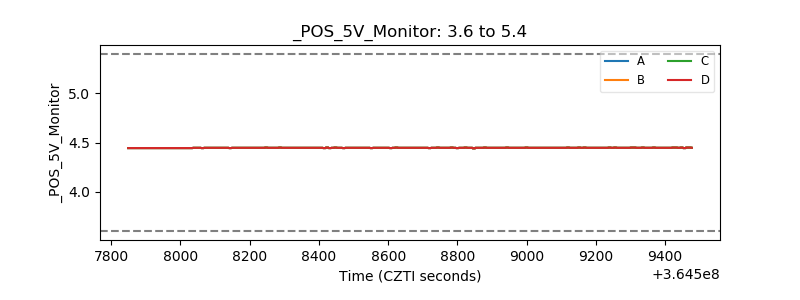 |
| _ROLL_ROT | 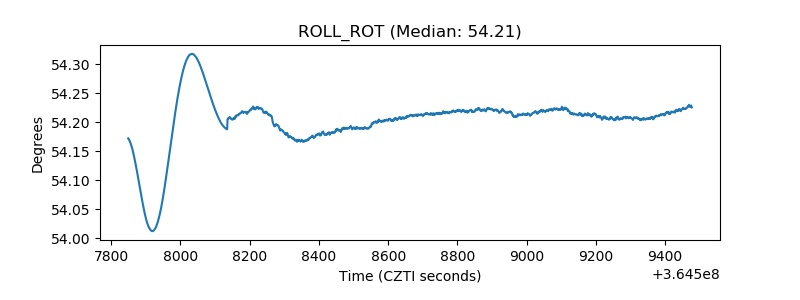 |
| _Roll_DEC | 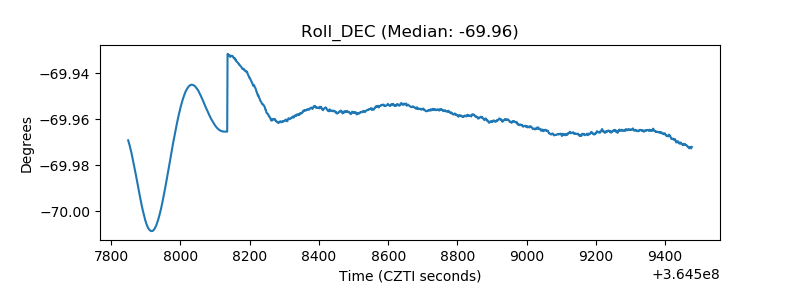 |
| _Roll_RA | 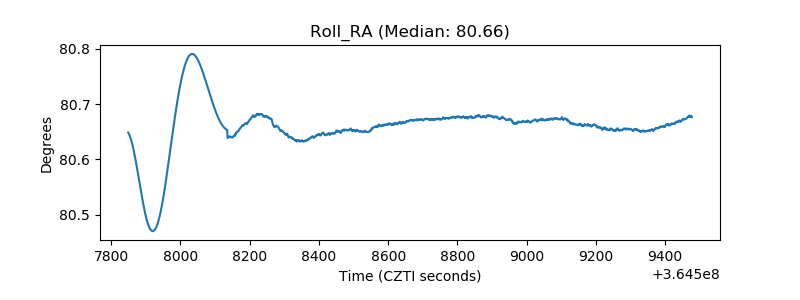 |
| Veto Counter | 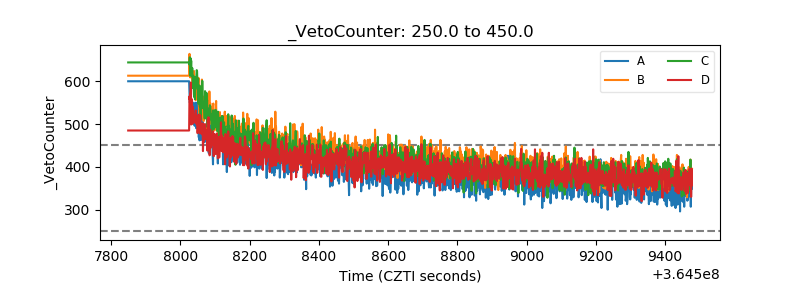 |