| Param | Original file | Final file |
|---|---|---|
| Filename | modeM0/AS1A10_094T29_9000004564_31420cztM0_level2.evt | modeM0/AS1A10_094T29_9000004564_31420cztM0_level2_quad_clean.evt |
| Size (bytes) | 525,156,480 | 129,870,720 |
| Size | 500.8 MB | 123.9 MB |
| Events in quadrant A | 3,119,115 | 885,095 |
| Events in quadrant B | 5,212,342 | 874,462 |
| Events in quadrant C | 3,297,123 | 857,196 |
| Events in quadrant D | 3,819,241 | 847,337 |
| Mode M0 | |||
|---|---|---|---|
| Quadrant | BADHDUFLAG | Total packets | Discarded packets |
| A | 0 | 13696 | 2 |
| B | 0 | 20589 | 2 |
| C | 0 | 13918 | 2 |
| D | 0 | 15903 | 2 |
| Mode SS | |||
|---|---|---|---|
| Quadrant | BADHDUFLAG | Total packets | Discarded packets |
| A | 0 | 138 | 0 |
| B | 0 | 138 | 0 |
| C | 0 | 138 | 0 |
| D | 0 | 138 | 0 |
| Mode M9 | |||
|---|---|---|---|
| Quadrant | BADHDUFLAG | Total packets | Discarded packets |
| A | 0 | 9 | 0 |
| B | 0 | 10 | 0 |
| C | 0 | 10 | 0 |
| D | 0 | 10 | 0 |
| Quadrant | Total seconds | Saturated seconds | Saturation percentage |
|---|---|---|---|
| A | 6733 | 34 | 0.504975% |
| B | 6733 | 102 | 1.514926% |
| C | 6733 | 78 | 1.158473% |
| D | 6733 | 47 | 0.698054% |
Noise dominated data is calculated using 1-second bins in cleaned event files. If a bin has >2000 counts, and if more than 50% of those come from <1% of pixels, then it is considered to be noise-dominated and hence unusable.
| Quadrant | # 1 sec bins | Bins with >0 counts | Bins with >2000 counts | High rate bins dominated by noise | Noise dominated (total time) | Noise dominated (detector-on time) | Marked lightcurve |
|---|---|---|---|---|---|---|---|
| A | 7653 | 6734 | 0 | 0 | 0.00% | 0.00% |  |
| B | 7653 | 6733 | 11 | 11 | 0.14% | 0.16% |  |
| C | 7653 | 6734 | 1 | 1 | 0.01% | 0.01% | 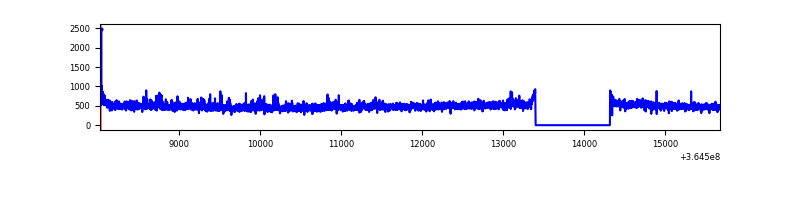 |
| D | 7653 | 6733 | 17 | 17 | 0.22% | 0.25% |  |
Top three noisy pixels from each quadrant. If the there are fewer than three noisy pixels in the level2.evt file, extra rows are filled as -1
| Pixel properties | Quadrant properties | ||||||
|---|---|---|---|---|---|---|---|
| Quadrant | DetID | PixID | Counts | Sigma | Mean | Median | Sigma |
| A | 13 | 254 | 12426 | 72.27 | 807 | 792 | 161.0 |
| A | 3 | 137 | 8432 | 47.46 | 807 | 792 | 161.0 |
| A | 0 | 226 | 7026 | 38.72 | 807 | 792 | 161.0 |
| B | 6 | 159 | 1860527 | 12243.46 | 798 | 777 | 151.9 |
| B | 4 | 80 | 107138 | 700.22 | 798 | 777 | 151.9 |
| B | 0 | 230 | 23810 | 151.64 | 798 | 777 | 151.9 |
| C | 14 | 238 | 127440 | 691.01 | 776 | 779 | 183.3 |
| C | 3 | 233 | 118762 | 643.66 | 776 | 779 | 183.3 |
| C | 2 | 114 | 15584 | 80.77 | 776 | 779 | 183.3 |
| D | 8 | 195 | 631363 | 3287.96 | 777 | 757 | 191.8 |
| D | 2 | 250 | 76942 | 397.22 | 777 | 757 | 191.8 |
| D | 12 | 218 | 72423 | 373.66 | 777 | 757 | 191.8 |
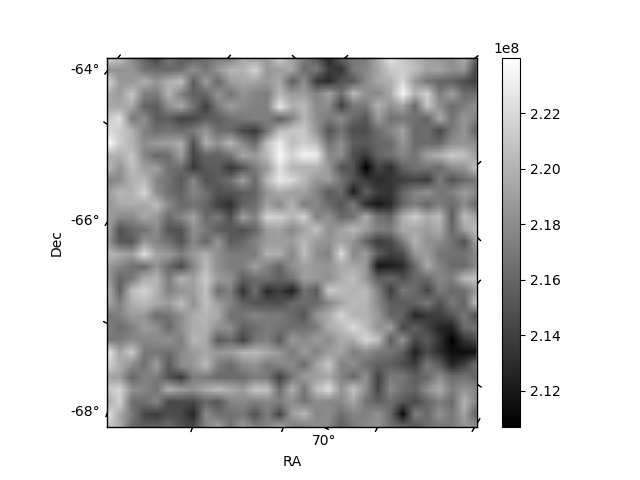
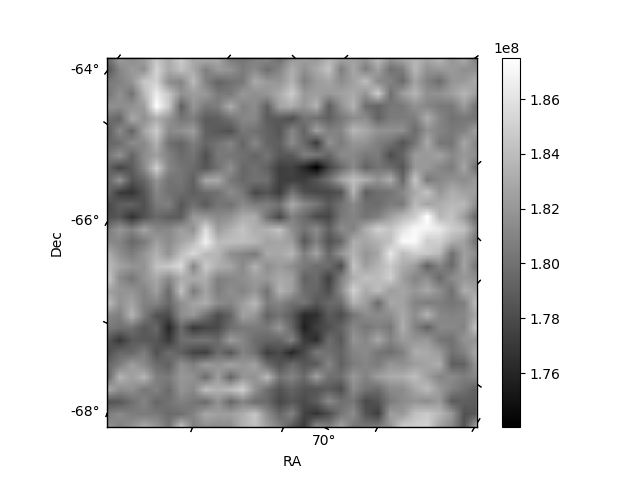
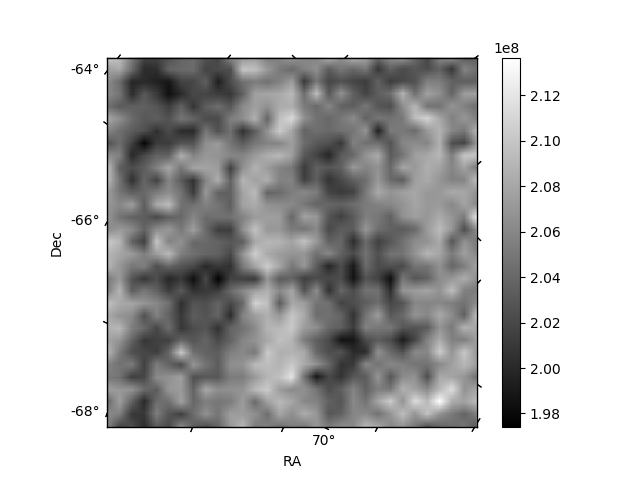
Histogram calculated using DETX and DETY for each event in the final _common_clean file
| Quadrant A | 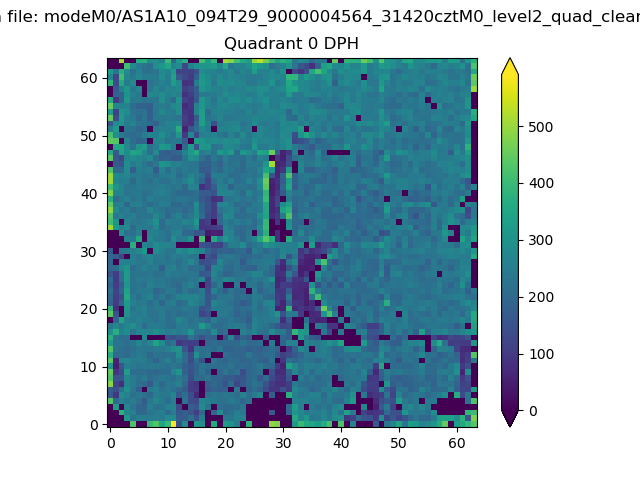 |
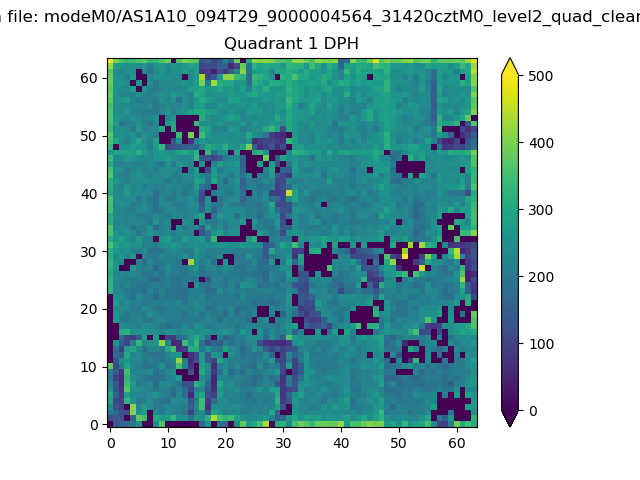 |
Quadrant B |
|---|---|---|---|
| Quadrant D | 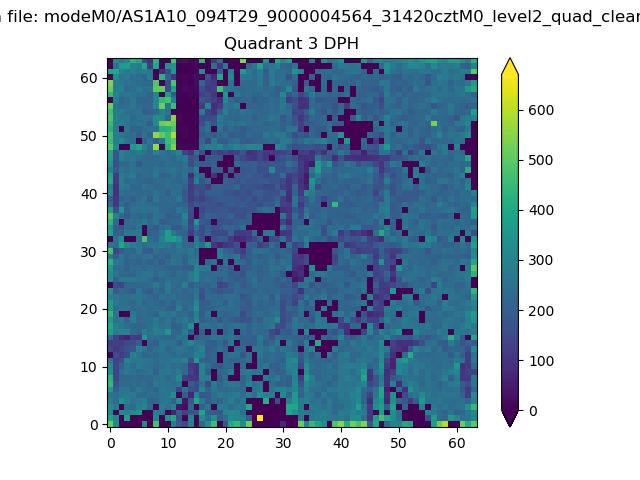 |
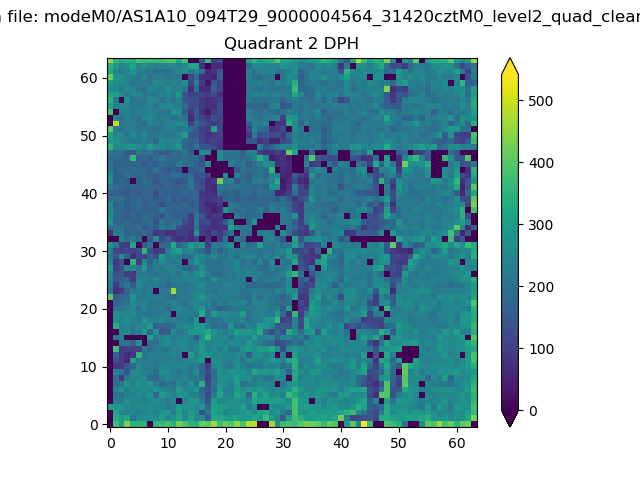 |
Quadrant C |
| Plot type | Count rate plots | Images |
|---|---|---|
| Comparison with Poisson distribution Blue bars denote a histogram of data divided into 1 sec bins. Red curve is a Poisson curve with rate = median count rate of data. |
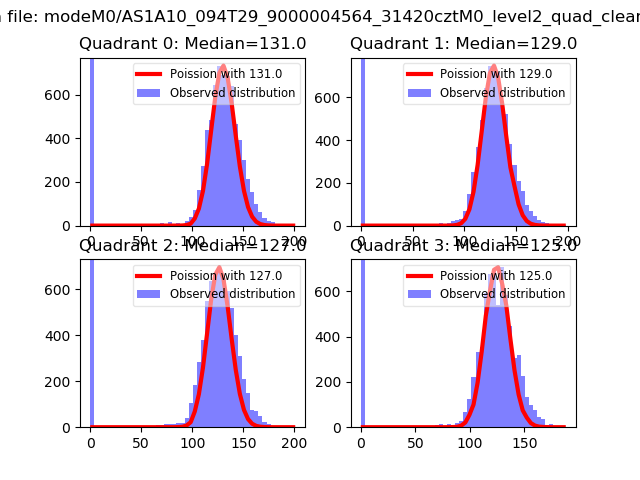 |
 |
| Quadrant-wise count rates Data is divided into 100 sec bins |
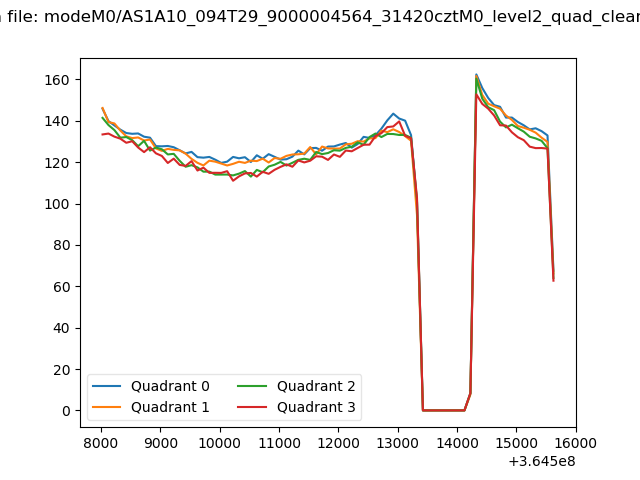 |
|
| Module-wise count rates for Quadrant A Data is divided into 100 sec bins |
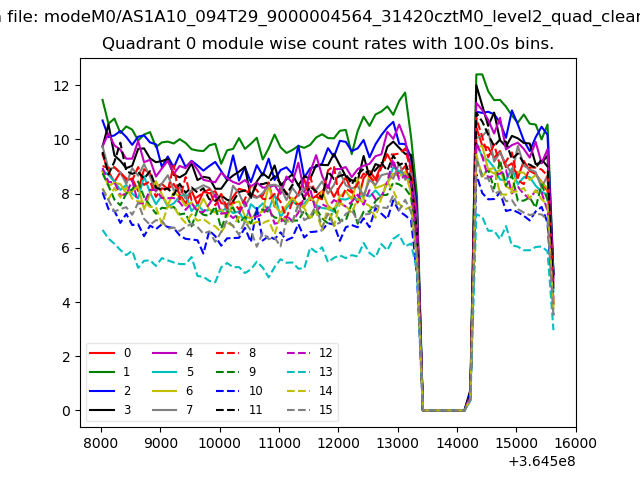 |
 |
| Module-wise count rates for Quadrant B Data is divided into 100 sec bins |
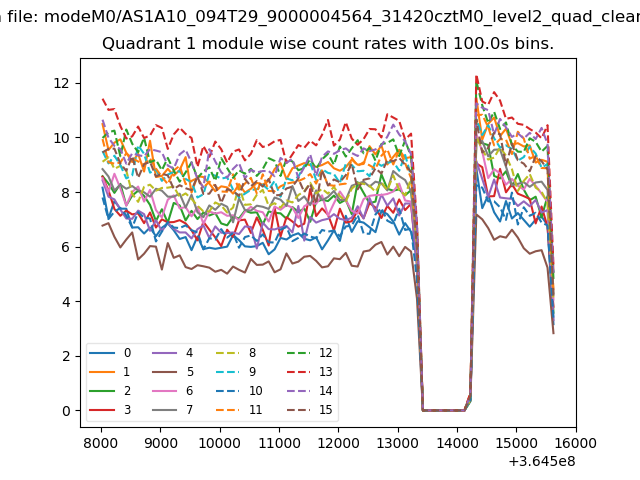 |
 |
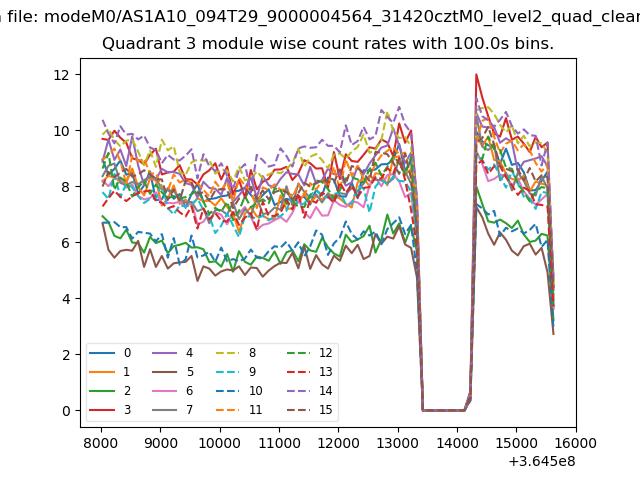
| Module-wise count rates for Quadrant C Data is divided into 100 sec bins |
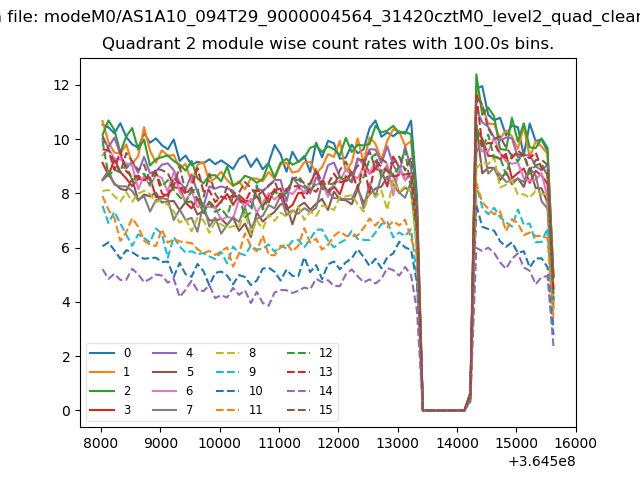 |
 |
| Module-wise count rates for Quadrant D Data is divided into 100 sec bins |
 |
 |
| Parameter | Plot |
|---|---|
| CZT HV Monitor | 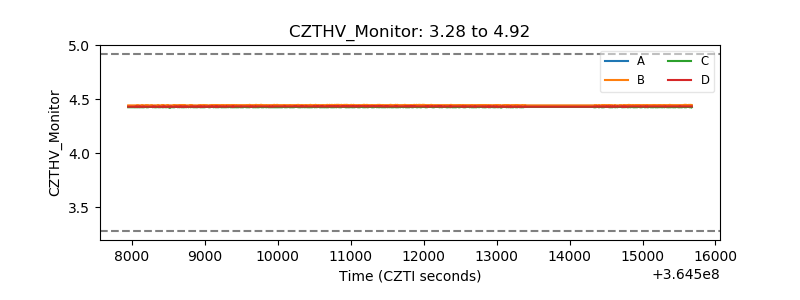 |
| D_VDD | 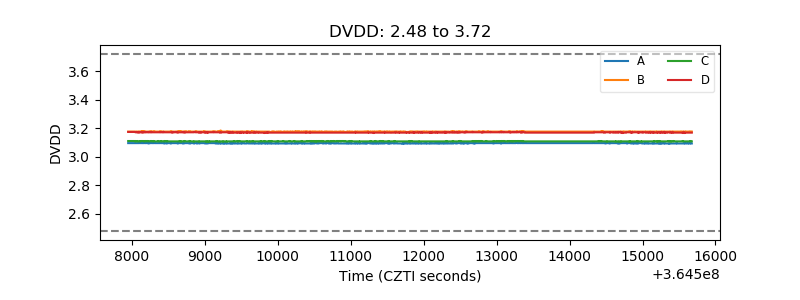 |
| Temperature 1 | 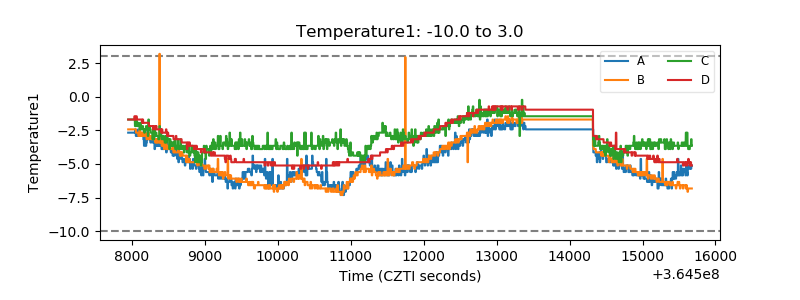 |
| Veto HV Monitor | 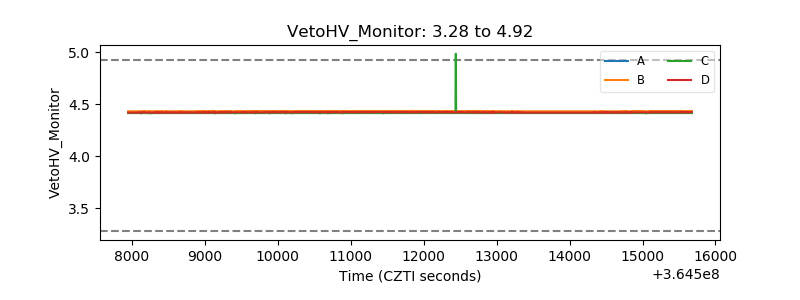 |
| Veto LLD |  |
| Alpha Counter | 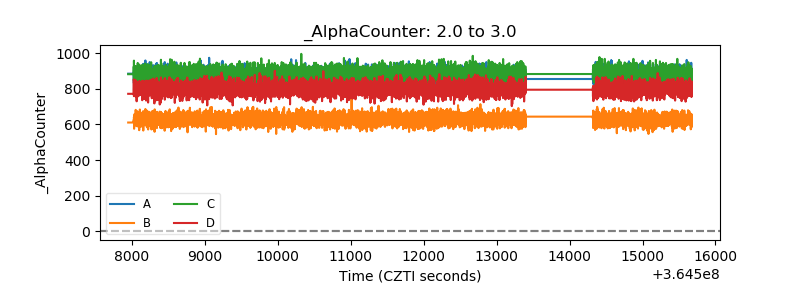 |
| _CPM_Rate | 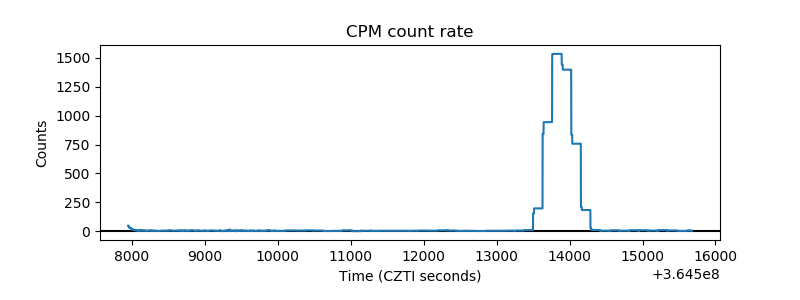 |
| CZT Counter | 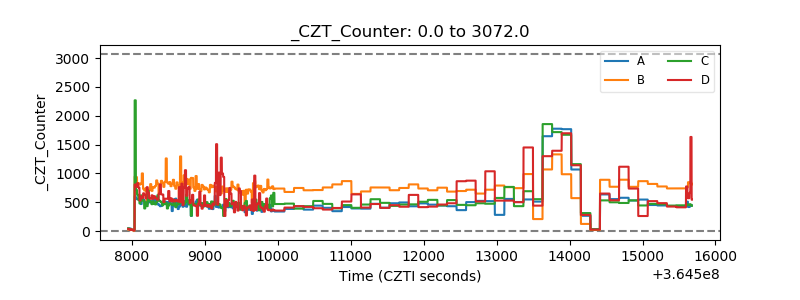 |
| +2.5 Volts monitor |  |
| +5 Volts monitor |  |
| _ROLL_ROT | 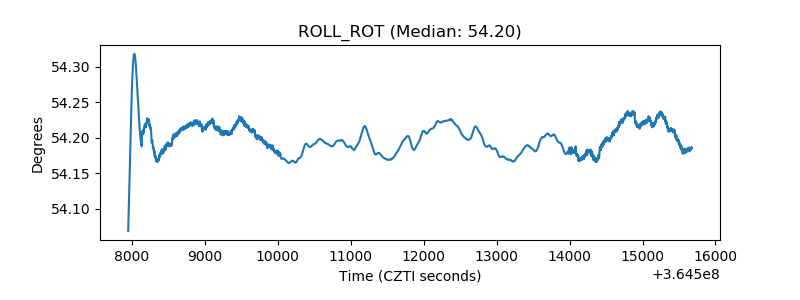 |
| _Roll_DEC | 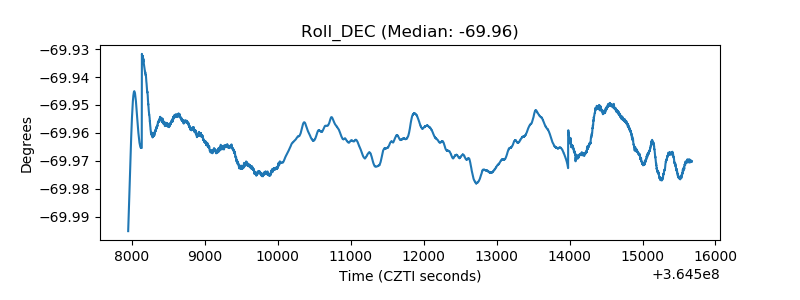 |
| _Roll_RA | 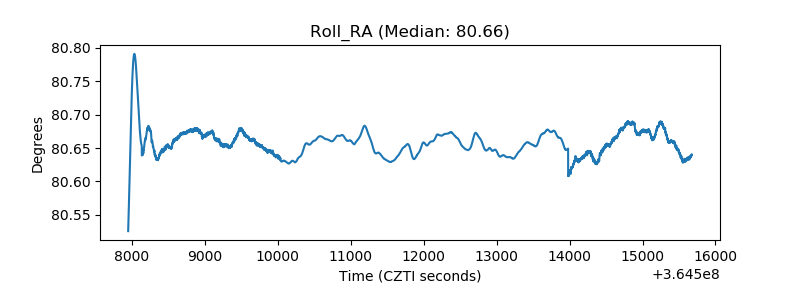 |
| Veto Counter | 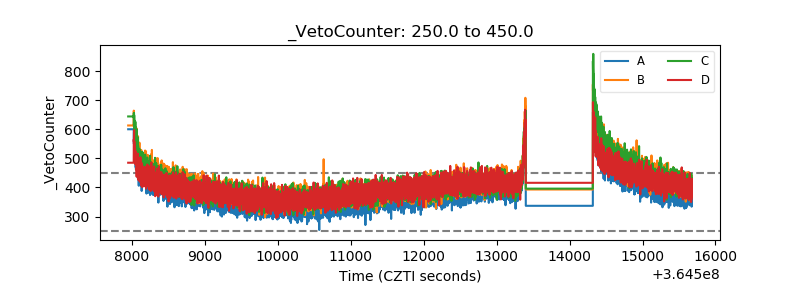 |