| Param | Original file | Final file |
|---|---|---|
| Filename | modeM0/AS1A10_094T30_9000004566cztM0_level2.fits | modeM0/AS1A10_094T30_9000004566cztM0_level2_quad_clean.evt |
| Size (bytes) | 332,570,880 | 280,681,920 |
| Size | 317.2 MB | 267.7 MB |
| Events in quadrant A | 2,194,360 | 1,713,749 |
| Events in quadrant B | 1,602,024 | 1,361,597 |
| Events in quadrant C | 2,153,664 | 1,671,053 |
| Events in quadrant D | 1,893,454 | 1,527,544 |
| Mode M9 | |||
|---|---|---|---|
| Quadrant | BADHDUFLAG | Total packets | Discarded packets |
| A | 0 | 76 | 0 |
| B | 0 | 76 | 0 |
| C | 0 | 76 | 0 |
| D | 0 | 76 | 0 |
| Mode M0 | |||
|---|---|---|---|
| Quadrant | BADHDUFLAG | Total packets | Discarded packets |
| A | 0 | 67295 | 0 |
| B | 0 | 139117 | 0 |
| C | 0 | 70350 | 0 |
| D | 0 | 88285 | 0 |
| Mode SS | |||
|---|---|---|---|
| Quadrant | BADHDUFLAG | Total packets | Discarded packets |
| A | 0 | 660 | 0 |
| B | 0 | 660 | 0 |
| C | 0 | 660 | 0 |
| D | 0 | 660 | 0 |
| Quadrant | Total seconds | Saturated seconds | Saturation percentage |
|---|---|---|---|
| A | 32373 | 134 | 0.413925% |
| B | 32373 | 9491 | 29.317641% |
| C | 32373 | 707 | 2.183919% |
| D | 32373 | 666 | 2.057270% |
Noise dominated data is calculated using 1-second bins in cleaned event files. If a bin has >2000 counts, and if more than 50% of those come from <1% of pixels, then it is considered to be noise-dominated and hence unusable.
| Quadrant | # 1 sec bins | Bins with >0 counts | Bins with >2000 counts | High rate bins dominated by noise | Noise dominated (total time) | Noise dominated (detector-on time) | Marked lightcurve |
|---|---|---|---|---|---|---|---|
| A | 39924 | 32372 | 0 | 0 | 0.00% | 0.00% |  |
| B | 39924 | 30628 | 0 | 0 | 0.00% | 0.00% |  |
| C | 39924 | 32368 | 0 | 0 | 0.00% | 0.00% |  |
| D | 39924 | 32360 | 0 | 0 | 0.00% | 0.00% | 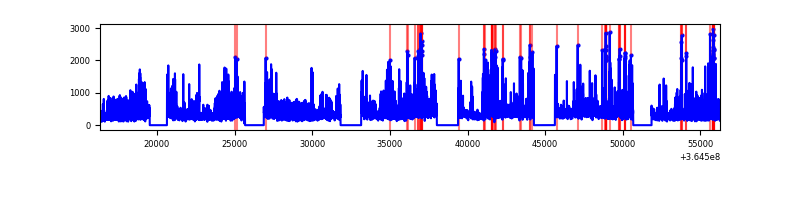 |
Top three noisy pixels from each quadrant. If the there are fewer than three noisy pixels in the level2.evt file, extra rows are filled as -1
| Pixel properties | Quadrant properties | ||||||
|---|---|---|---|---|---|---|---|
| Quadrant | DetID | PixID | Counts | Sigma | Mean | Median | Sigma |
| A | 0 | 29 | 2061 | 11.03 | 572 | 544 | 137.5 |
| A | 7 | 110 | 1696 | 8.38 | 572 | 544 | 137.5 |
| A | 9 | 19 | 1636 | 7.94 | 572 | 544 | 137.5 |
| B | 2 | 9 | 1272 | 10.1 | 425 | 408 | 85.5 |
| B | 3 | 80 | 1154 | 8.72 | 425 | 408 | 85.5 |
| B | 5 | 128 | 1066 | 7.69 | 425 | 408 | 85.5 |
| C | 1 | 81 | 1701 | 8.08 | 570 | 541 | 143.5 |
| C | 1 | 80 | 1664 | 7.82 | 570 | 541 | 143.5 |
| C | 3 | 126 | 1472 | 6.48 | 570 | 541 | 143.5 |
| D | 10 | 189 | 1449 | 6.65 | 541 | 499 | 142.9 |
| D | 15 | 47 | 1395 | 6.27 | 541 | 499 | 142.9 |
| D | 7 | 3 | 1362 | 6.04 | 541 | 499 | 142.9 |
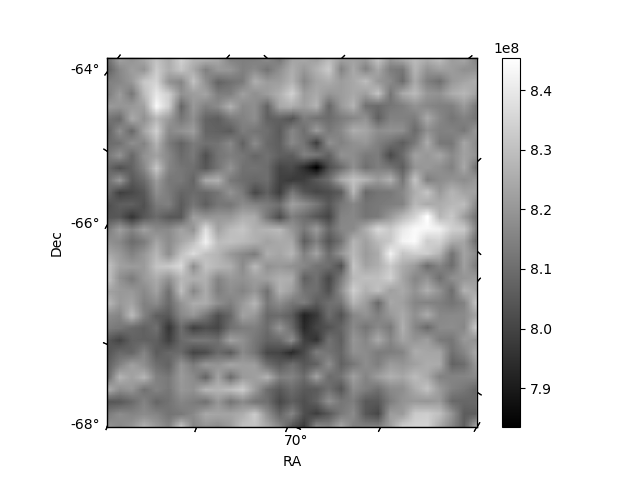
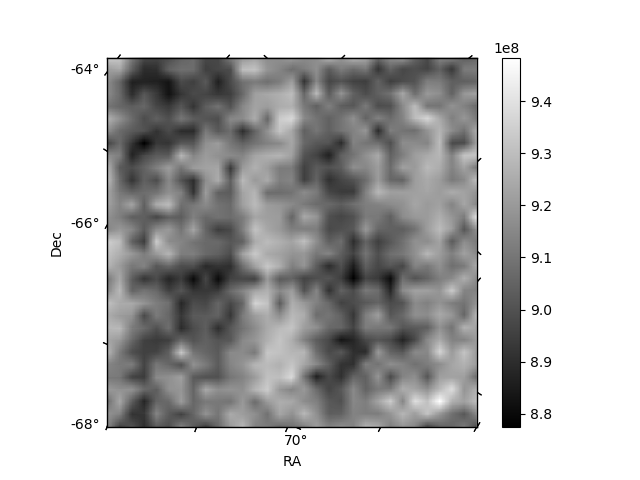
Histogram calculated using DETX and DETY for each event in the final _common_clean file
| Quadrant A | 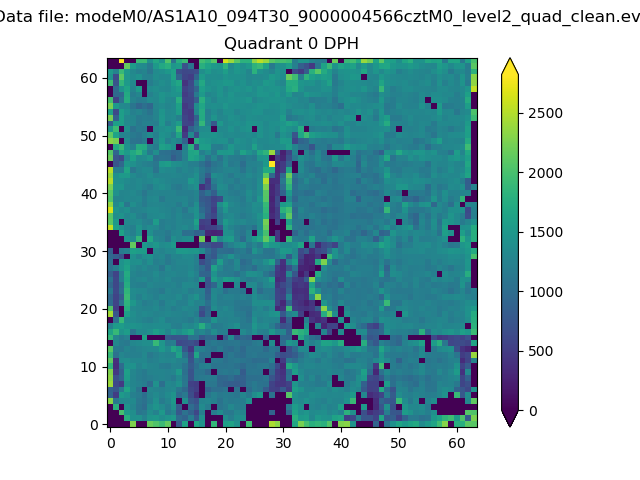 |
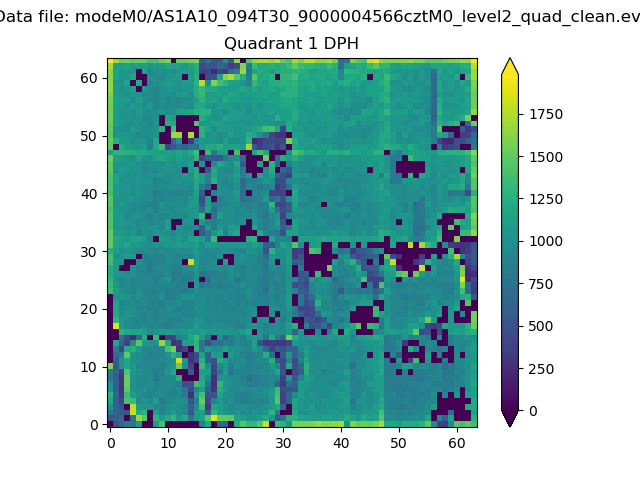 |
Quadrant B |
|---|---|---|---|
| Quadrant D | 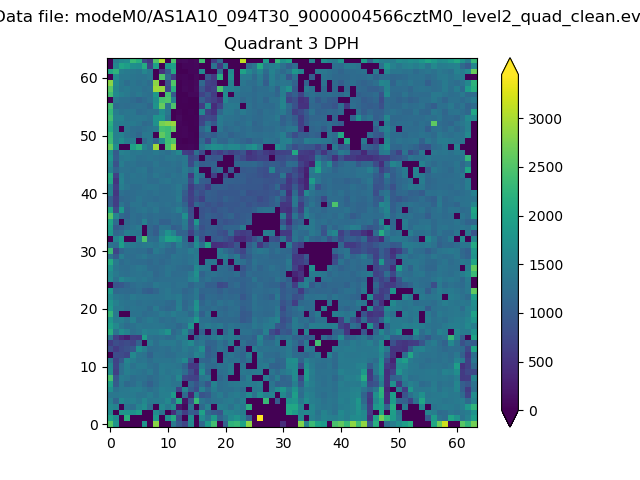 |
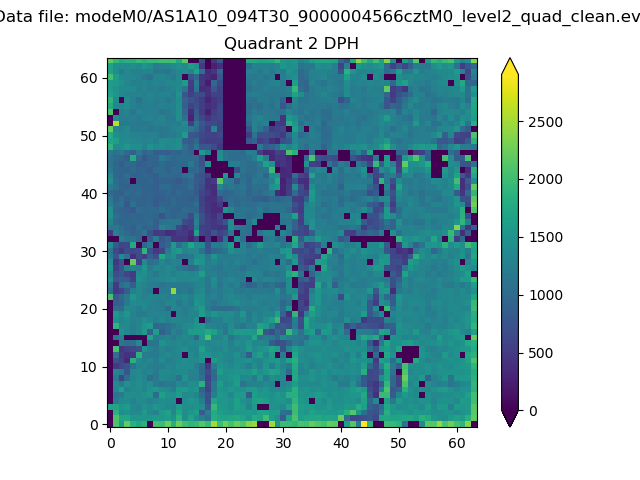 |
Quadrant C |
| Plot type | Count rate plots | Images |
|---|---|---|
| Comparison with Poisson distribution Blue bars denote a histogram of data divided into 1 sec bins. Red curve is a Poisson curve with rate = median count rate of data. |
 |
 |
| Quadrant-wise count rates Data is divided into 100 sec bins |
 |
|
| Module-wise count rates for Quadrant A Data is divided into 100 sec bins |
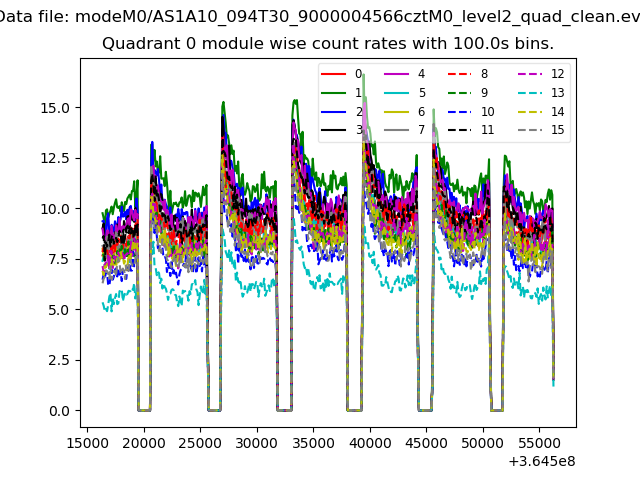 |
 |
| Module-wise count rates for Quadrant B Data is divided into 100 sec bins |
 |
 |
| Module-wise count rates for Quadrant C Data is divided into 100 sec bins |
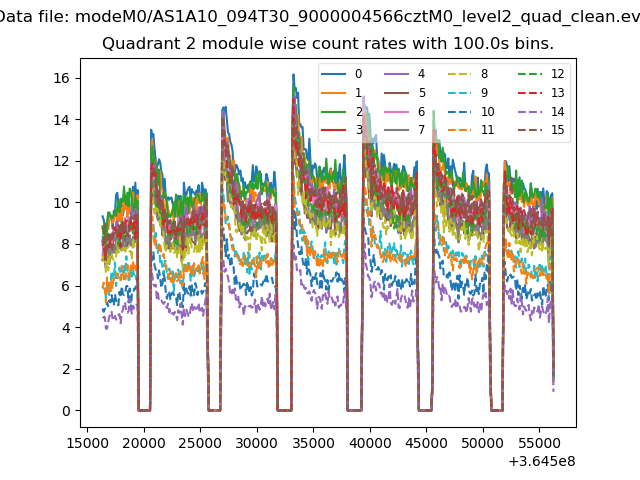 |
 |
| Module-wise count rates for Quadrant D Data is divided into 100 sec bins |
 |
 |
| Parameter | Plot |
|---|---|
| CZT HV Monitor |  |
| D_VDD | 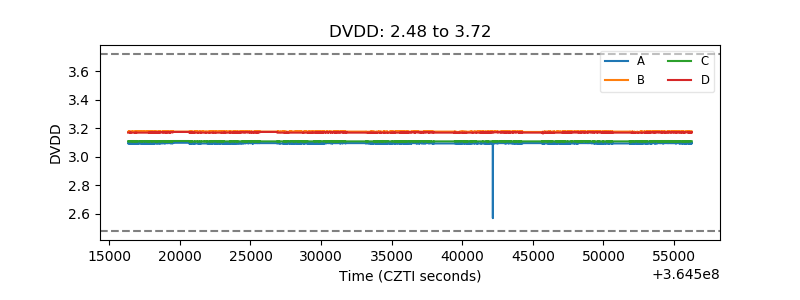 |
| Temperature 1 |  |
| Veto HV Monitor |  |
| Veto LLD | 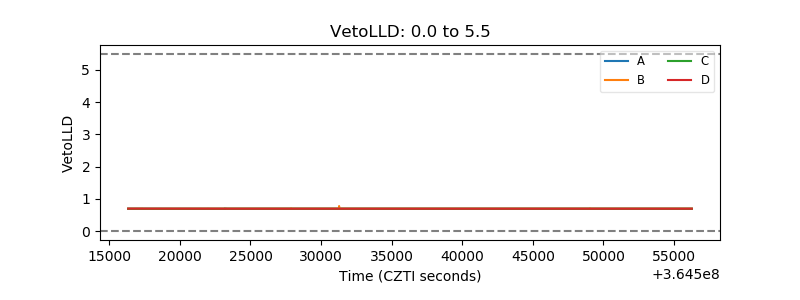 |
| Alpha Counter | 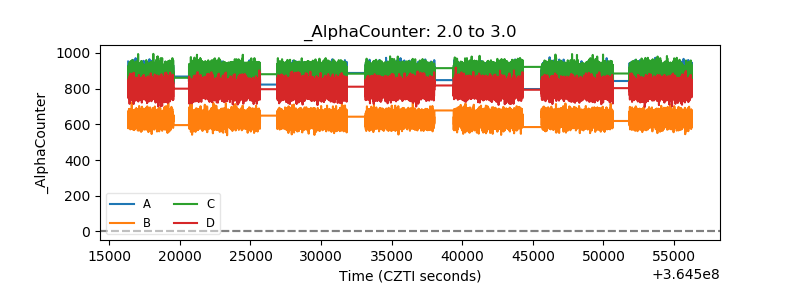 |
| _CPM_Rate | 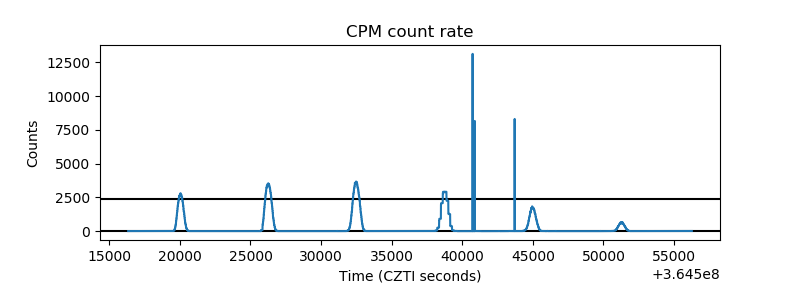 |
| CZT Counter |  |
| +2.5 Volts monitor |  |
| +5 Volts monitor |  |
| _ROLL_ROT | 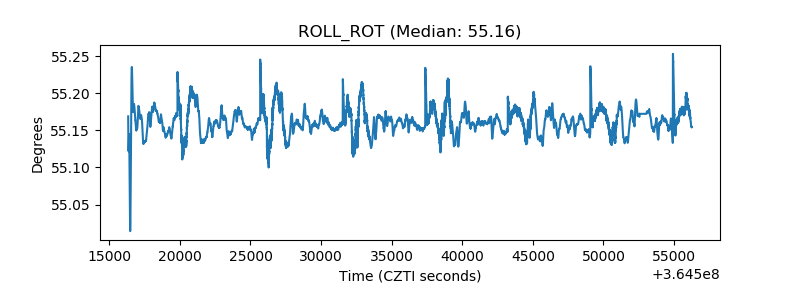 |
| _Roll_DEC | 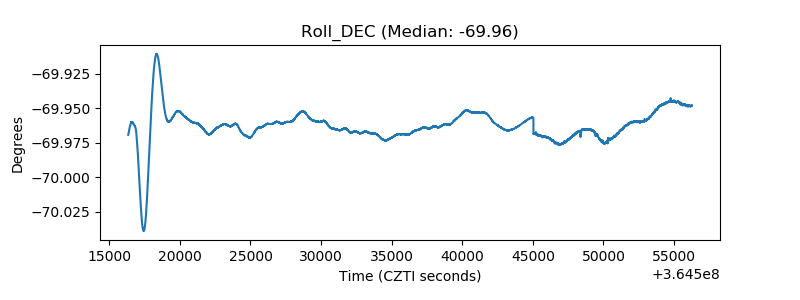 |
| _Roll_RA |  |
| Veto Counter |  |