| Param | Original file | Final file |
|---|---|---|
| Filename | modeM0/AS1A10_094T30_9000004566_31423cztM0_level2.evt | modeM0/AS1A10_094T30_9000004566_31423cztM0_level2_quad_clean.evt |
| Size (bytes) | 542,355,840 | 137,298,240 |
| Size | 517.2 MB | 130.9 MB |
| Events in quadrant A | 3,156,817 | 943,005 |
| Events in quadrant B | 5,137,187 | 943,848 |
| Events in quadrant C | 3,468,813 | 923,696 |
| Events in quadrant D | 4,230,392 | 902,808 |
| Mode M9 | |||
|---|---|---|---|
| Quadrant | BADHDUFLAG | Total packets | Discarded packets |
| A | 0 | 21 | 0 |
| B | 0 | 22 | 0 |
| C | 0 | 22 | 0 |
| D | 0 | 22 | 0 |
| Mode M0 | |||
|---|---|---|---|
| Quadrant | BADHDUFLAG | Total packets | Discarded packets |
| A | 0 | 13394 | 2 |
| B | 0 | 19751 | 2 |
| C | 0 | 14295 | 2 |
| D | 0 | 16865 | 4 |
| Mode SS | |||
|---|---|---|---|
| Quadrant | BADHDUFLAG | Total packets | Discarded packets |
| A | 0 | 130 | 0 |
| B | 0 | 130 | 0 |
| C | 0 | 130 | 0 |
| D | 0 | 130 | 0 |
| Quadrant | Total seconds | Saturated seconds | Saturation percentage |
|---|---|---|---|
| A | 6382 | 15 | 0.235036% |
| B | 6382 | 93 | 1.457223% |
| C | 6382 | 139 | 2.178001% |
| D | 6381 | 69 | 1.081335% |
Noise dominated data is calculated using 1-second bins in cleaned event files. If a bin has >2000 counts, and if more than 50% of those come from <1% of pixels, then it is considered to be noise-dominated and hence unusable.
| Quadrant | # 1 sec bins | Bins with >0 counts | Bins with >2000 counts | High rate bins dominated by noise | Noise dominated (total time) | Noise dominated (detector-on time) | Marked lightcurve |
|---|---|---|---|---|---|---|---|
| A | 7588 | 6383 | 0 | 0 | 0.00% | 0.00% | 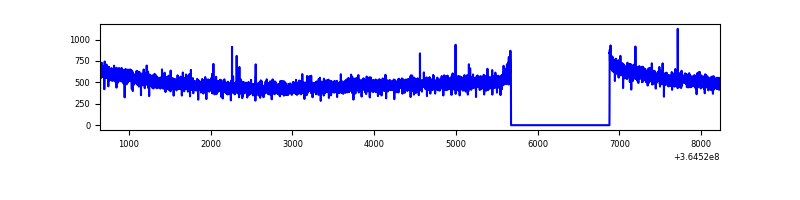 |
| B | 7588 | 6383 | 2 | 2 | 0.03% | 0.03% | 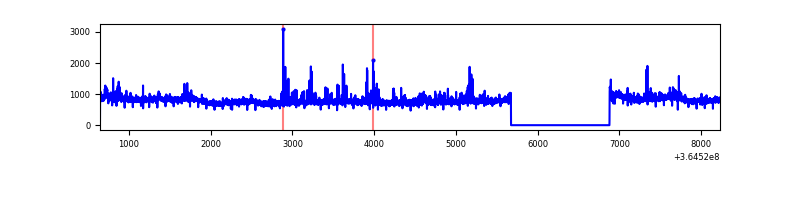 |
| C | 7588 | 6383 | 17 | 17 | 0.22% | 0.27% | 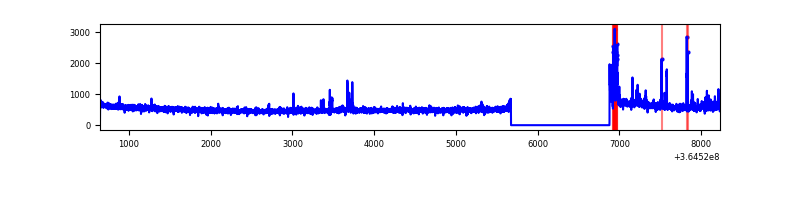 |
| D | 7587 | 6382 | 47 | 47 | 0.62% | 0.74% | 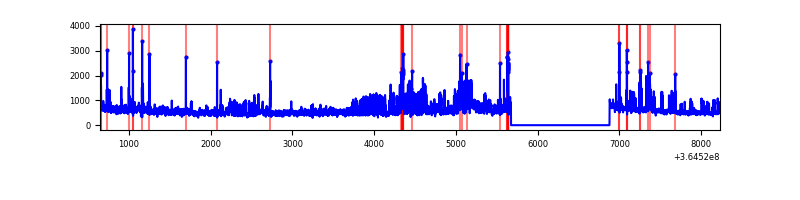 |
Top three noisy pixels from each quadrant. If the there are fewer than three noisy pixels in the level2.evt file, extra rows are filled as -1
| Pixel properties | Quadrant properties | ||||||
|---|---|---|---|---|---|---|---|
| Quadrant | DetID | PixID | Counts | Sigma | Mean | Median | Sigma |
| A | 13 | 254 | 11292 | 64.94 | 818 | 805 | 161.5 |
| A | 3 | 137 | 7819 | 43.43 | 818 | 805 | 161.5 |
| A | 0 | 226 | 6782 | 37.01 | 818 | 805 | 161.5 |
| B | 6 | 159 | 1751660 | 11563.03 | 810 | 789 | 151.4 |
| B | 4 | 80 | 170608 | 1121.51 | 810 | 789 | 151.4 |
| B | 0 | 190 | 30939 | 199.11 | 810 | 789 | 151.4 |
| C | 10 | 22 | 186191 | 1011.18 | 797 | 804 | 183.3 |
| C | 14 | 238 | 137615 | 746.23 | 797 | 804 | 183.3 |
| C | 3 | 233 | 16476 | 85.48 | 797 | 804 | 183.3 |
| D | 8 | 195 | 803701 | 4233.29 | 799 | 777 | 189.7 |
| D | 12 | 218 | 139784 | 732.89 | 799 | 777 | 189.7 |
| D | 1 | 52 | 75560 | 394.28 | 799 | 777 | 189.7 |
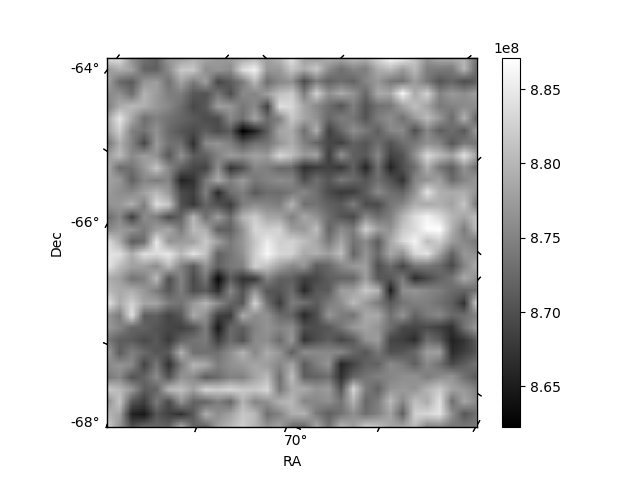
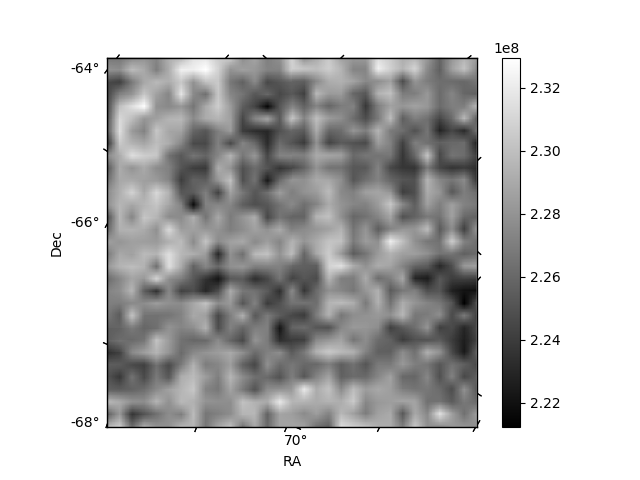
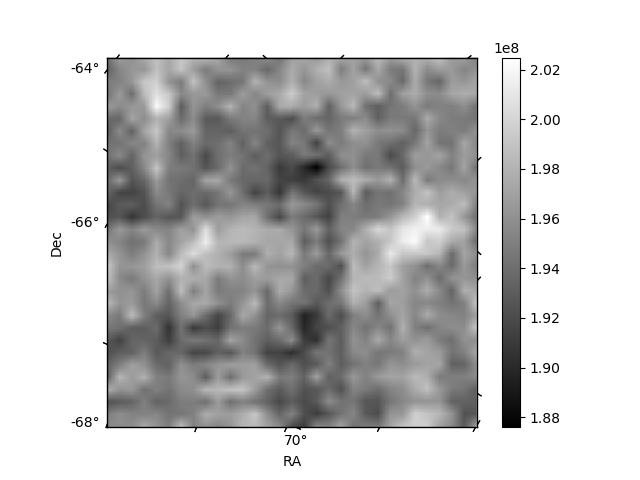
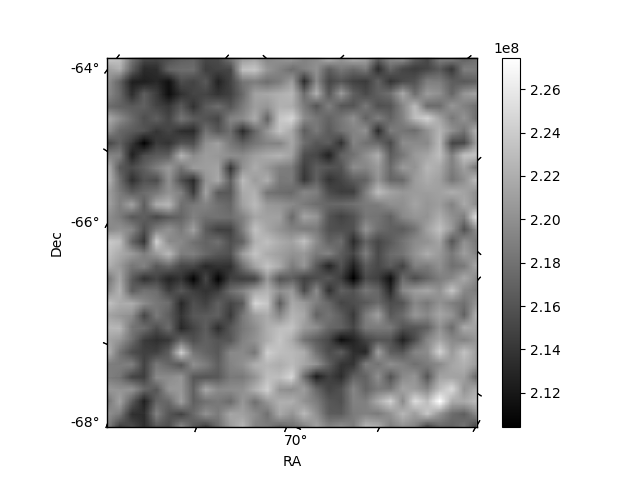
Histogram calculated using DETX and DETY for each event in the final _common_clean file
| Quadrant A | 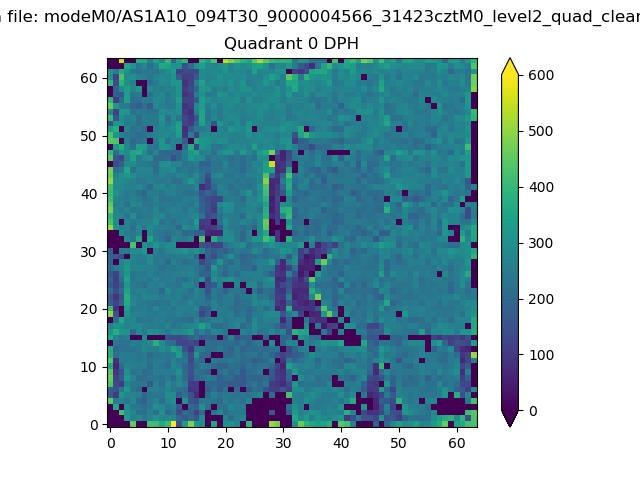 |
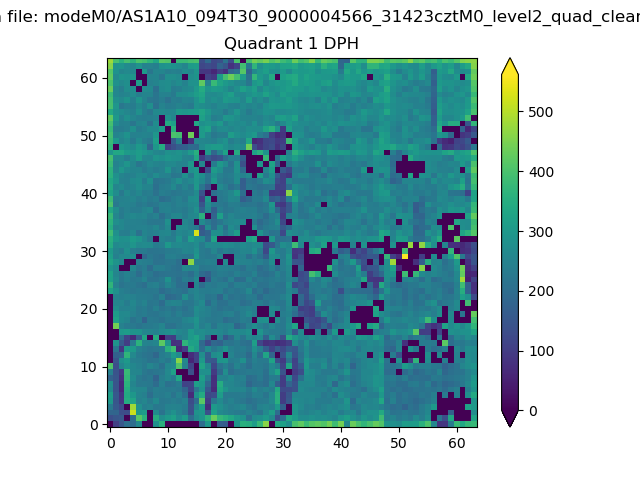 |
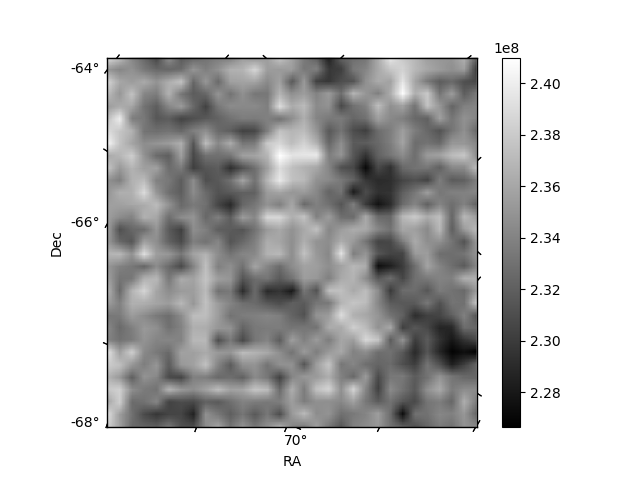
Quadrant B |
|---|---|---|---|
| Quadrant D | 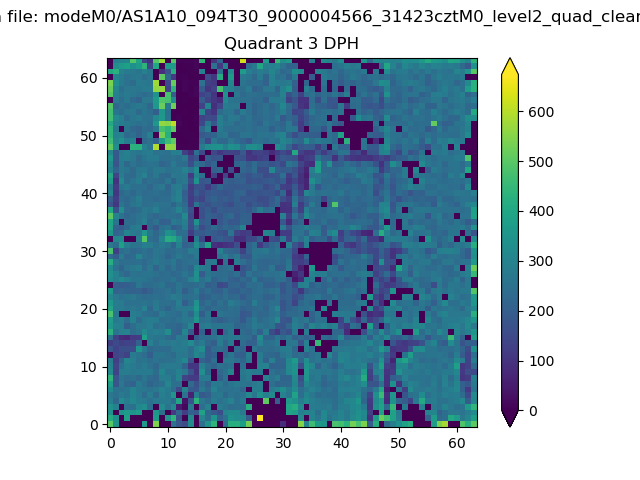 |
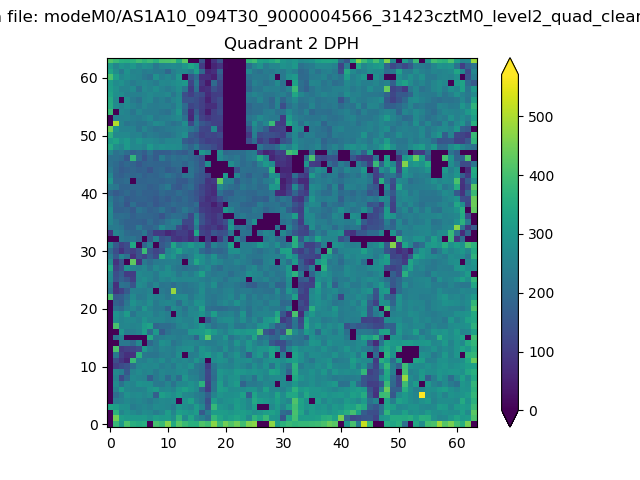 |
Quadrant C |
| Plot type | Count rate plots | Images |
|---|---|---|
| Comparison with Poisson distribution Blue bars denote a histogram of data divided into 1 sec bins. Red curve is a Poisson curve with rate = median count rate of data. |
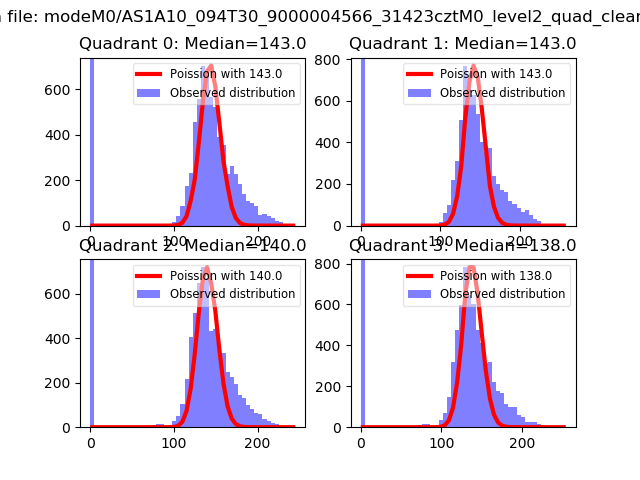 |
 |
| Quadrant-wise count rates Data is divided into 100 sec bins |
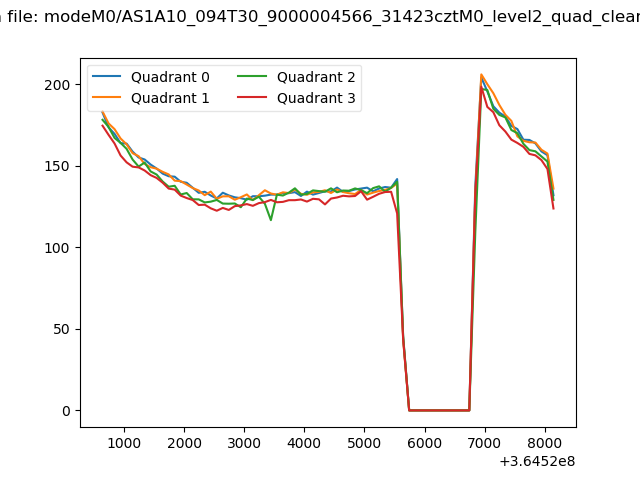 |
|
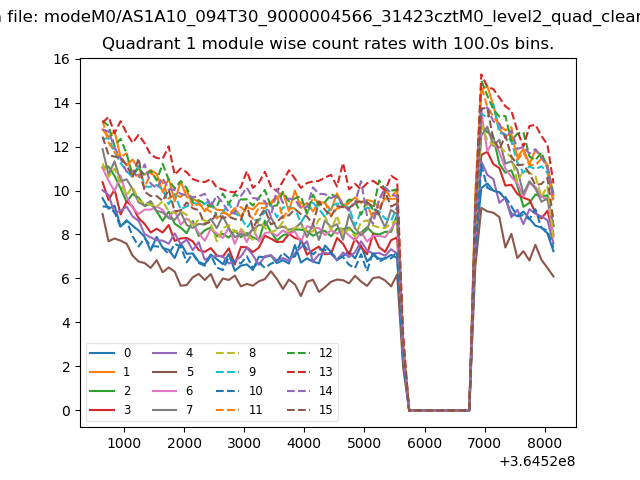
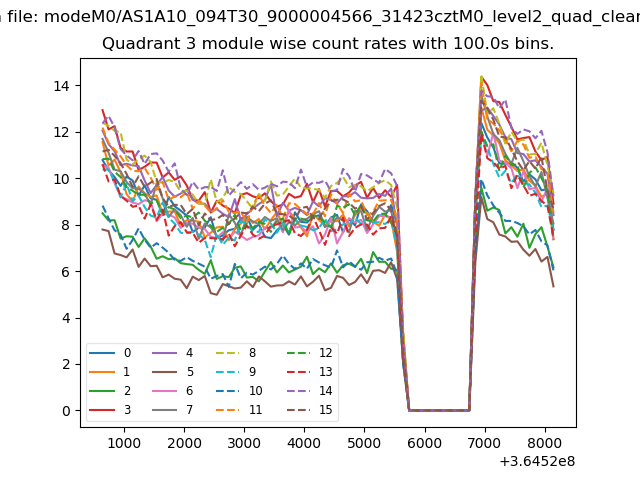
| Module-wise count rates for Quadrant A Data is divided into 100 sec bins |
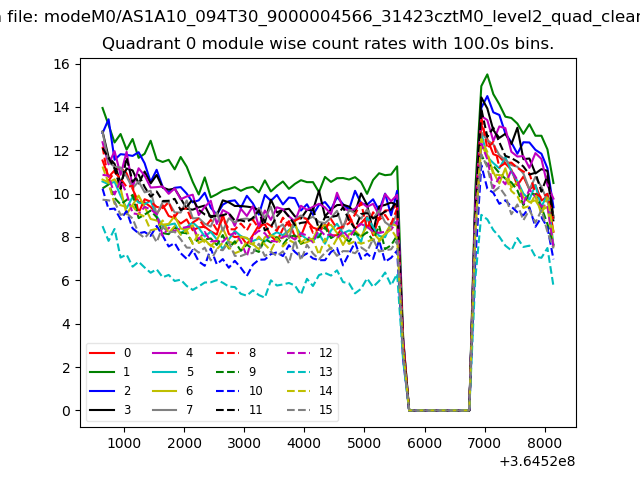 |
 |
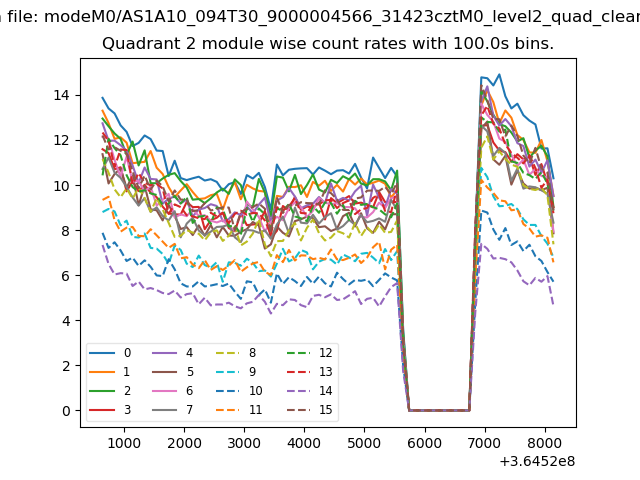
| Module-wise count rates for Quadrant B Data is divided into 100 sec bins |
 |
 |
| Module-wise count rates for Quadrant C Data is divided into 100 sec bins |
 |
 |
| Module-wise count rates for Quadrant D Data is divided into 100 sec bins |
 |
 |
| Parameter | Plot |
|---|---|
| CZT HV Monitor | 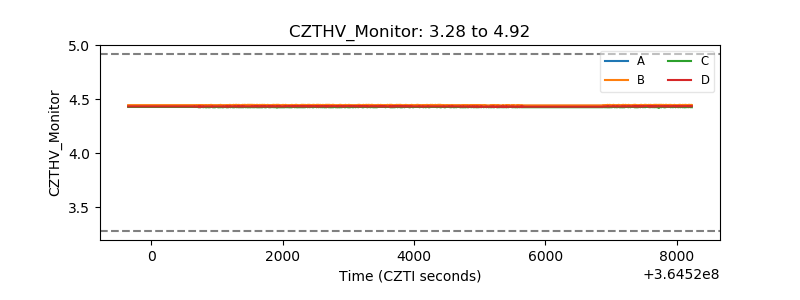 |
| D_VDD | 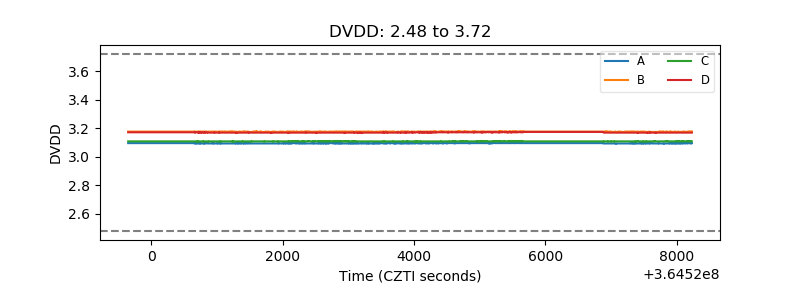 |
| Temperature 1 | 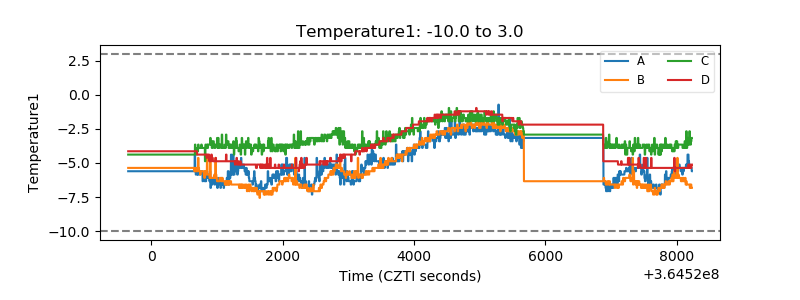 |
| Veto HV Monitor | 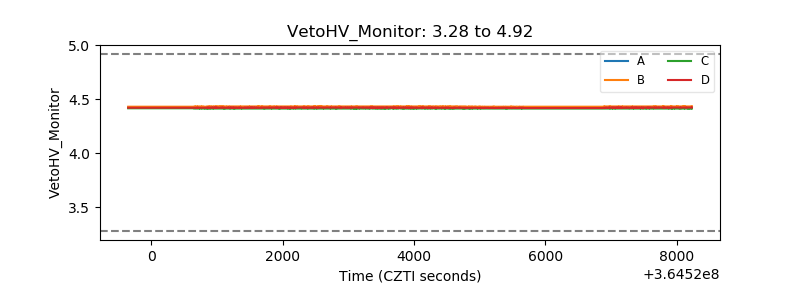 |
| Veto LLD | 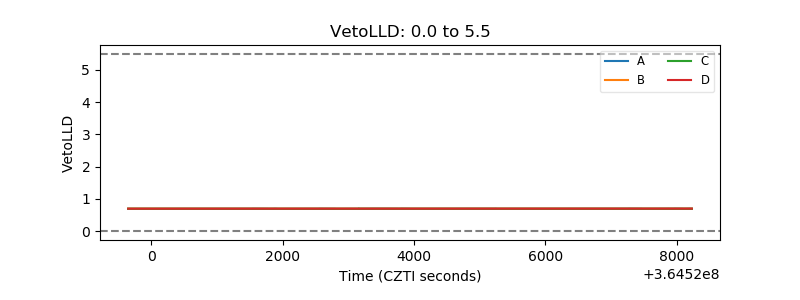 |
| Alpha Counter | 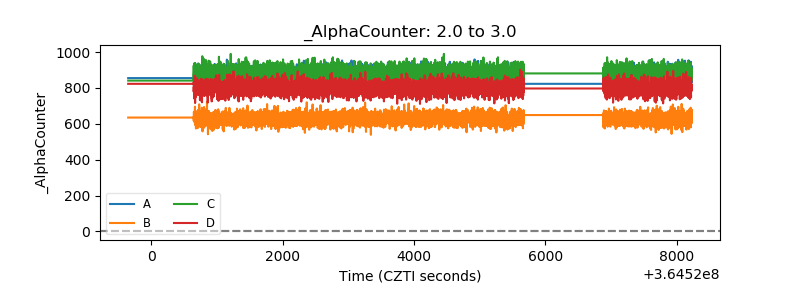 |
| _CPM_Rate | 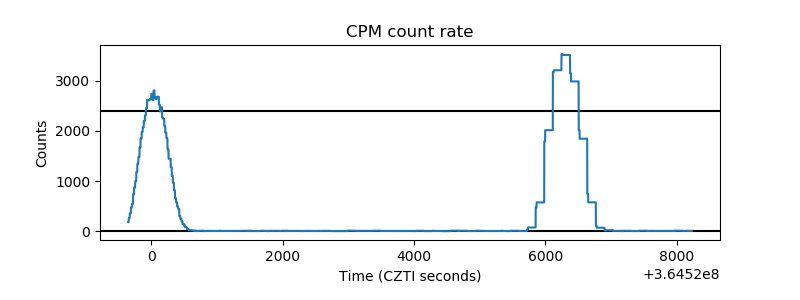 |
| CZT Counter | 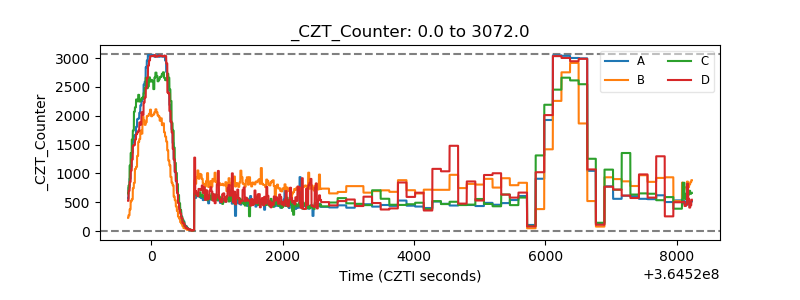 |
| +2.5 Volts monitor |  |
| +5 Volts monitor | 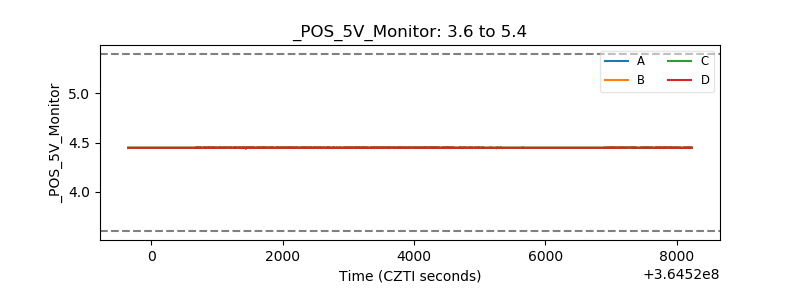 |
| _ROLL_ROT | 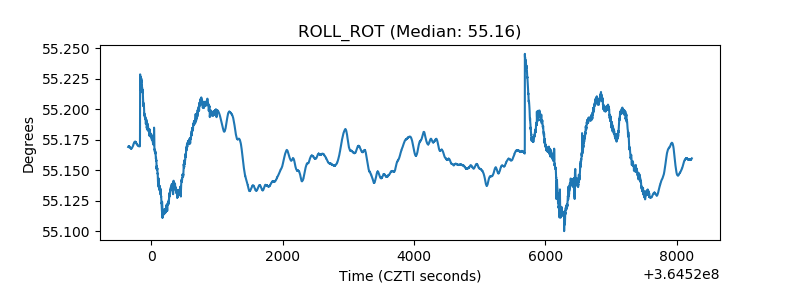 |
| _Roll_DEC | 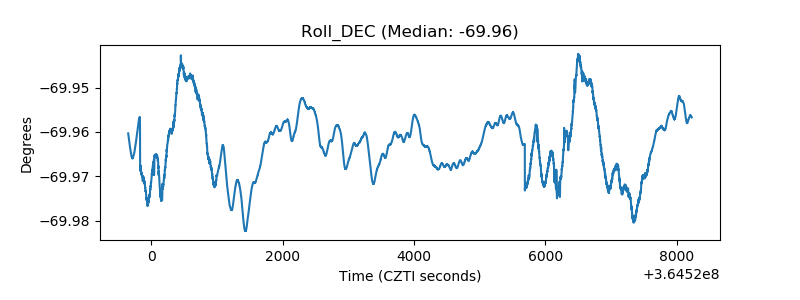 |
| _Roll_RA | 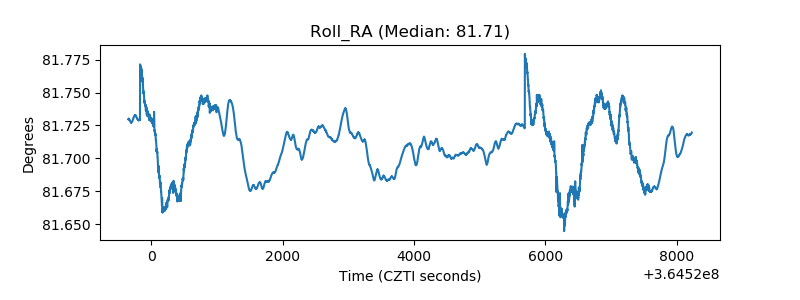 |
| Veto Counter | 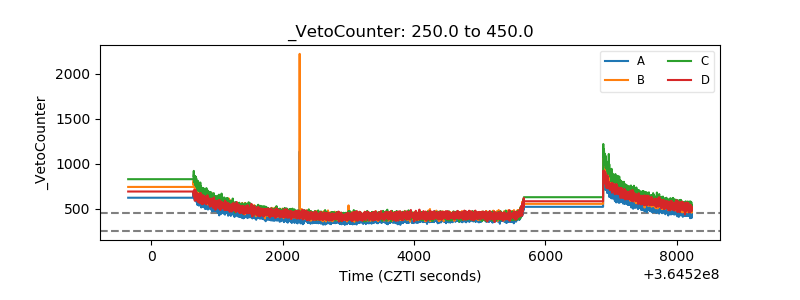 |