| Param | Original file | Final file |
|---|---|---|
| Filename | modeM0/AS1A10_094T30_9000004566_31424cztM0_level2.evt | modeM0/AS1A10_094T30_9000004566_31424cztM0_level2_quad_clean.evt |
| Size (bytes) | 594,564,480 | 138,833,280 |
| Size | 567.0 MB | 132.4 MB |
| Events in quadrant A | 3,208,786 | 982,251 |
| Events in quadrant B | 7,009,928 | 862,513 |
| Events in quadrant C | 3,600,852 | 972,240 |
| Events in quadrant D | 3,766,444 | 954,258 |
| Mode M9 | |||
|---|---|---|---|
| Quadrant | BADHDUFLAG | Total packets | Discarded packets |
| A | 0 | 18 | 0 |
| B | 0 | 19 | 0 |
| C | 0 | 19 | 0 |
| D | 0 | 19 | 0 |
| Mode M0 | |||
|---|---|---|---|
| Quadrant | BADHDUFLAG | Total packets | Discarded packets |
| A | 0 | 13363 | 2 |
| B | 0 | 25121 | 2 |
| C | 0 | 14586 | 2 |
| D | 0 | 15182 | 2 |
| Mode SS | |||
|---|---|---|---|
| Quadrant | BADHDUFLAG | Total packets | Discarded packets |
| A | 0 | 124 | 0 |
| B | 0 | 124 | 0 |
| C | 0 | 124 | 0 |
| D | 0 | 124 | 0 |
| Quadrant | Total seconds | Saturated seconds | Saturation percentage |
|---|---|---|---|
| A | 6217 | 9 | 0.144764% |
| B | 6217 | 1230 | 19.784462% |
| C | 6217 | 155 | 2.493164% |
| D | 6216 | 23 | 0.370013% |
Noise dominated data is calculated using 1-second bins in cleaned event files. If a bin has >2000 counts, and if more than 50% of those come from <1% of pixels, then it is considered to be noise-dominated and hence unusable.
| Quadrant | # 1 sec bins | Bins with >0 counts | Bins with >2000 counts | High rate bins dominated by noise | Noise dominated (total time) | Noise dominated (detector-on time) | Marked lightcurve |
|---|---|---|---|---|---|---|---|
| A | 7547 | 6218 | 0 | 0 | 0.00% | 0.00% | 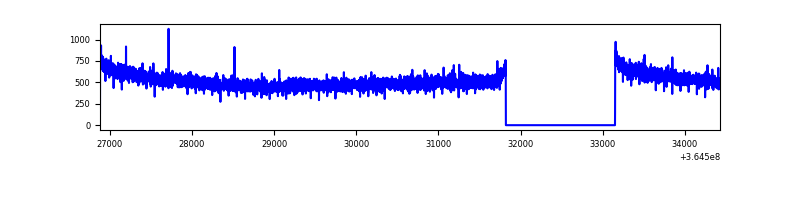 |
| B | 7546 | 6216 | 1025 | 1025 | 13.58% | 16.49% | 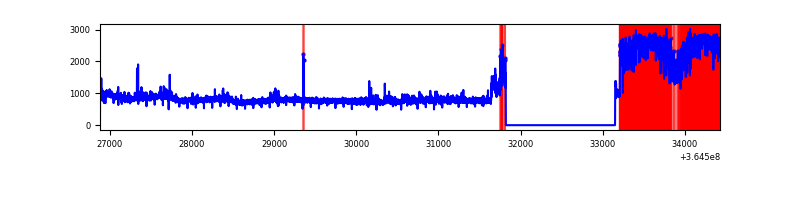 |
| C | 7547 | 6218 | 19 | 19 | 0.25% | 0.31% | 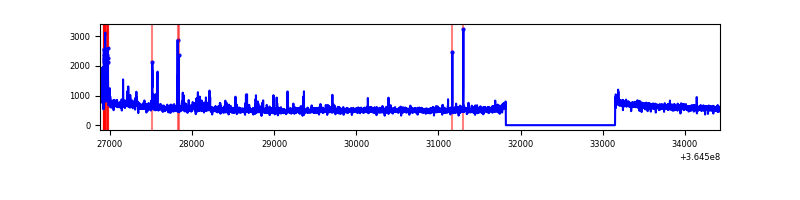 |
| D | 7546 | 6217 | 18 | 18 | 0.24% | 0.29% | 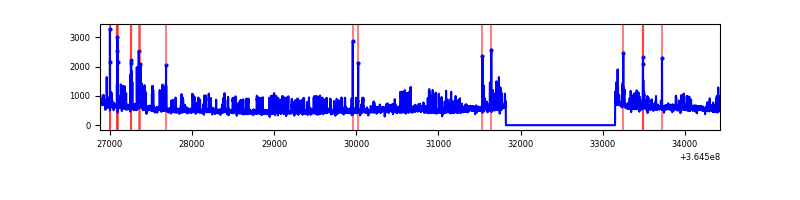 |
Top three noisy pixels from each quadrant. If the there are fewer than three noisy pixels in the level2.evt file, extra rows are filled as -1
| Pixel properties | Quadrant properties | ||||||
|---|---|---|---|---|---|---|---|
| Quadrant | DetID | PixID | Counts | Sigma | Mean | Median | Sigma |
| A | 13 | 254 | 11572 | 66.15 | 831 | 817 | 162.6 |
| A | 3 | 137 | 7475 | 40.95 | 831 | 817 | 162.6 |
| A | 0 | 226 | 6923 | 37.56 | 831 | 817 | 162.6 |
| B | 12 | 1 | 2451277 | 17845.03 | 739 | 722 | 137.3 |
| B | 6 | 159 | 1542140 | 11224.66 | 739 | 722 | 137.3 |
| B | 4 | 80 | 60768 | 437.26 | 739 | 722 | 137.3 |
| C | 10 | 22 | 168509 | 894.78 | 820 | 829 | 187.4 |
| C | 14 | 238 | 142641 | 756.75 | 820 | 829 | 187.4 |
| C | 3 | 233 | 51759 | 271.78 | 820 | 829 | 187.4 |
| D | 8 | 195 | 433655 | 2231.28 | 824 | 805 | 194.0 |
| D | 1 | 52 | 91017 | 465.03 | 824 | 805 | 194.0 |
| D | 12 | 218 | 51662 | 262.16 | 824 | 805 | 194.0 |
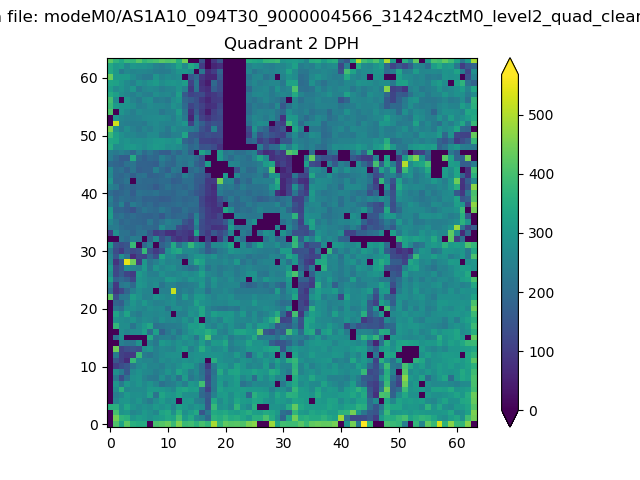
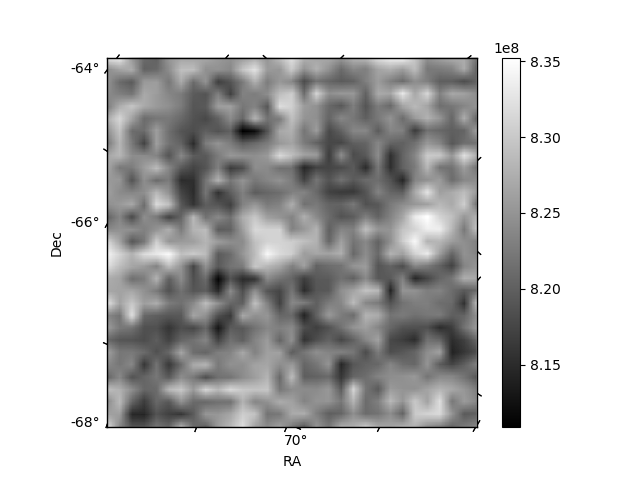
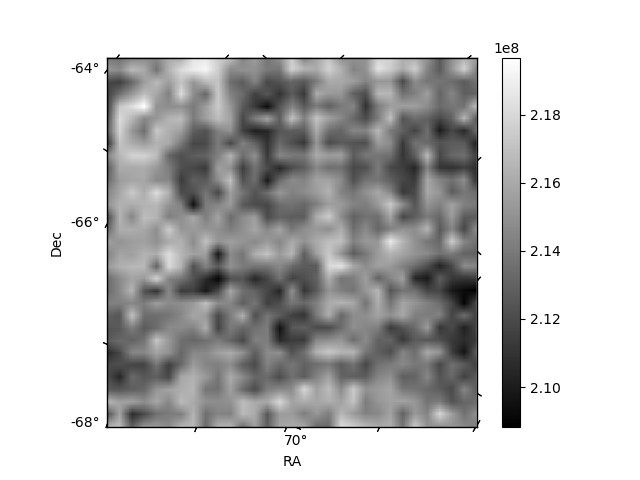
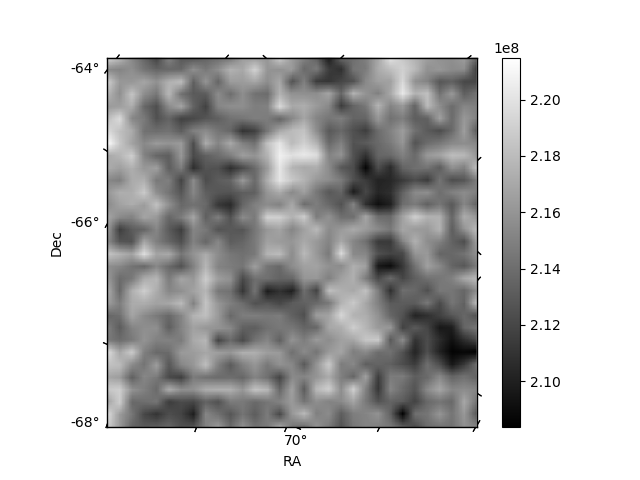
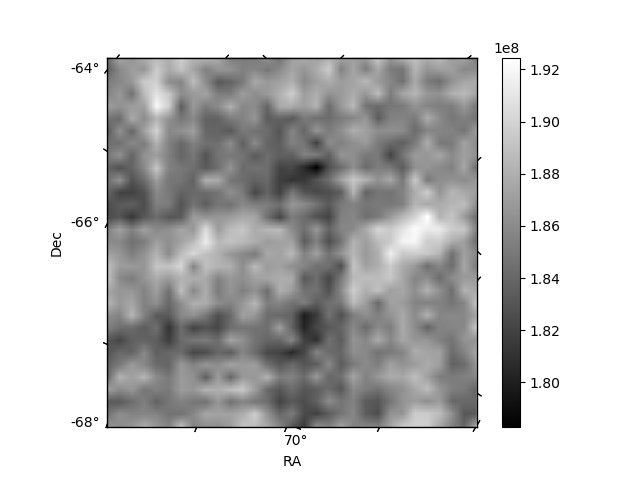
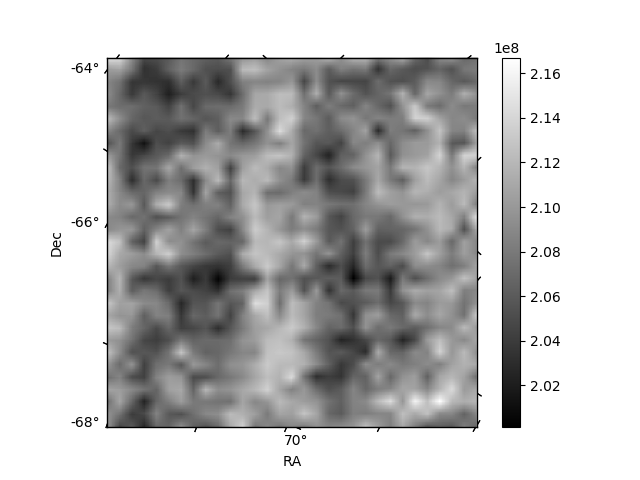
Histogram calculated using DETX and DETY for each event in the final _common_clean file
| Quadrant A | 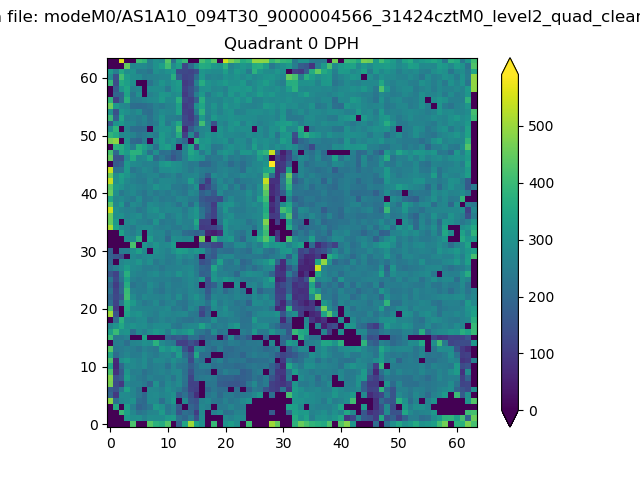 |
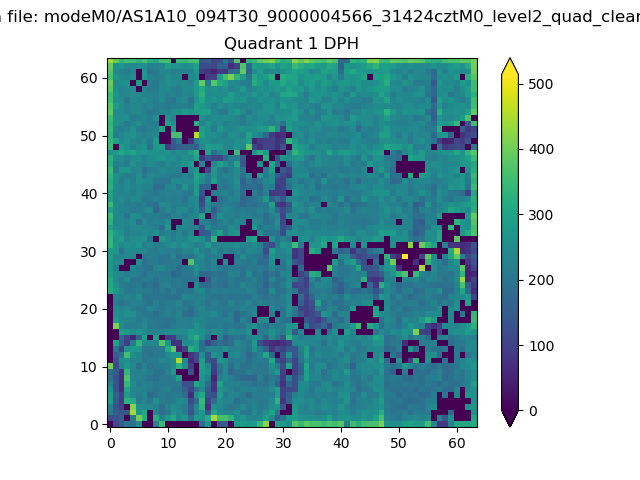 |
Quadrant B |
|---|---|---|---|
| Quadrant D | 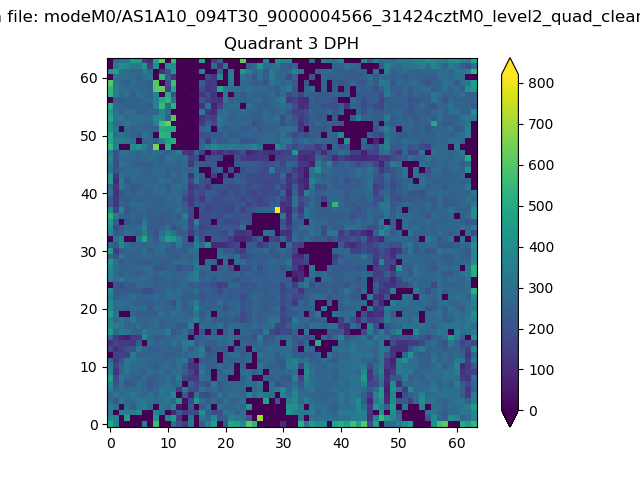 |
 |
Quadrant C |
| Plot type | Count rate plots | Images |
|---|---|---|
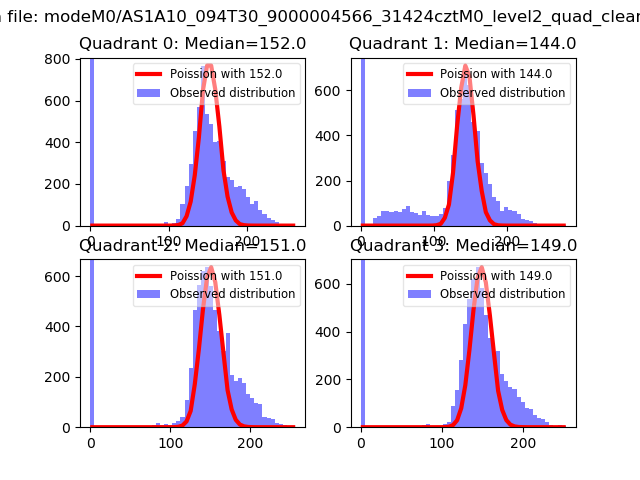
| Comparison with Poisson distribution Blue bars denote a histogram of data divided into 1 sec bins. Red curve is a Poisson curve with rate = median count rate of data. |
 |
 |
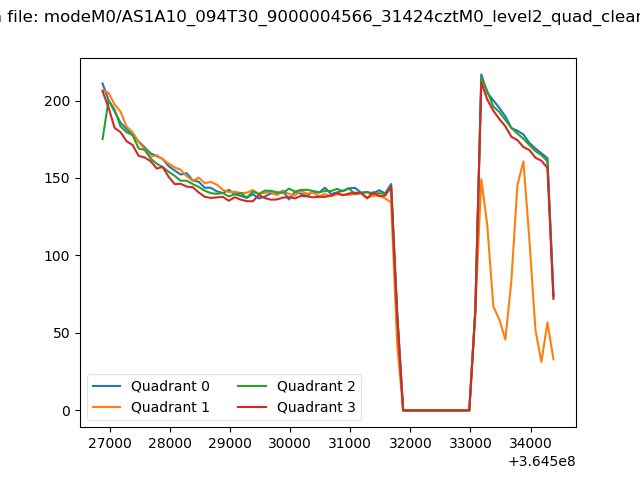
| Quadrant-wise count rates Data is divided into 100 sec bins |
 |
|
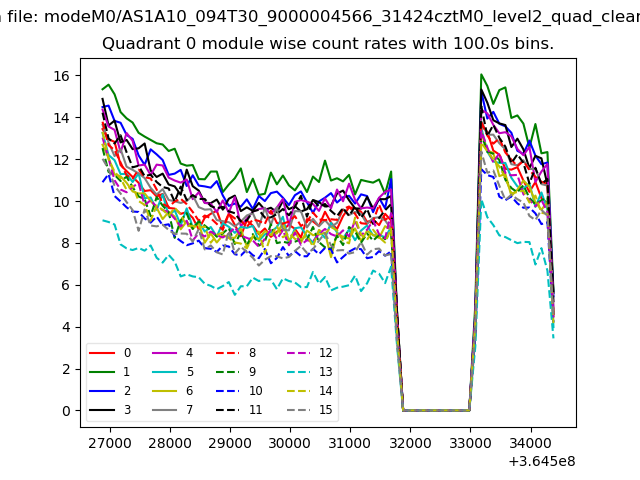
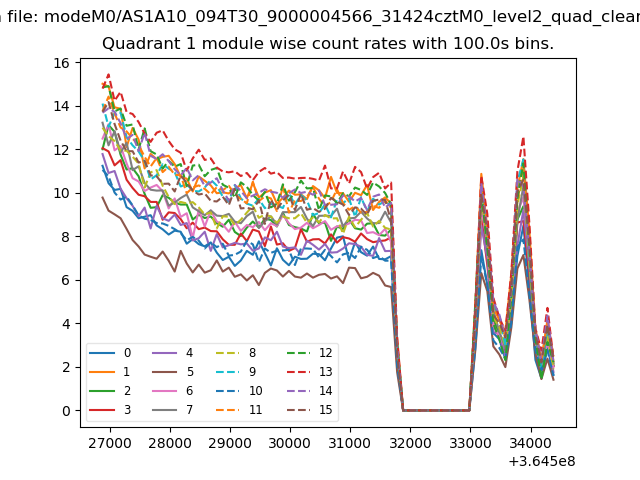
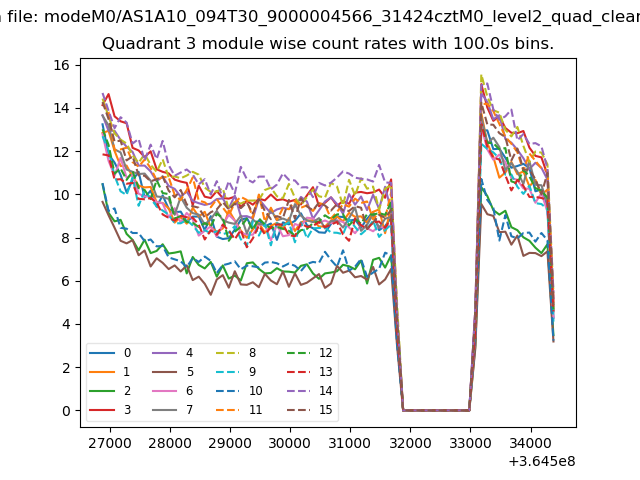
| Module-wise count rates for Quadrant A Data is divided into 100 sec bins |
 |
 |
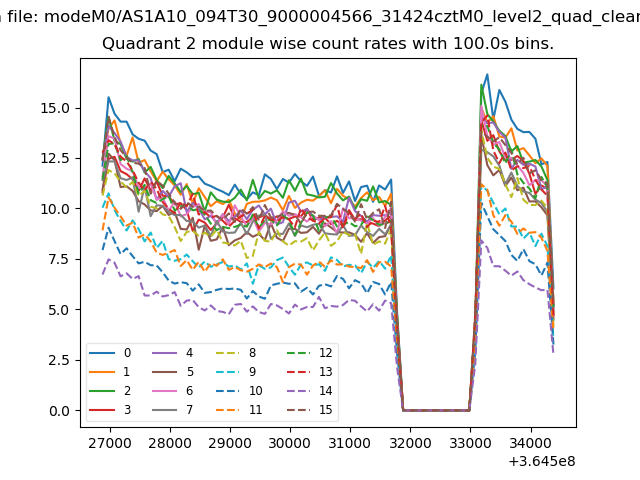
| Module-wise count rates for Quadrant B Data is divided into 100 sec bins |
 |
 |
| Module-wise count rates for Quadrant C Data is divided into 100 sec bins |
 |
 |
| Module-wise count rates for Quadrant D Data is divided into 100 sec bins |
 |
 |
| Parameter | Plot |
|---|---|
| CZT HV Monitor | 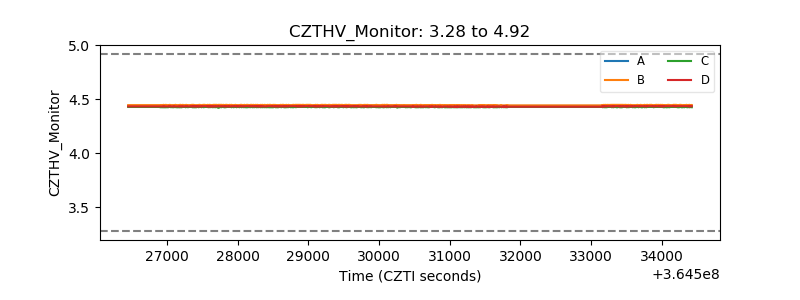 |
| D_VDD | 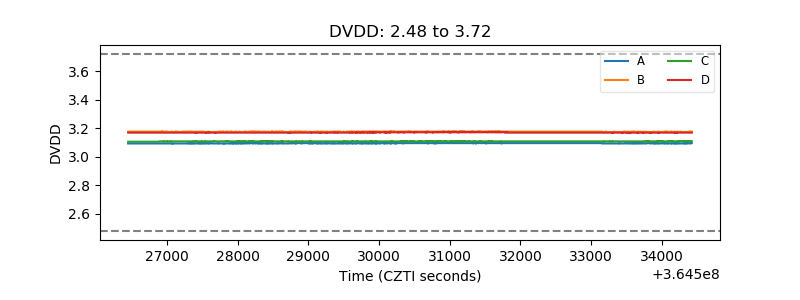 |
| Temperature 1 | 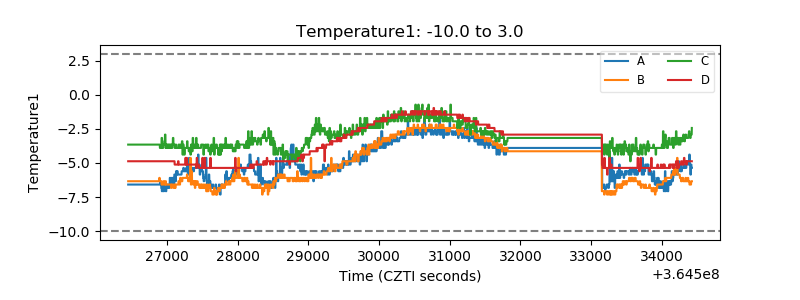 |
| Veto HV Monitor | 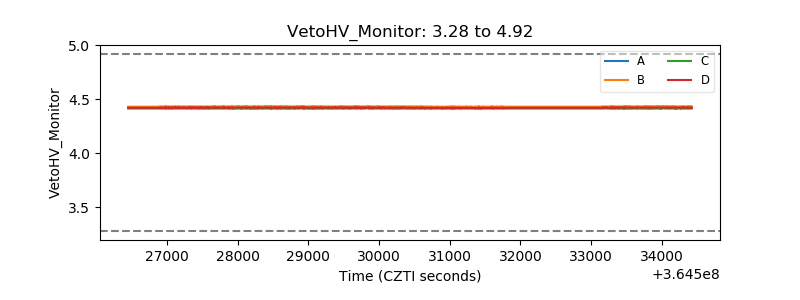 |
| Veto LLD | 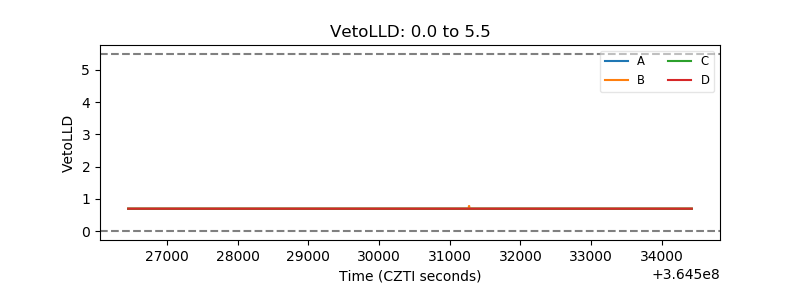 |
| Alpha Counter | 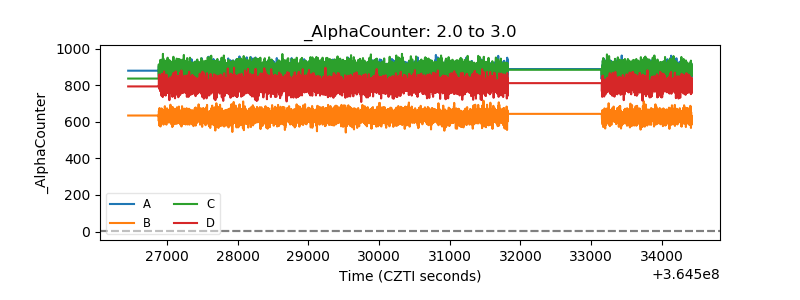 |
| _CPM_Rate | 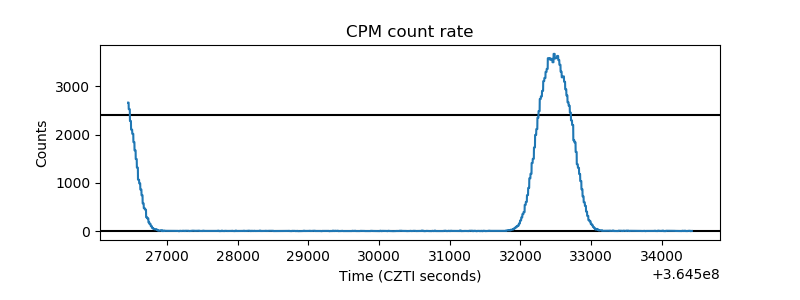 |
| CZT Counter | 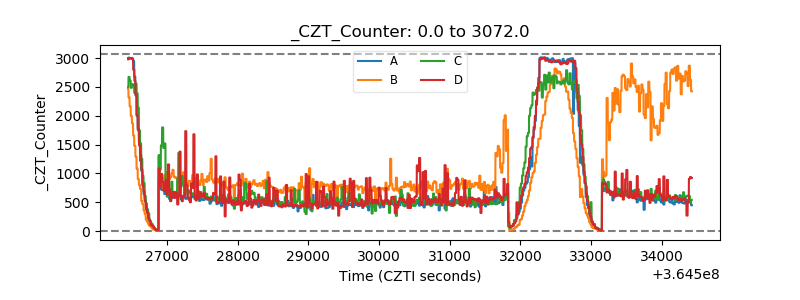 |
| +2.5 Volts monitor |  |
| +5 Volts monitor |  |
| _ROLL_ROT | 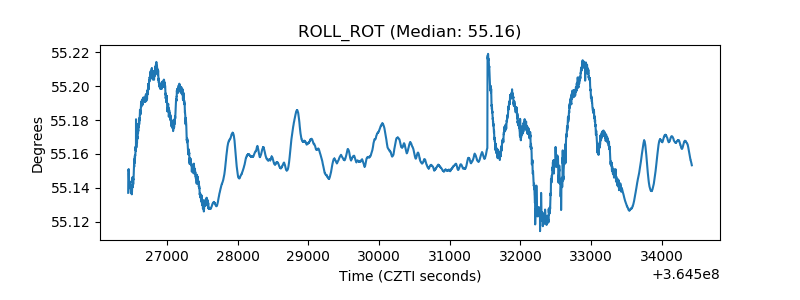 |
| _Roll_DEC | 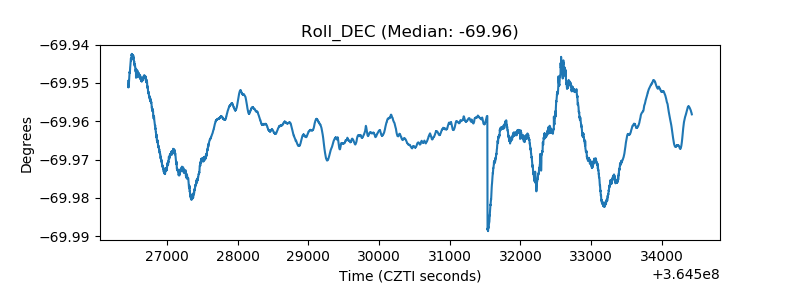 |
| _Roll_RA | 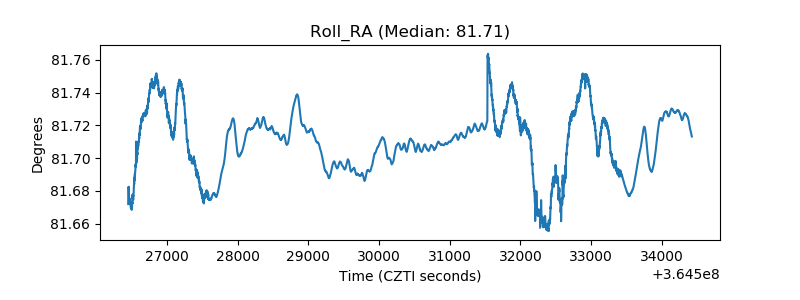 |
| Veto Counter | 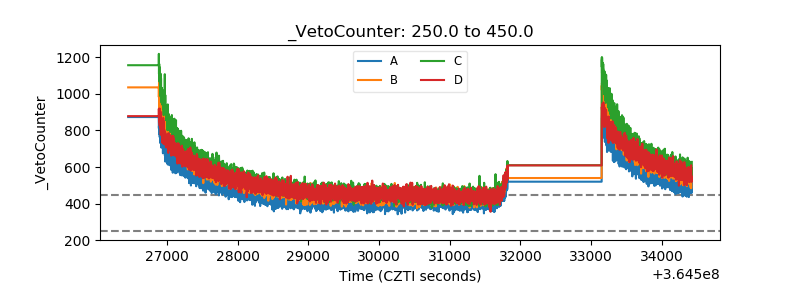 |