| Param | Original file | Final file |
|---|---|---|
| Filename | modeM0/AS1A10_094T30_9000004566_31425cztM0_level2.evt | modeM0/AS1A10_094T30_9000004566_31425cztM0_level2_quad_clean.evt |
| Size (bytes) | 753,647,040 | 122,702,400 |
| Size | 718.7 MB | 117.0 MB |
| Events in quadrant A | 3,118,663 | 963,935 |
| Events in quadrant B | 11,462,974 | 443,311 |
| Events in quadrant C | 3,434,920 | 957,959 |
| Events in quadrant D | 4,399,900 | 928,536 |
| Mode M9 | |||
|---|---|---|---|
| Quadrant | BADHDUFLAG | Total packets | Discarded packets |
| A | 0 | 14 | 0 |
| B | 0 | 14 | 0 |
| C | 0 | 14 | 0 |
| D | 0 | 14 | 0 |
| Mode M0 | |||
|---|---|---|---|
| Quadrant | BADHDUFLAG | Total packets | Discarded packets |
| A | 0 | 12815 | 1 |
| B | 0 | 38191 | 1 |
| C | 0 | 13974 | 1 |
| D | 0 | 17031 | 1 |
| Mode SS | |||
|---|---|---|---|
| Quadrant | BADHDUFLAG | Total packets | Discarded packets |
| A | 0 | 122 | 0 |
| B | 0 | 122 | 0 |
| C | 0 | 122 | 0 |
| D | 0 | 122 | 0 |
| Quadrant | Total seconds | Saturated seconds | Saturation percentage |
|---|---|---|---|
| A | 6019 | 10 | 0.166141% |
| B | 6020 | 4721 | 78.421927% |
| C | 6020 | 139 | 2.308970% |
| D | 6020 | 132 | 2.192691% |
Noise dominated data is calculated using 1-second bins in cleaned event files. If a bin has >2000 counts, and if more than 50% of those come from <1% of pixels, then it is considered to be noise-dominated and hence unusable.
| Quadrant | # 1 sec bins | Bins with >0 counts | Bins with >2000 counts | High rate bins dominated by noise | Noise dominated (total time) | Noise dominated (detector-on time) | Marked lightcurve |
|---|---|---|---|---|---|---|---|
| A | 7389 | 6020 | 0 | 0 | 0.00% | 0.00% | 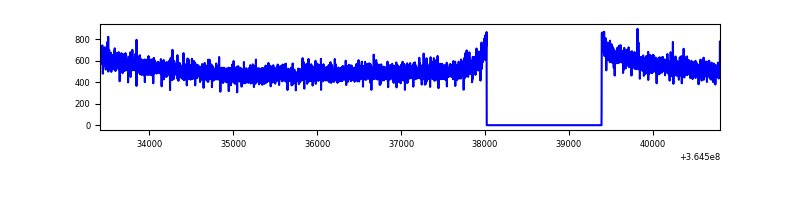 |
| B | 7390 | 6020 | 3183 | 3183 | 43.07% | 52.87% | 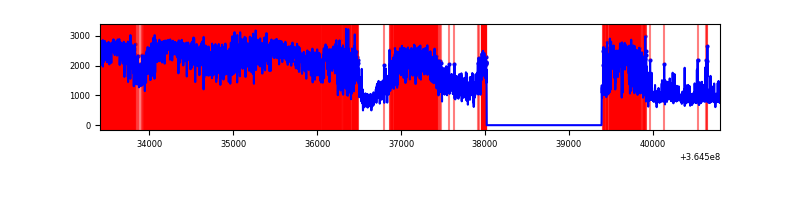 |
| C | 7390 | 6021 | 13 | 13 | 0.18% | 0.22% | 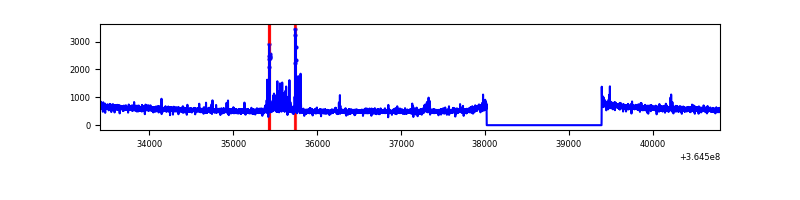 |
| D | 7390 | 6021 | 92 | 92 | 1.24% | 1.53% | 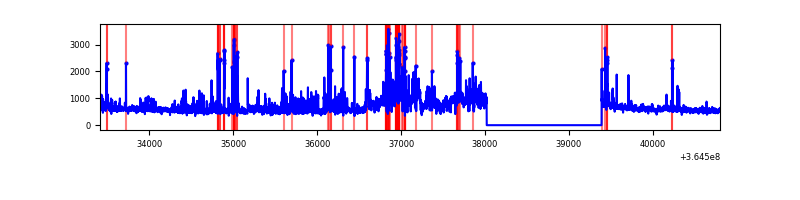 |
Top three noisy pixels from each quadrant. If the there are fewer than three noisy pixels in the level2.evt file, extra rows are filled as -1
| Pixel properties | Quadrant properties | ||||||
|---|---|---|---|---|---|---|---|
| Quadrant | DetID | PixID | Counts | Sigma | Mean | Median | Sigma |
| A | 13 | 254 | 11426 | 67.18 | 808 | 795 | 158.3 |
| A | 3 | 137 | 7387 | 41.65 | 808 | 795 | 158.3 |
| A | 0 | 226 | 6907 | 38.62 | 808 | 795 | 158.3 |
| B | 12 | 1 | 9068013 | 124483.51 | 394 | 385 | 72.8 |
| B | 6 | 159 | 799100 | 10965.03 | 394 | 385 | 72.8 |
| B | 4 | 80 | 38238 | 519.66 | 394 | 385 | 72.8 |
| C | 10 | 22 | 142031 | 774.57 | 800 | 808 | 182.3 |
| C | 14 | 238 | 139609 | 761.28 | 800 | 808 | 182.3 |
| C | 2 | 114 | 13899 | 71.8 | 800 | 808 | 182.3 |
| D | 8 | 195 | 773760 | 3735.85 | 792 | 783 | 206.9 |
| D | 12 | 218 | 427195 | 2060.88 | 792 | 783 | 206.9 |
| D | 1 | 52 | 52035 | 247.7 | 792 | 783 | 206.9 |
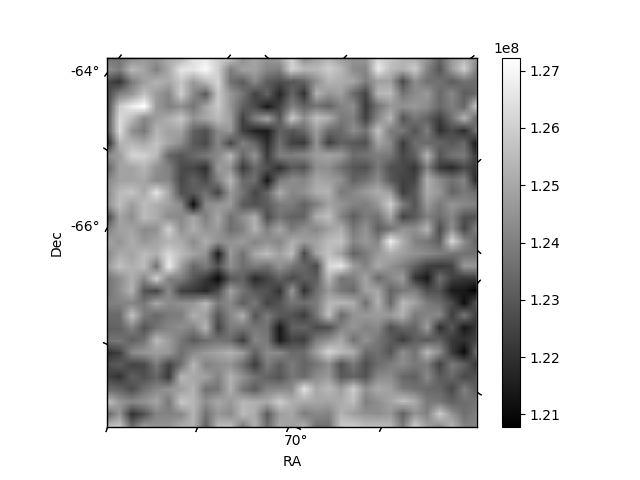
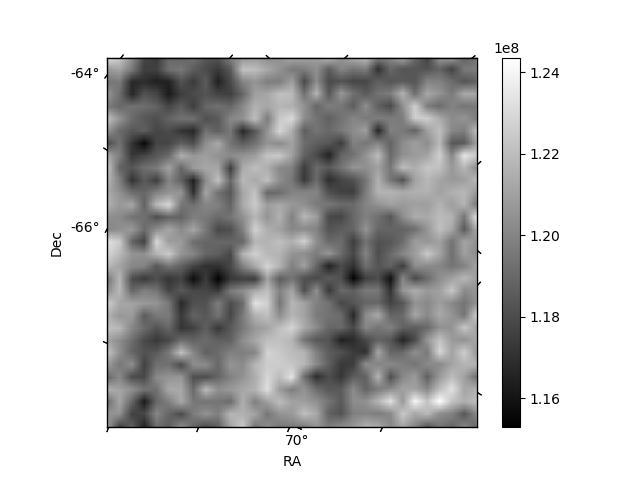
Histogram calculated using DETX and DETY for each event in the final _common_clean file
| Quadrant A | 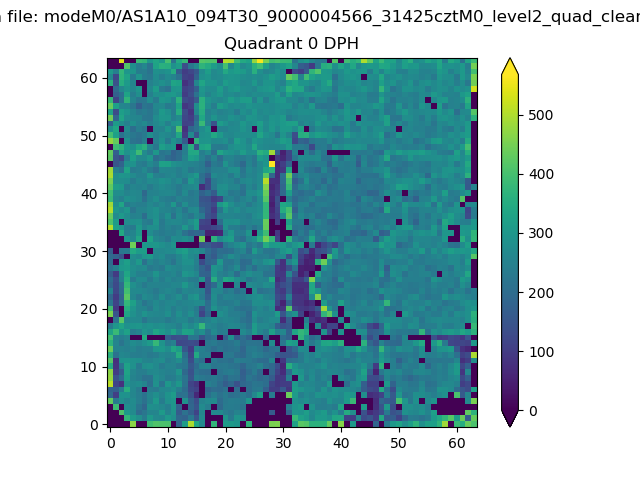 |
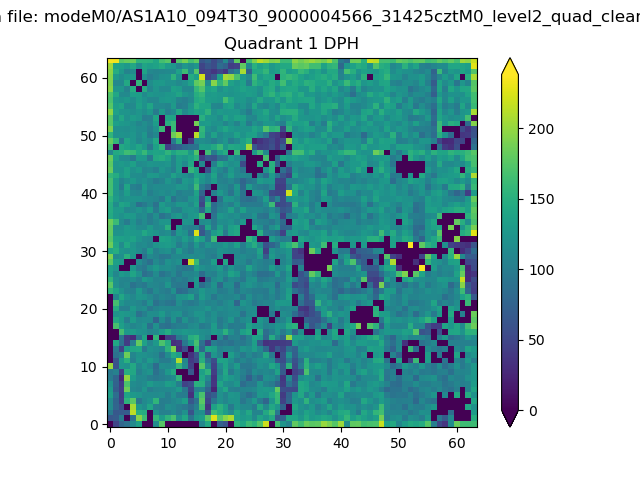 |
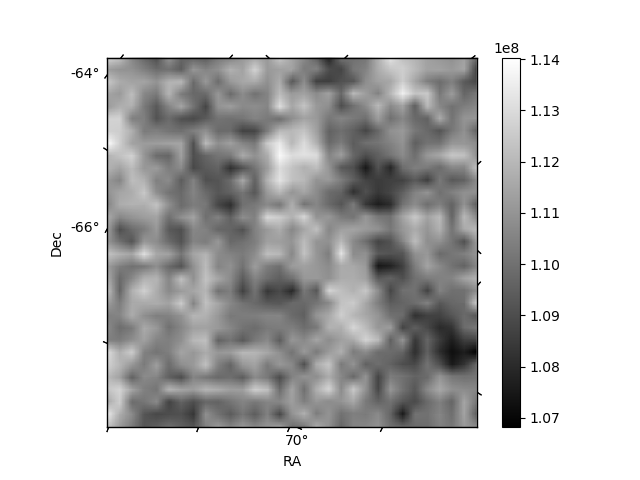
Quadrant B |
|---|---|---|---|
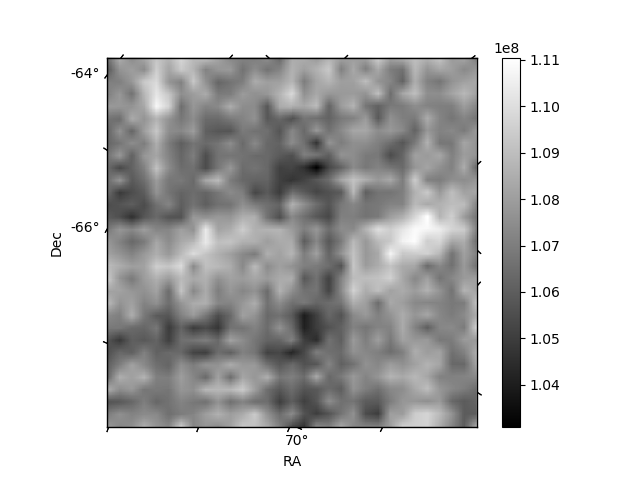
| Quadrant D |  |
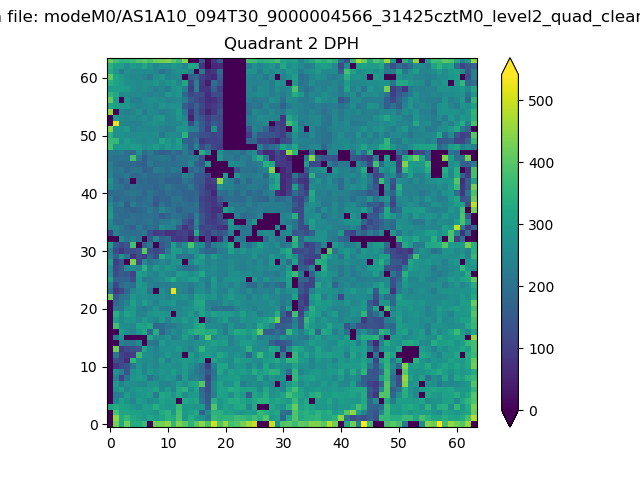 |
Quadrant C |
| Plot type | Count rate plots | Images |
|---|---|---|
| Comparison with Poisson distribution Blue bars denote a histogram of data divided into 1 sec bins. Red curve is a Poisson curve with rate = median count rate of data. |
 |
 |
| Quadrant-wise count rates Data is divided into 100 sec bins |
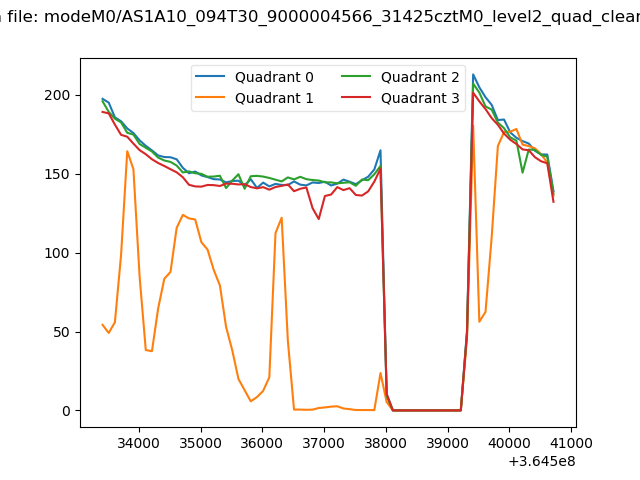 |
|
| Module-wise count rates for Quadrant A Data is divided into 100 sec bins |
 |
 |
| Module-wise count rates for Quadrant B Data is divided into 100 sec bins |
 |
 |
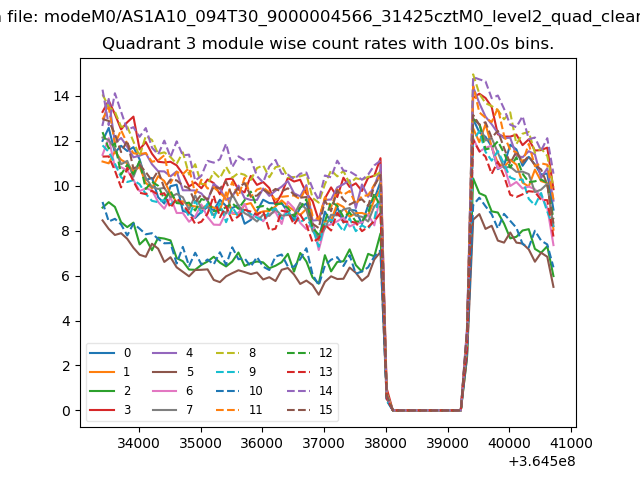
| Module-wise count rates for Quadrant C Data is divided into 100 sec bins |
 |
 |
| Module-wise count rates for Quadrant D Data is divided into 100 sec bins |
 |
 |
| Parameter | Plot |
|---|---|
| CZT HV Monitor |  |
| D_VDD | 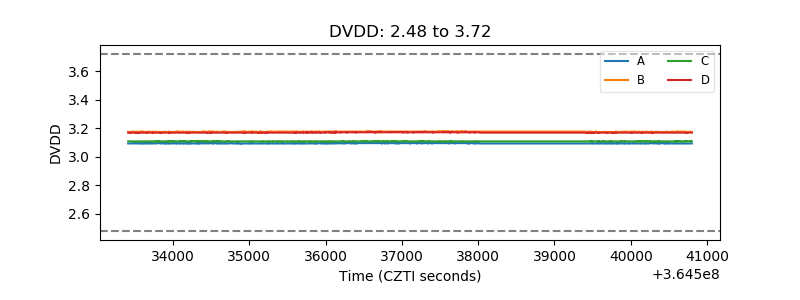 |
| Temperature 1 | 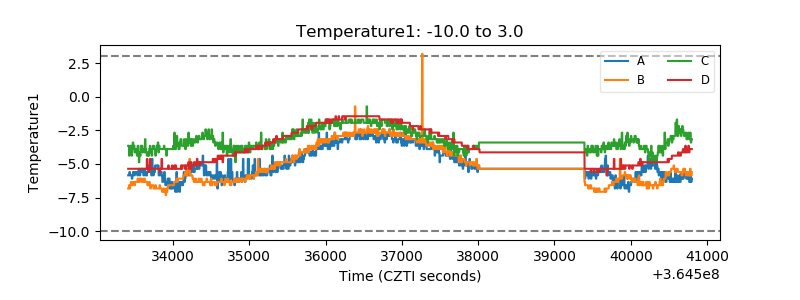 |
| Veto HV Monitor | 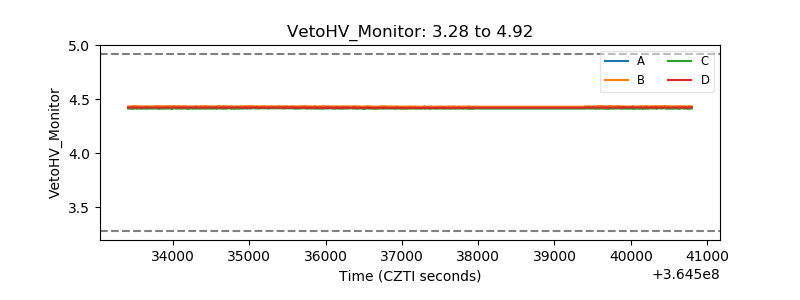 |
| Veto LLD | 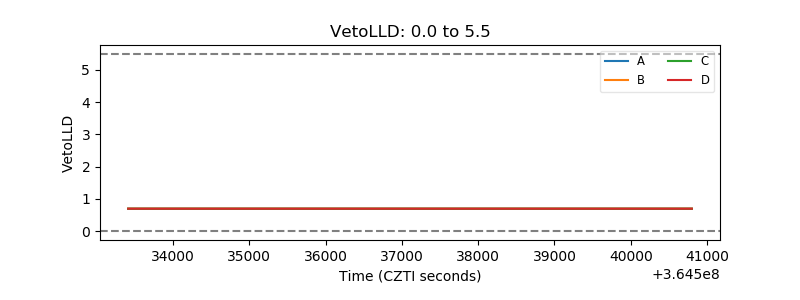 |
| Alpha Counter | 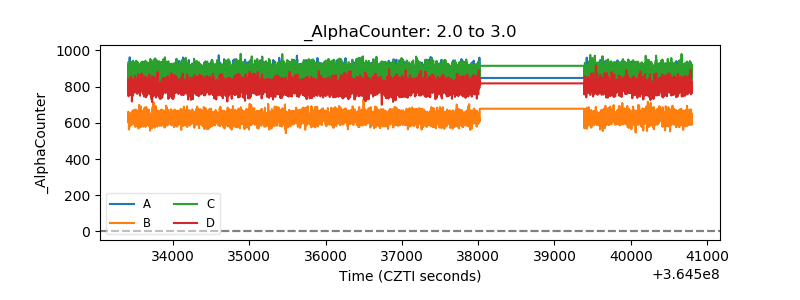 |
| _CPM_Rate | 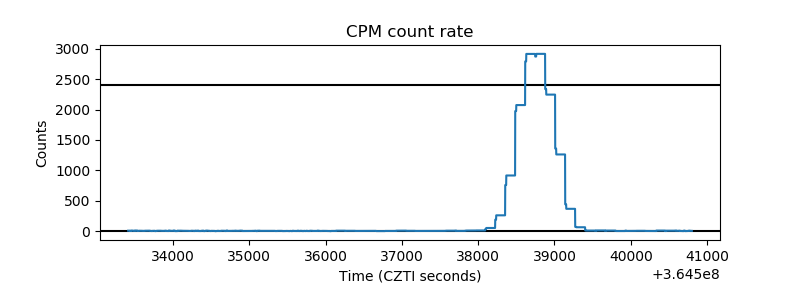 |
| CZT Counter | 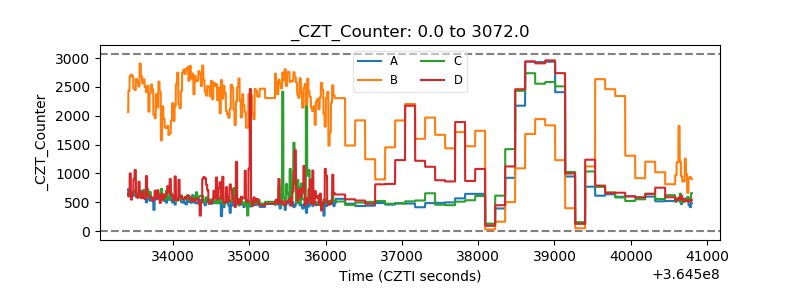 |
| +2.5 Volts monitor |  |
| +5 Volts monitor |  |
| _ROLL_ROT | 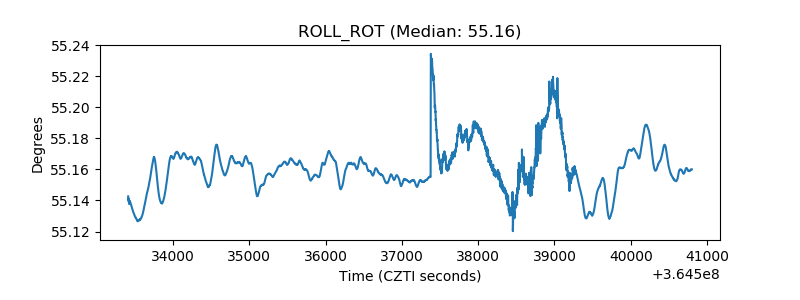 |
| _Roll_DEC | 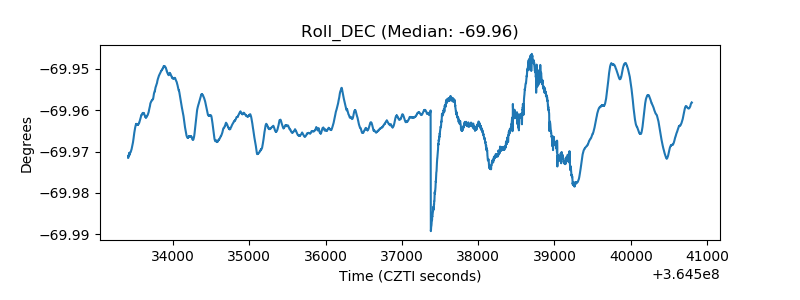 |
| _Roll_RA | 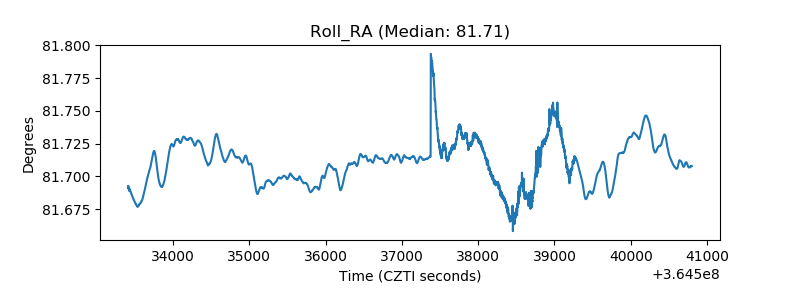 |
| Veto Counter |  |