| Param | Original file | Final file |
|---|---|---|
| Filename | modeM0/AS1A10_094T30_9000004566_31426cztM0_level2.evt | modeM0/AS1A10_094T30_9000004566_31426cztM0_level2_quad_clean.evt |
| Size (bytes) | 504,020,160 | 77,901,120 |
| Size | 480.7 MB | 74.3 MB |
| Events in quadrant A | 2,039,101 | 612,380 |
| Events in quadrant B | 7,771,464 | 263,688 |
| Events in quadrant C | 2,147,795 | 610,934 |
| Events in quadrant D | 3,034,264 | 588,979 |
| Mode M9 | |||
|---|---|---|---|
| Quadrant | BADHDUFLAG | Total packets | Discarded packets |
| A | 0 | 13 | 0 |
| B | 0 | 13 | 0 |
| C | 0 | 13 | 0 |
| D | 0 | 13 | 0 |
| Mode M0 | |||
|---|---|---|---|
| Quadrant | BADHDUFLAG | Total packets | Discarded packets |
| A | 0 | 9145 | 787 |
| B | 0 | 27083 | 1322 |
| C | 0 | 9593 | 851 |
| D | 0 | 13531 | 1371 |
| Mode SS | |||
|---|---|---|---|
| Quadrant | BADHDUFLAG | Total packets | Discarded packets |
| A | 0 | 90 | 6 |
| B | 0 | 91 | 7 |
| C | 0 | 90 | 6 |
| D | 0 | 91 | 7 |
| Quadrant | Total seconds | Saturated seconds | Saturation percentage |
|---|---|---|---|
| A | 3988 | 18 | 0.451354% |
| B | 3989 | 2935 | 73.577338% |
| C | 3986 | 105 | 2.634220% |
| D | 3986 | 131 | 3.286503% |
Noise dominated data is calculated using 1-second bins in cleaned event files. If a bin has >2000 counts, and if more than 50% of those come from <1% of pixels, then it is considered to be noise-dominated and hence unusable.
| Quadrant | # 1 sec bins | Bins with >0 counts | Bins with >2000 counts | High rate bins dominated by noise | Noise dominated (total time) | Noise dominated (detector-on time) | Marked lightcurve |
|---|---|---|---|---|---|---|---|
| A | 5367 | 3997 | 0 | 0 | 0.00% | 0.00% | 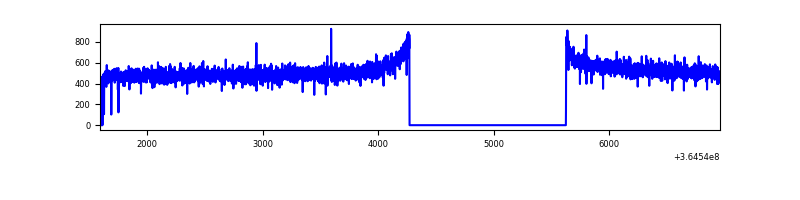 |
| B | 5349 | 3993 | 2410 | 2410 | 45.06% | 60.36% | 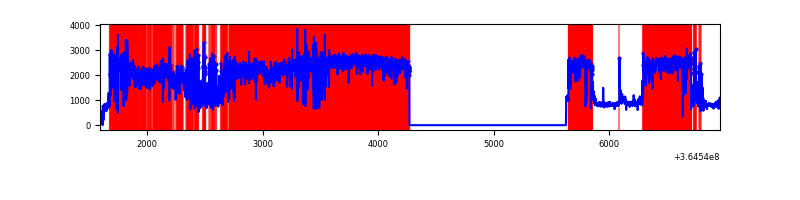 |
| C | 5344 | 3990 | 3 | 3 | 0.06% | 0.08% | 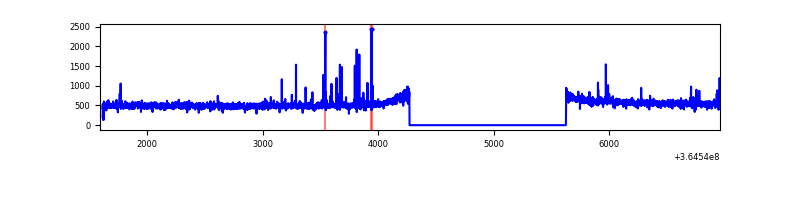 |
| D | 5352 | 3993 | 95 | 95 | 1.78% | 2.38% | 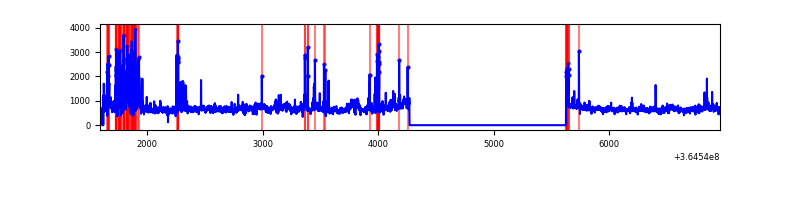 |
Top three noisy pixels from each quadrant. If the there are fewer than three noisy pixels in the level2.evt file, extra rows are filled as -1
| Pixel properties | Quadrant properties | ||||||
|---|---|---|---|---|---|---|---|
| Quadrant | DetID | PixID | Counts | Sigma | Mean | Median | Sigma |
| A | 13 | 254 | 7488 | 66.56 | 528 | 518 | 104.7 |
| A | 3 | 137 | 4972 | 42.53 | 528 | 518 | 104.7 |
| A | 0 | 226 | 4414 | 37.2 | 528 | 518 | 104.7 |
| B | 12 | 1 | 6273755 | 136101.14 | 242 | 236 | 46.1 |
| B | 6 | 159 | 504649 | 10943.01 | 242 | 236 | 46.1 |
| B | 12 | 2 | 24149 | 518.78 | 242 | 236 | 46.1 |
| C | 14 | 238 | 88862 | 739.1 | 514 | 519 | 119.5 |
| C | 3 | 233 | 36005 | 296.88 | 514 | 519 | 119.5 |
| C | 2 | 114 | 9367 | 74.02 | 514 | 519 | 119.5 |
| D | 8 | 195 | 469728 | 3847.16 | 514 | 501 | 122.0 |
| D | 12 | 218 | 320070 | 2620.12 | 514 | 501 | 122.0 |
| D | 5 | 233 | 137126 | 1120.18 | 514 | 501 | 122.0 |
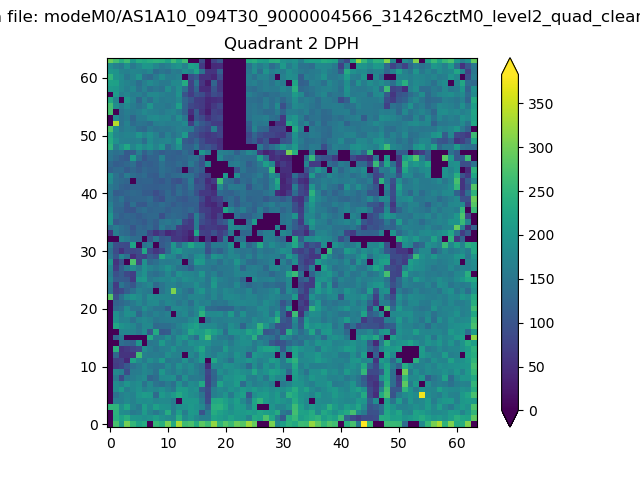
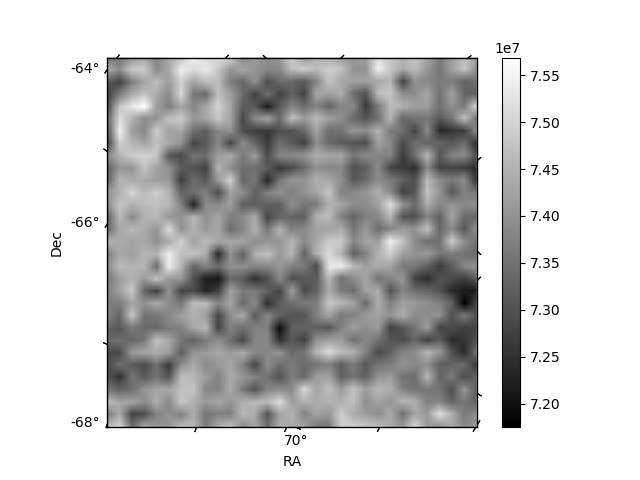
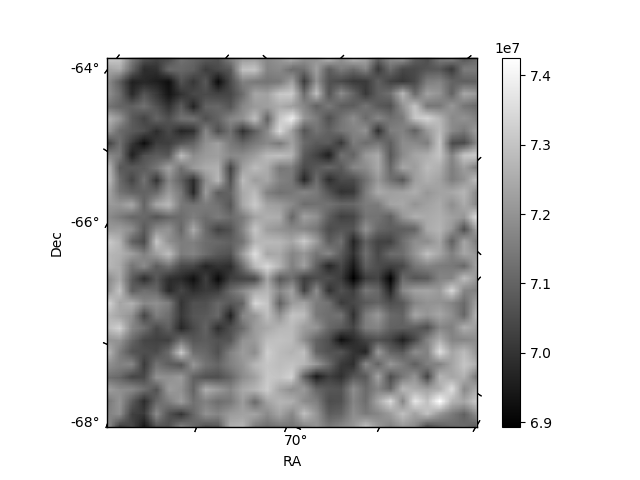
Histogram calculated using DETX and DETY for each event in the final _common_clean file
| Quadrant A | 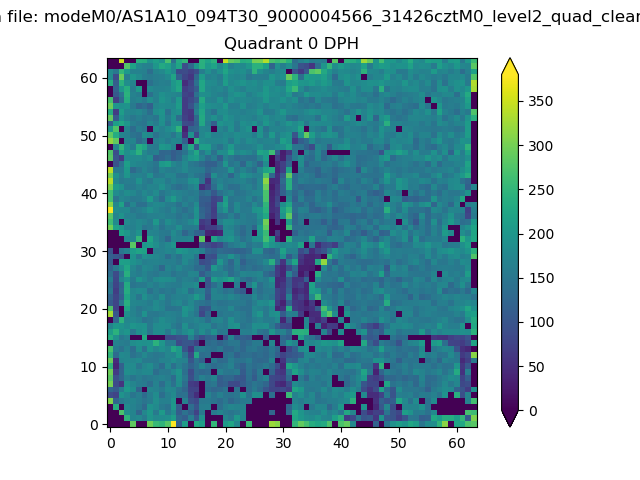 |
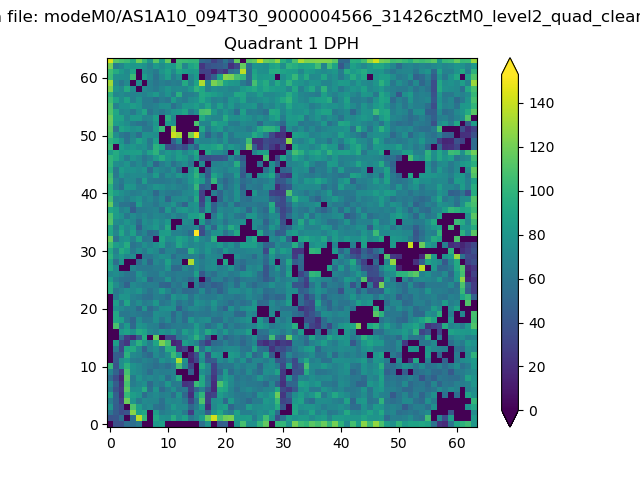 |
Quadrant B |
|---|---|---|---|
| Quadrant D | 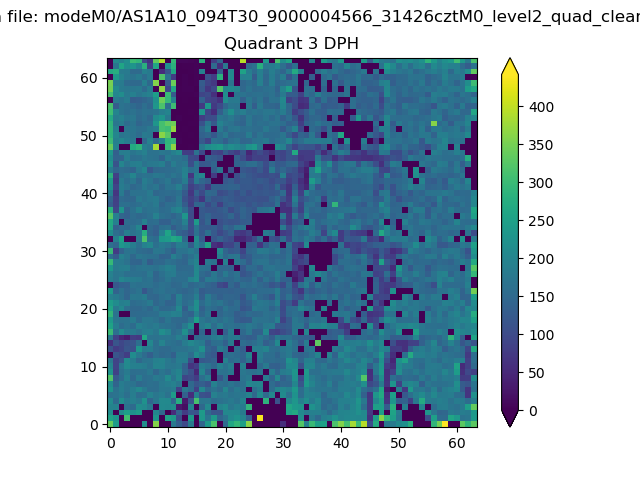 |
 |
Quadrant C |
| Plot type | Count rate plots | Images |
|---|---|---|
| Comparison with Poisson distribution Blue bars denote a histogram of data divided into 1 sec bins. Red curve is a Poisson curve with rate = median count rate of data. |
 |
 |
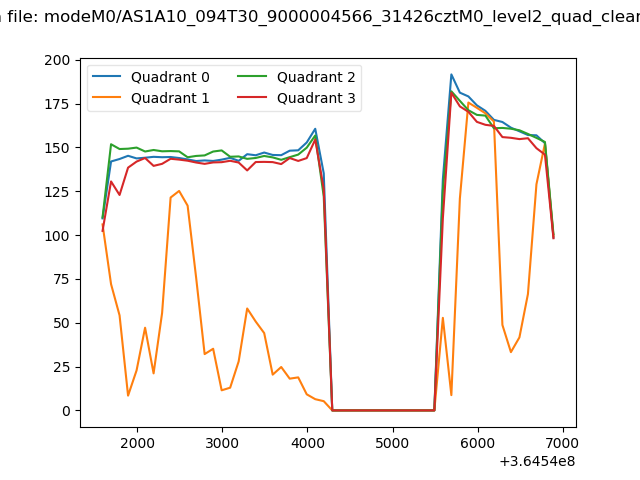
| Quadrant-wise count rates Data is divided into 100 sec bins |
 |
|
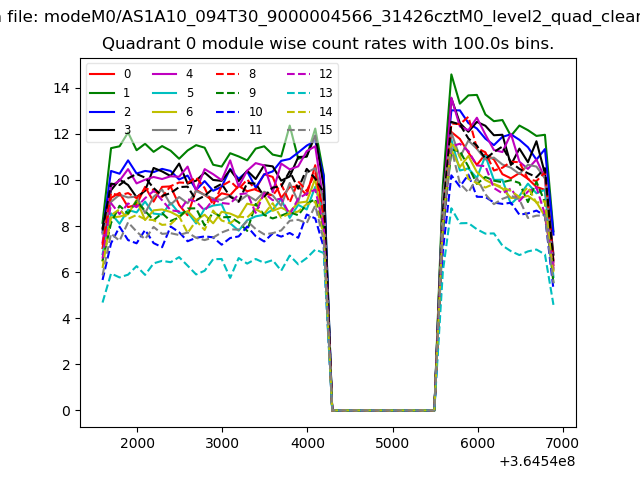
| Module-wise count rates for Quadrant A Data is divided into 100 sec bins |
 |
 |
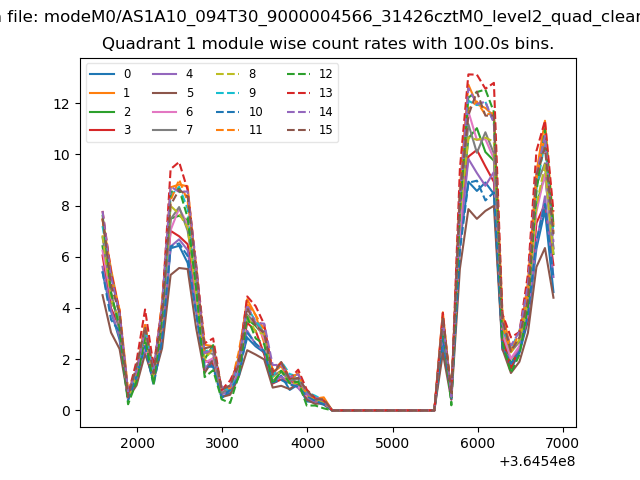
| Module-wise count rates for Quadrant B Data is divided into 100 sec bins |
 |
 |
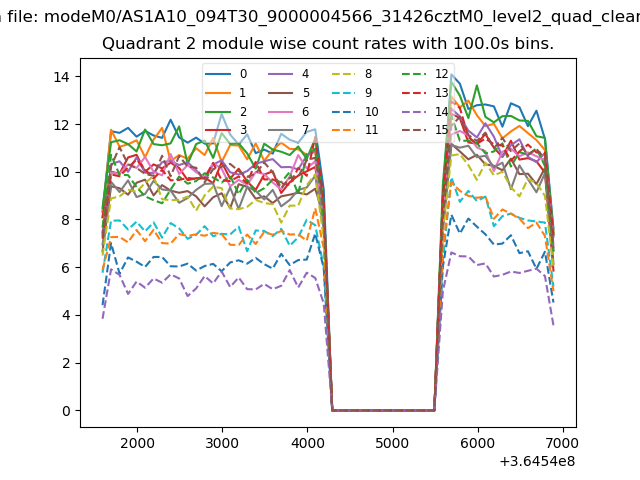
| Module-wise count rates for Quadrant C Data is divided into 100 sec bins |
 |
 |
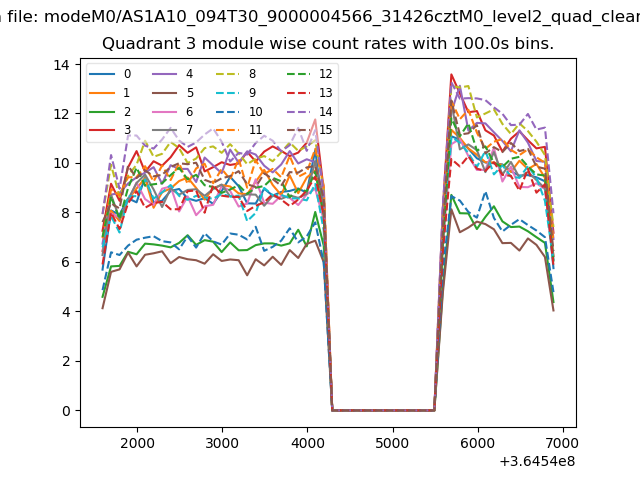
| Module-wise count rates for Quadrant D Data is divided into 100 sec bins |
 |
 |
| Parameter | Plot |
|---|---|
| CZT HV Monitor | 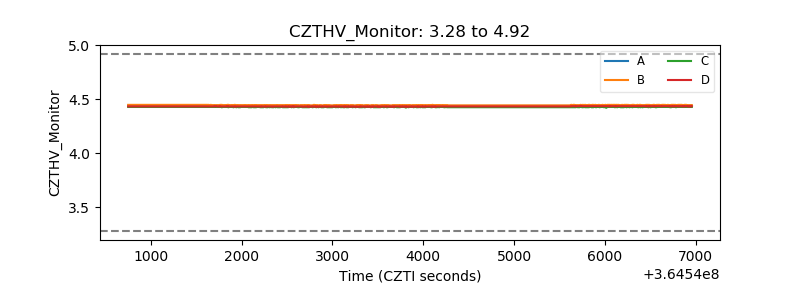 |
| D_VDD | 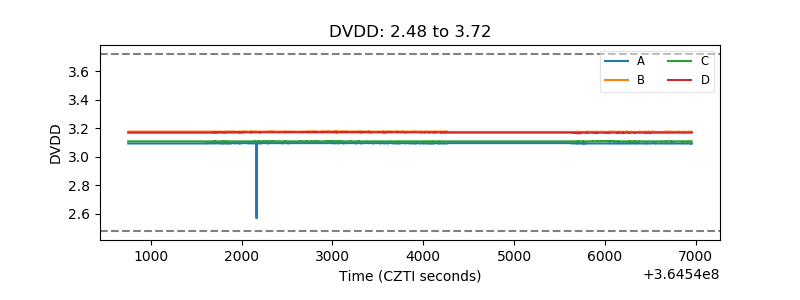 |
| Temperature 1 | 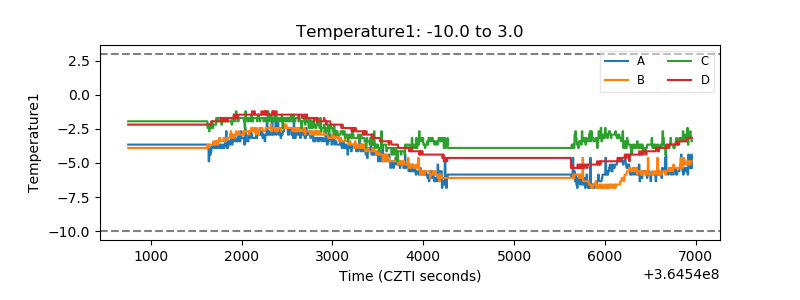 |
| Veto HV Monitor | 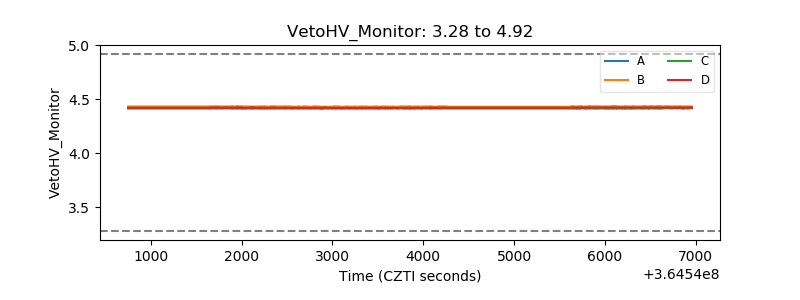 |
| Veto LLD |  |
| Alpha Counter | 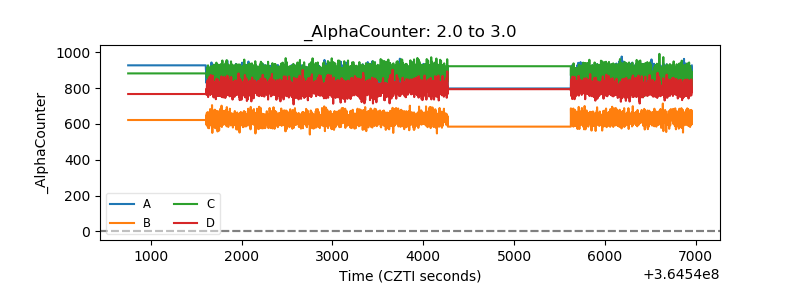 |
| _CPM_Rate | 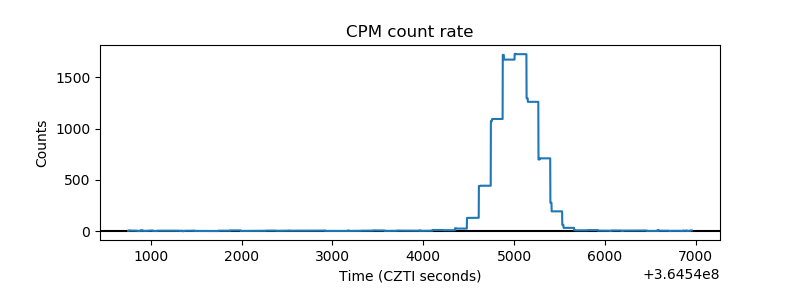 |
| CZT Counter | 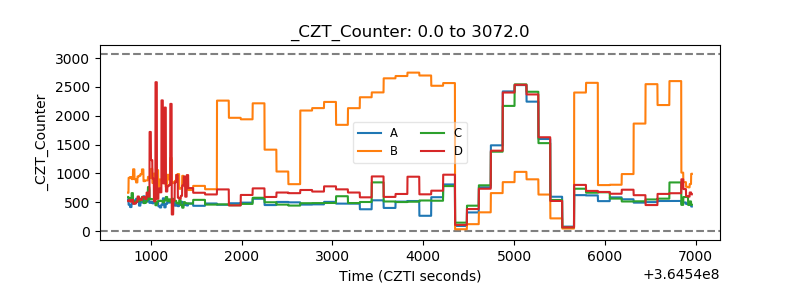 |
| +2.5 Volts monitor |  |
| +5 Volts monitor |  |
| _ROLL_ROT | 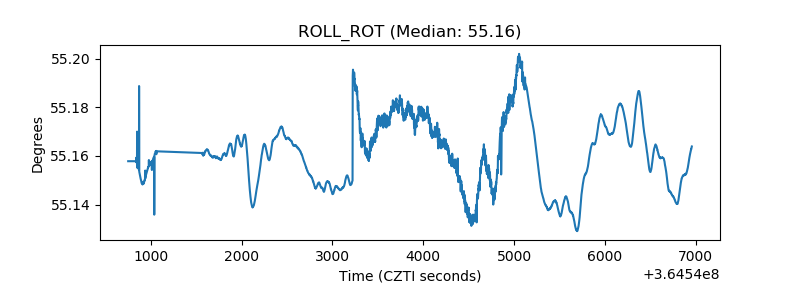 |
| _Roll_DEC | 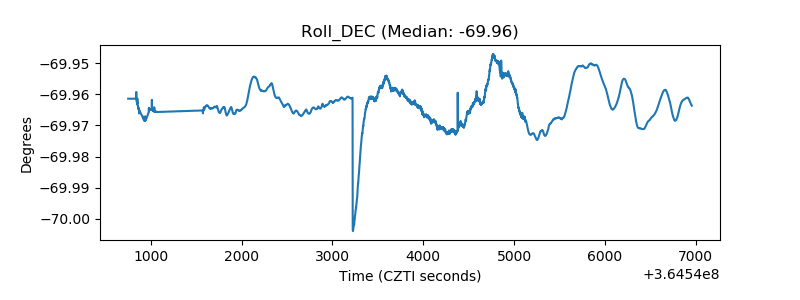 |
| _Roll_RA |  |
| Veto Counter | 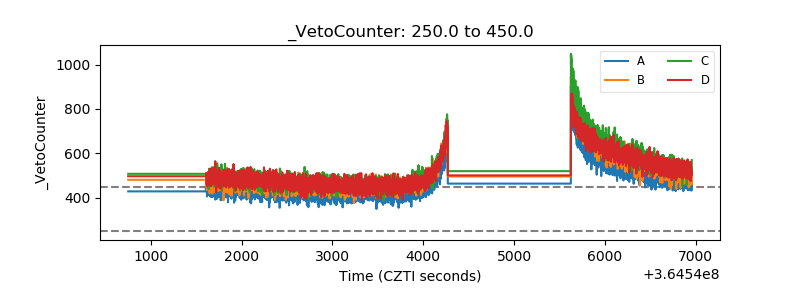 |