| Param | Original file | Final file |
|---|---|---|
| Filename | modeM0/AS1T04_026T01_9000004560cztM0_level2.fits | modeM0/AS1T04_026T01_9000004560cztM0_level2_quad_clean.evt |
| Size (bytes) | 260,147,520 | 272,096,640 |
| Size | 248.1 MB | 259.5 MB |
| Events in quadrant A | 1,613,876 | 1,687,551 |
| Events in quadrant B | 1,504,034 | 1,674,529 |
| Events in quadrant C | 1,545,276 | 1,592,890 |
| Events in quadrant D | 1,381,382 | 1,452,543 |
| Mode SS | |||
|---|---|---|---|
| Quadrant | BADHDUFLAG | Total packets | Discarded packets |
| A | 0 | 538 | 0 |
| B | 0 | 538 | 0 |
| C | 0 | 538 | 0 |
| D | 0 | 538 | 0 |
| Mode M9 | |||
|---|---|---|---|
| Quadrant | BADHDUFLAG | Total packets | Discarded packets |
| A | 0 | 14 | 0 |
| B | 0 | 14 | 0 |
| C | 0 | 14 | 0 |
| D | 0 | 14 | 0 |
| Mode M0 | |||
|---|---|---|---|
| Quadrant | BADHDUFLAG | Total packets | Discarded packets |
| A | 0 | 55134 | 0 |
| B | 0 | 80961 | 0 |
| C | 0 | 60733 | 0 |
| D | 0 | 66440 | 0 |
| Quadrant | Total seconds | Saturated seconds | Saturation percentage |
|---|---|---|---|
| A | 26658 | 662 | 2.483307% |
| B | 26658 | 1015 | 3.807487% |
| C | 26658 | 1252 | 4.696526% |
| D | 26658 | 978 | 3.668692% |
Noise dominated data is calculated using 1-second bins in cleaned event files. If a bin has >2000 counts, and if more than 50% of those come from <1% of pixels, then it is considered to be noise-dominated and hence unusable.
| Quadrant | # 1 sec bins | Bins with >0 counts | Bins with >2000 counts | High rate bins dominated by noise | Noise dominated (total time) | Noise dominated (detector-on time) | Marked lightcurve |
|---|---|---|---|---|---|---|---|
| A | 27842 | 26655 | 0 | 0 | 0.00% | 0.00% |  |
| B | 27842 | 26654 | 0 | 0 | 0.00% | 0.00% |  |
| C | 27842 | 26648 | 0 | 0 | 0.00% | 0.00% |  |
| D | 27842 | 26654 | 0 | 0 | 0.00% | 0.00% |  |
Top three noisy pixels from each quadrant. If the there are fewer than three noisy pixels in the level2.evt file, extra rows are filled as -1
| Pixel properties | Quadrant properties | ||||||
|---|---|---|---|---|---|---|---|
| Quadrant | DetID | PixID | Counts | Sigma | Mean | Median | Sigma |
| A | 0 | 29 | 1543 | 10.94 | 419 | 392 | 105.2 |
| A | 7 | 110 | 1245 | 8.11 | 419 | 392 | 105.2 |
| A | 0 | 30 | 1186 | 7.54 | 419 | 392 | 105.2 |
| B | 2 | 9 | 1188 | 10.17 | 396 | 377 | 79.8 |
| B | 3 | 17 | 1082 | 8.84 | 396 | 377 | 79.8 |
| B | 2 | 8 | 1025 | 8.12 | 396 | 377 | 79.8 |
| C | 1 | 81 | 1197 | 7.74 | 408 | 381 | 105.4 |
| C | 1 | 80 | 1171 | 7.49 | 408 | 381 | 105.4 |
| C | 12 | 241 | 1075 | 6.58 | 408 | 381 | 105.4 |
| D | 15 | 47 | 1051 | 6.59 | 393 | 359 | 105.0 |
| D | 15 | 63 | 1042 | 6.51 | 393 | 359 | 105.0 |
| D | 10 | 189 | 984 | 5.95 | 393 | 359 | 105.0 |
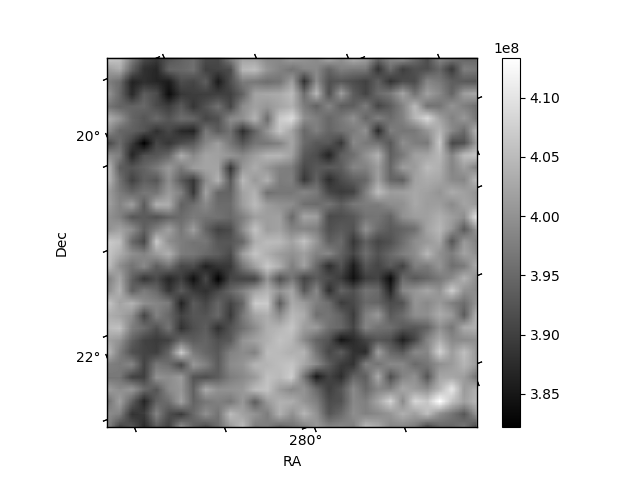
Histogram calculated using DETX and DETY for each event in the final _common_clean file
| Quadrant A | 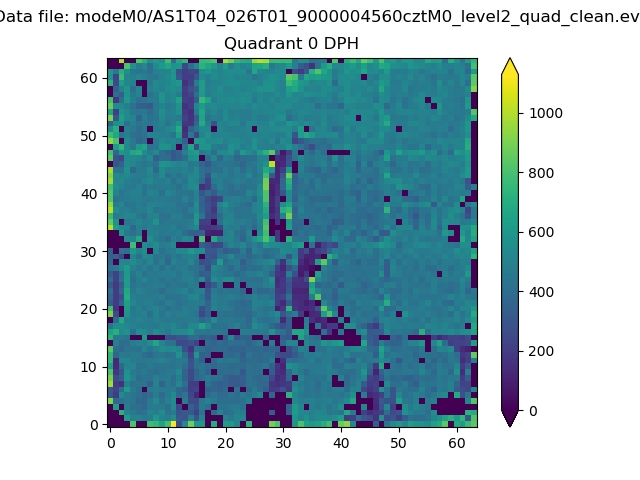 |
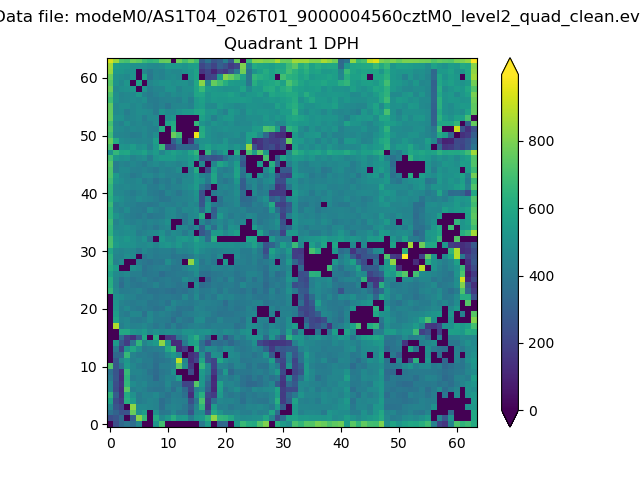 |
Quadrant B |
|---|---|---|---|
| Quadrant D | 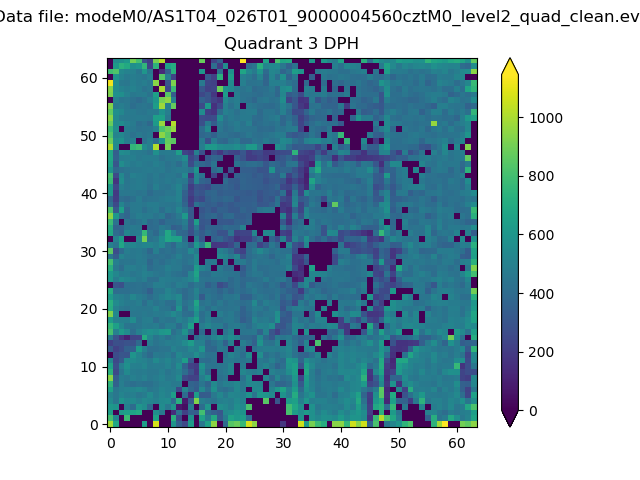 |
 |
Quadrant C |
| Plot type | Count rate plots | Images |
|---|---|---|
| Comparison with Poisson distribution Blue bars denote a histogram of data divided into 1 sec bins. Red curve is a Poisson curve with rate = median count rate of data. |
 |
 |
| Quadrant-wise count rates Data is divided into 100 sec bins |
 |
|
| Module-wise count rates for Quadrant A Data is divided into 100 sec bins |
 |
 |
| Module-wise count rates for Quadrant B Data is divided into 100 sec bins |
 |
 |
| Module-wise count rates for Quadrant C Data is divided into 100 sec bins |
 |
 |
| Module-wise count rates for Quadrant D Data is divided into 100 sec bins |
 |
 |
| Parameter | Plot |
|---|---|
| CZT HV Monitor |  |
| D_VDD |  |
| Temperature 1 |  |
| Veto HV Monitor |  |
| Veto LLD | 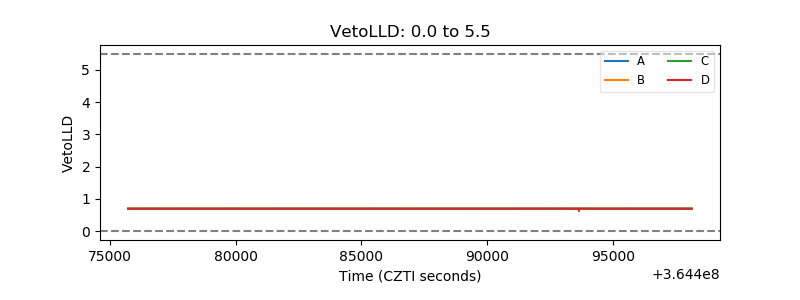 |
| Alpha Counter |  |
| _CPM_Rate |  |
| CZT Counter |  |
| +2.5 Volts monitor |  |
| +5 Volts monitor |  |
| _ROLL_ROT | 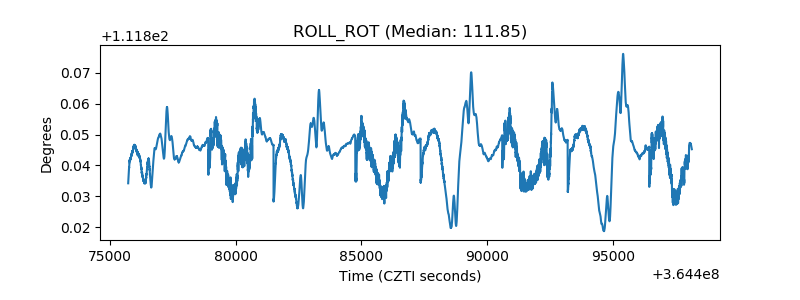 |
| _Roll_DEC |  |
| _Roll_RA |  |
| Veto Counter |  |