| Param | Original file | Final file |
|---|---|---|
| Filename | modeM0/AS1T04_026T01_9000004560_31415cztM0_level2.evt | modeM0/AS1T04_026T01_9000004560_31415cztM0_level2_quad_clean.evt |
| Size (bytes) | 665,732,160 | 89,087,040 |
| Size | 634.9 MB | 85.0 MB |
| Events in quadrant A | 3,858,111 | 555,151 |
| Events in quadrant B | 6,008,394 | 554,303 |
| Events in quadrant C | 4,313,312 | 537,822 |
| Events in quadrant D | 5,453,748 | 507,752 |
| Mode SS | |||
|---|---|---|---|
| Quadrant | BADHDUFLAG | Total packets | Discarded packets |
| A | 0 | 162 | 0 |
| B | 0 | 162 | 0 |
| C | 0 | 162 | 0 |
| D | 0 | 162 | 0 |
| Mode M9 | |||
|---|---|---|---|
| Quadrant | BADHDUFLAG | Total packets | Discarded packets |
| A | 0 | 8 | 0 |
| B | 0 | 8 | 0 |
| C | 0 | 8 | 0 |
| D | 0 | 8 | 0 |
| Mode M0 | |||
|---|---|---|---|
| Quadrant | BADHDUFLAG | Total packets | Discarded packets |
| A | 0 | 16305 | 2 |
| B | 0 | 23705 | 2 |
| C | 0 | 17719 | 2 |
| D | 0 | 21182 | 2 |
| Quadrant | Total seconds | Saturated seconds | Saturation percentage |
|---|---|---|---|
| A | 7796 | 271 | 3.476142% |
| B | 7797 | 399 | 5.117353% |
| C | 7797 | 349 | 4.476081% |
| D | 7797 | 525 | 6.733359% |
Noise dominated data is calculated using 1-second bins in cleaned event files. If a bin has >2000 counts, and if more than 50% of those come from <1% of pixels, then it is considered to be noise-dominated and hence unusable.
| Quadrant | # 1 sec bins | Bins with >0 counts | Bins with >2000 counts | High rate bins dominated by noise | Noise dominated (total time) | Noise dominated (detector-on time) | Marked lightcurve |
|---|---|---|---|---|---|---|---|
| A | 8641 | 7797 | 0 | 0 | 0.00% | 0.00% | 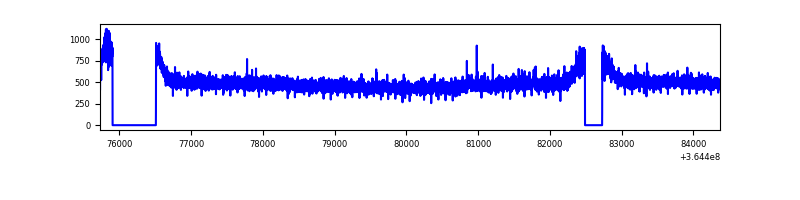 |
| B | 8642 | 7798 | 6 | 6 | 0.07% | 0.08% | 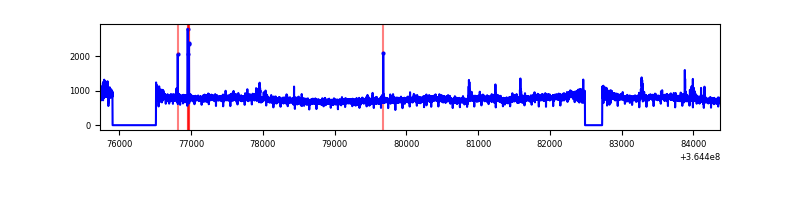 |
| C | 8642 | 7798 | 8 | 8 | 0.09% | 0.10% | 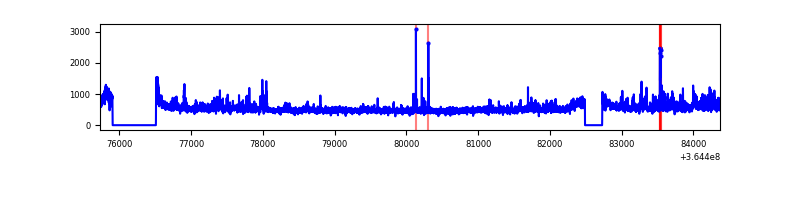 |
| D | 8642 | 7798 | 309 | 309 | 3.58% | 3.96% | 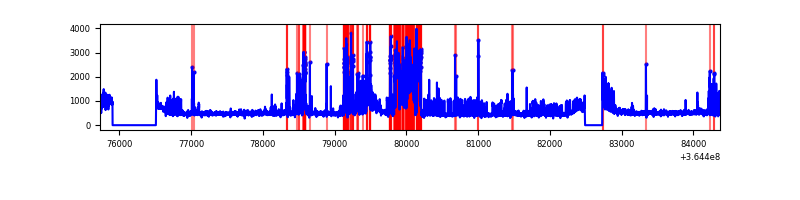 |
Top three noisy pixels from each quadrant. If the there are fewer than three noisy pixels in the level2.evt file, extra rows are filled as -1
| Pixel properties | Quadrant properties | ||||||
|---|---|---|---|---|---|---|---|
| Quadrant | DetID | PixID | Counts | Sigma | Mean | Median | Sigma |
| A | 13 | 254 | 11422 | 51.43 | 999 | 978 | 203.1 |
| A | 3 | 137 | 10925 | 48.99 | 999 | 978 | 203.1 |
| A | 0 | 226 | 8498 | 37.03 | 999 | 978 | 203.1 |
| B | 6 | 159 | 2072858 | 10893.73 | 974 | 946 | 190.2 |
| B | 0 | 190 | 46395 | 238.96 | 974 | 946 | 190.2 |
| B | 4 | 80 | 27553 | 139.89 | 974 | 946 | 190.2 |
| C | 3 | 233 | 349087 | 1540.03 | 953 | 954 | 226.1 |
| C | 14 | 238 | 157139 | 690.91 | 953 | 954 | 226.1 |
| C | 10 | 22 | 70721 | 308.63 | 953 | 954 | 226.1 |
| D | 12 | 218 | 1061555 | 4589.48 | 957 | 930 | 231.1 |
| D | 8 | 195 | 631138 | 2727.0 | 957 | 930 | 231.1 |
| D | 2 | 250 | 84904 | 363.37 | 957 | 930 | 231.1 |
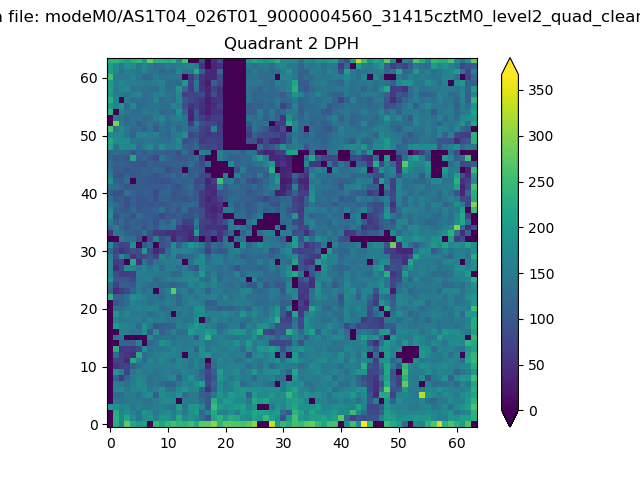
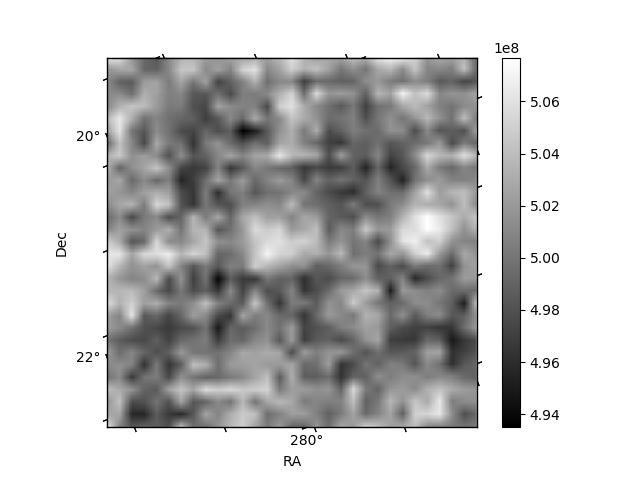
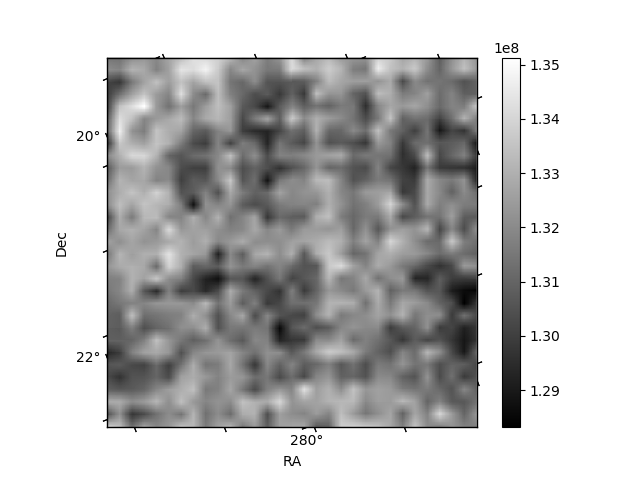
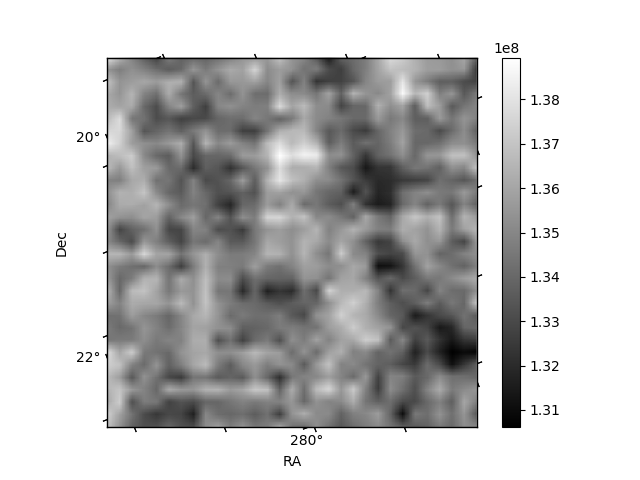
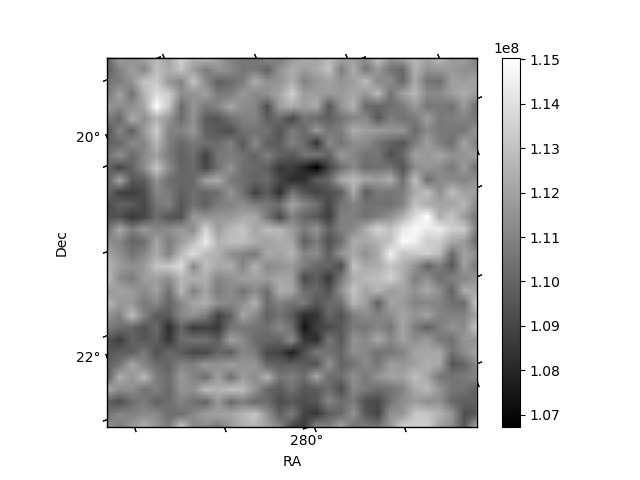
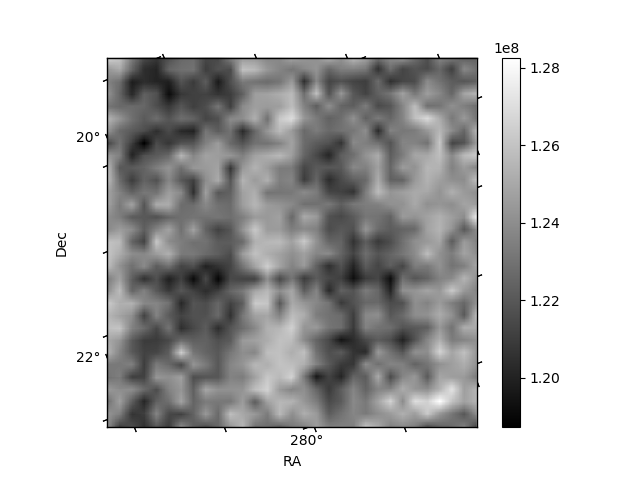
Histogram calculated using DETX and DETY for each event in the final _common_clean file
| Quadrant A | 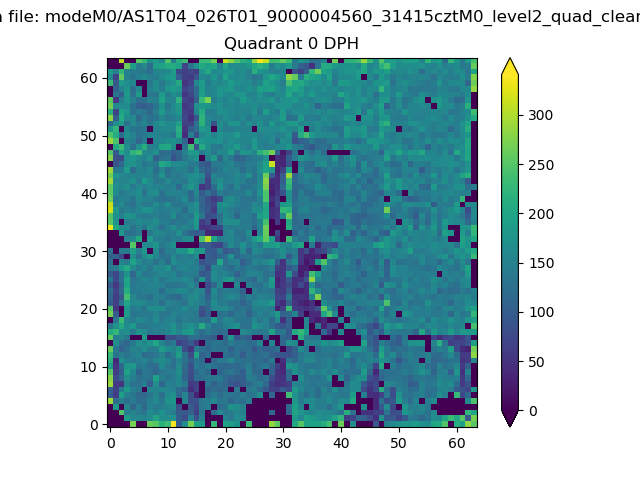 |
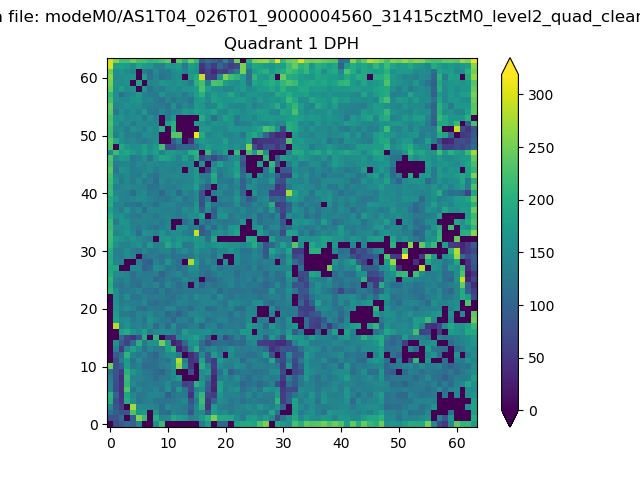 |
Quadrant B |
|---|---|---|---|
| Quadrant D | 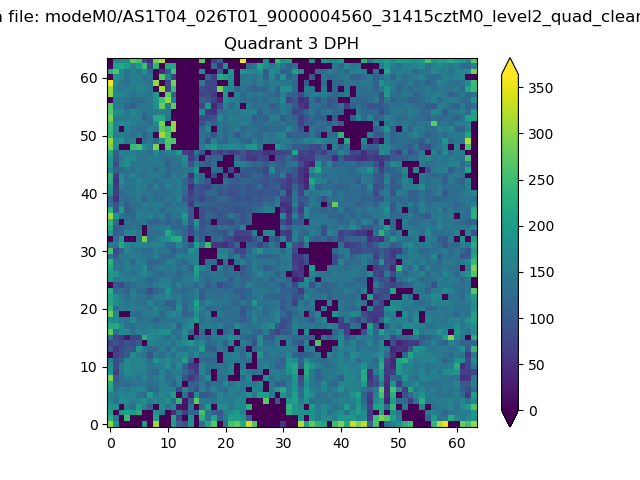 |
 |
Quadrant C |
| Plot type | Count rate plots | Images |
|---|---|---|
| Comparison with Poisson distribution Blue bars denote a histogram of data divided into 1 sec bins. Red curve is a Poisson curve with rate = median count rate of data. |
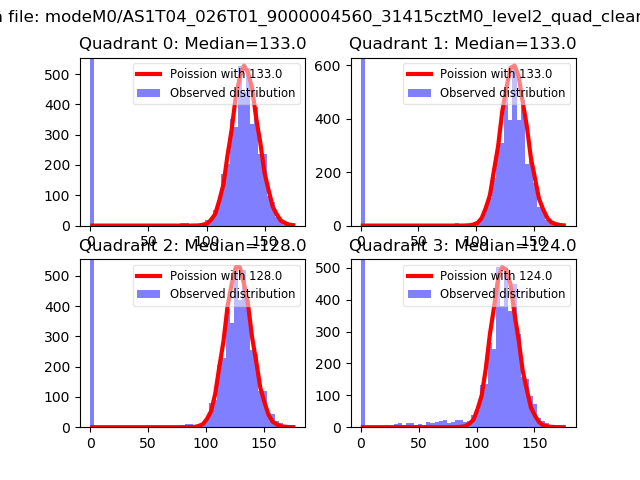 |
 |
| Quadrant-wise count rates Data is divided into 100 sec bins |
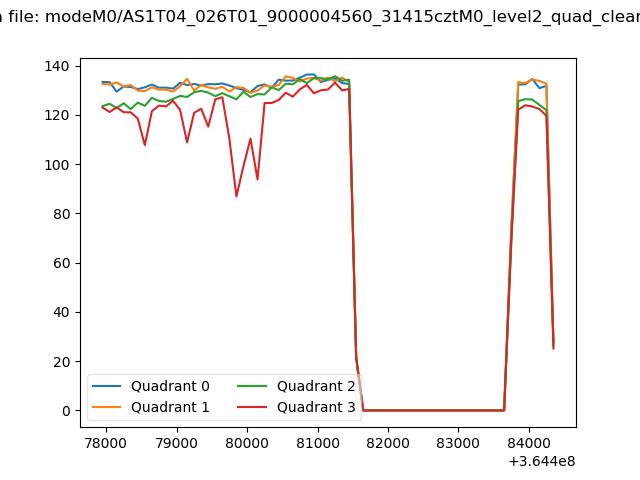 |
|
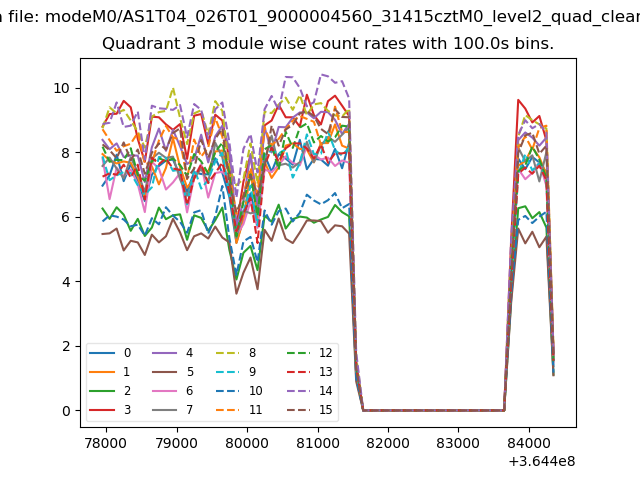
| Module-wise count rates for Quadrant A Data is divided into 100 sec bins |
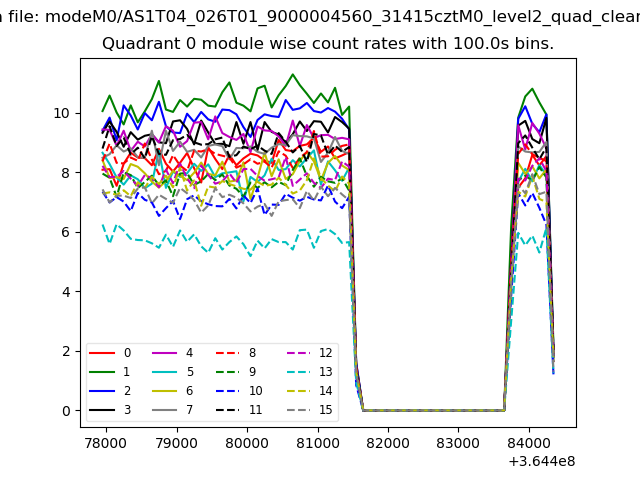 |
 |
| Module-wise count rates for Quadrant B Data is divided into 100 sec bins |
 |
 |
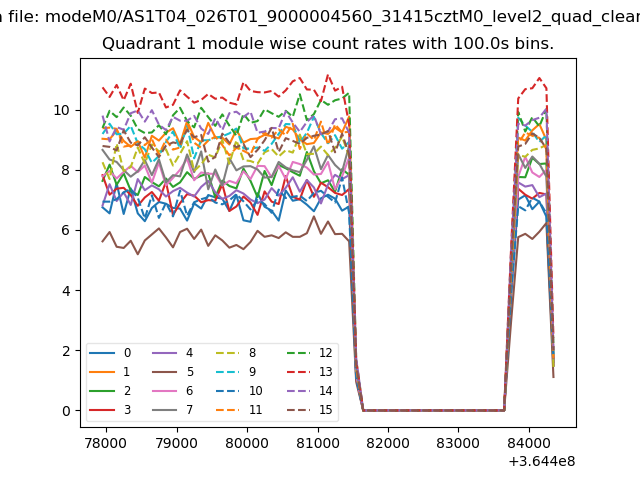
| Module-wise count rates for Quadrant C Data is divided into 100 sec bins |
 |
 |
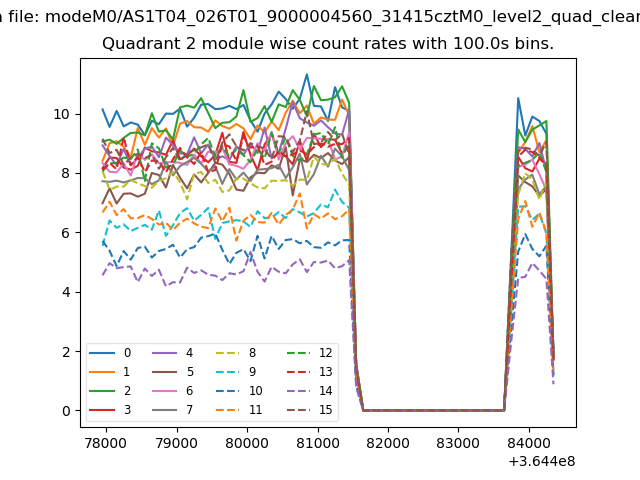
| Module-wise count rates for Quadrant D Data is divided into 100 sec bins |
 |
 |
| Parameter | Plot |
|---|---|
| CZT HV Monitor | 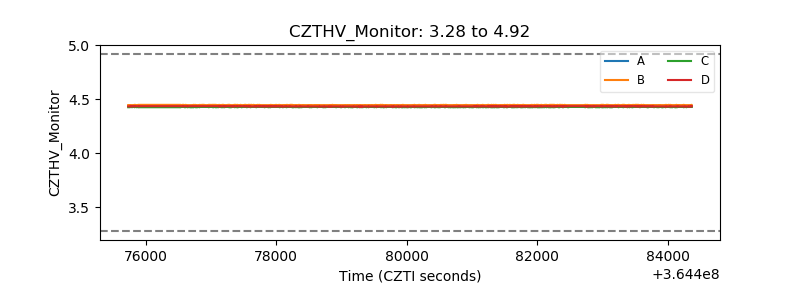 |
| D_VDD | 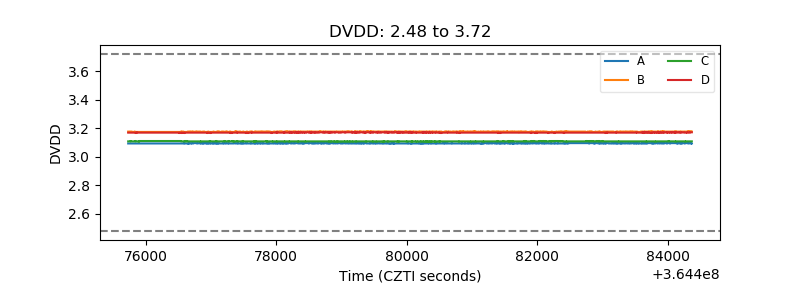 |
| Temperature 1 | 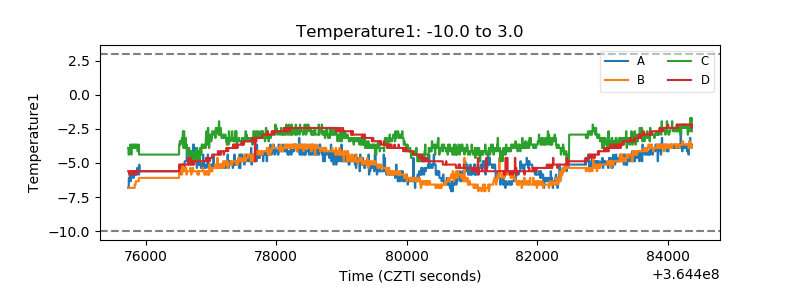 |
| Veto HV Monitor | 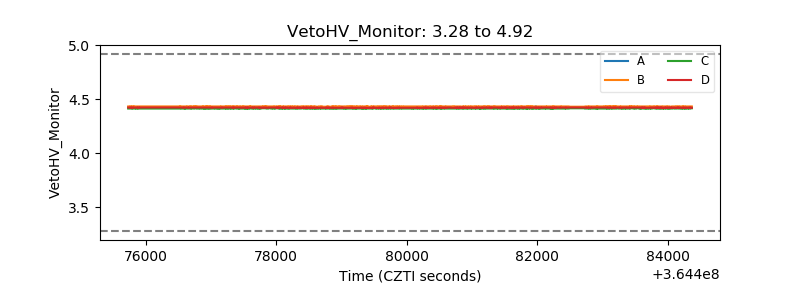 |
| Veto LLD | 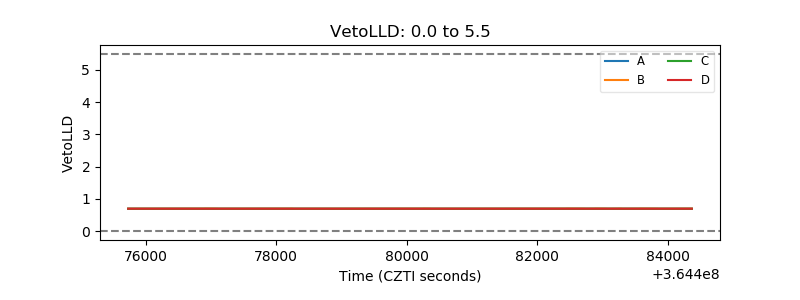 |
| Alpha Counter | 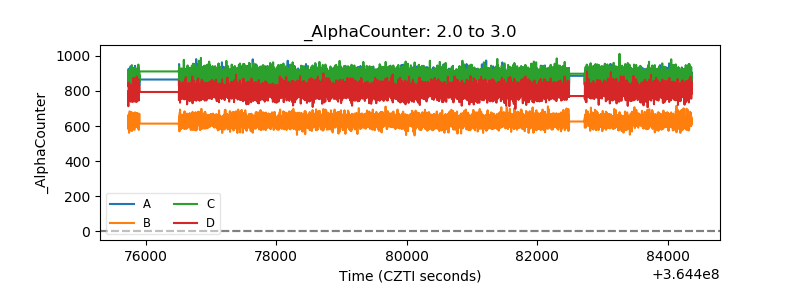 |
| _CPM_Rate | 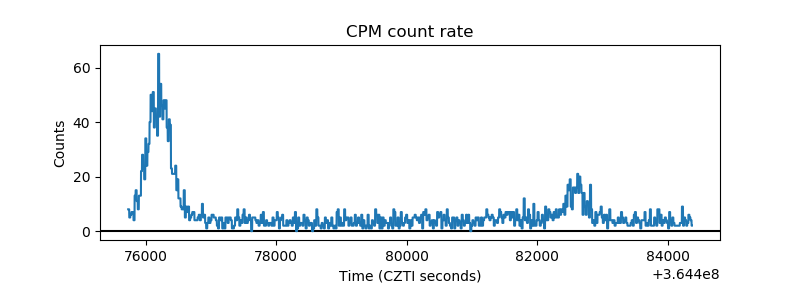 |
| CZT Counter | 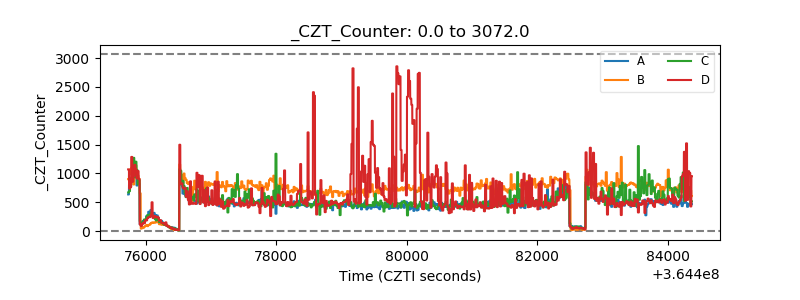 |
| +2.5 Volts monitor |  |
| +5 Volts monitor | 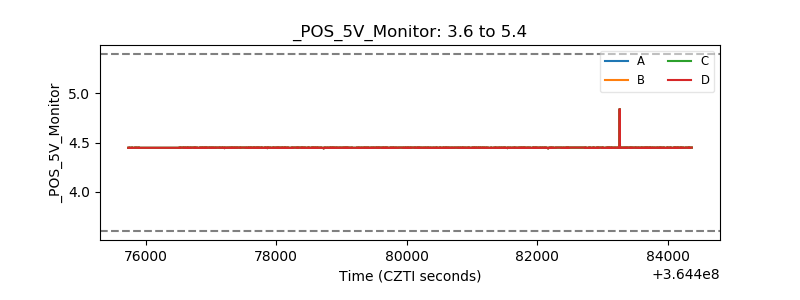 |
| _ROLL_ROT | 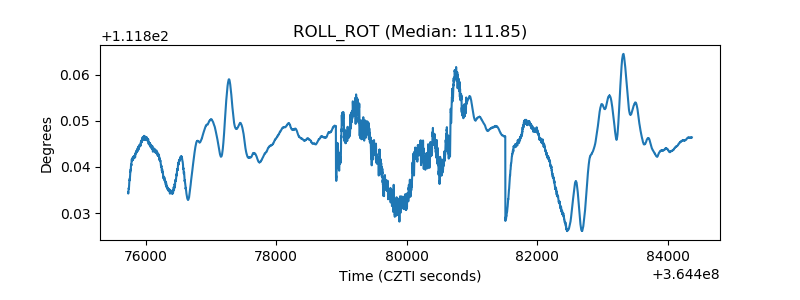 |
| _Roll_DEC | 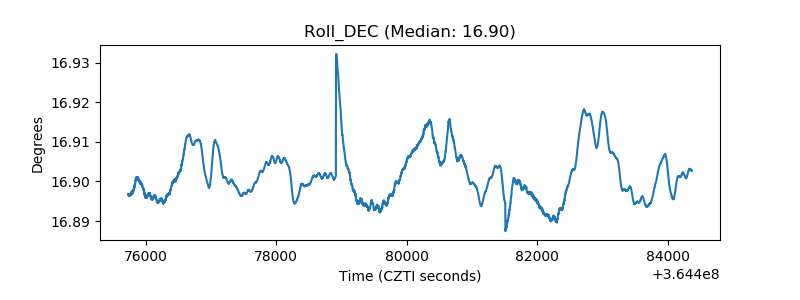 |
| _Roll_RA | 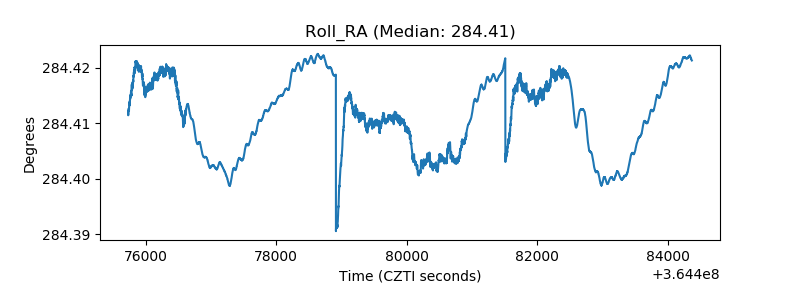 |
| Veto Counter | 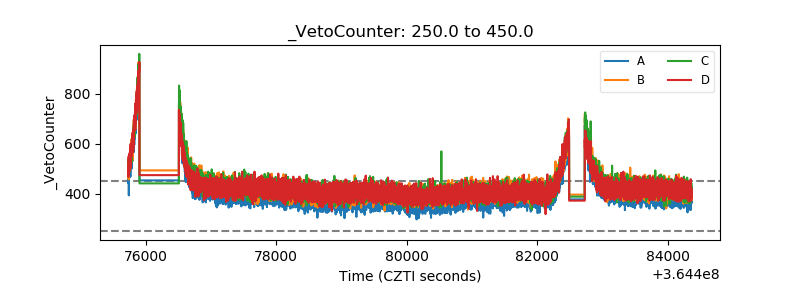 |