| Param | Original file | Final file |
|---|---|---|
| Filename | modeM0/AS1T04_026T01_9000004560_31416cztM0_level2.evt | modeM0/AS1T04_026T01_9000004560_31416cztM0_level2_quad_clean.evt |
| Size (bytes) | 653,224,320 | 93,977,280 |
| Size | 623.0 MB | 89.6 MB |
| Events in quadrant A | 3,799,532 | 592,604 |
| Events in quadrant B | 5,954,537 | 592,724 |
| Events in quadrant C | 4,699,345 | 564,011 |
| Events in quadrant D | 4,804,346 | 557,187 |
| Mode SS | |||
|---|---|---|---|
| Quadrant | BADHDUFLAG | Total packets | Discarded packets |
| A | 0 | 156 | 0 |
| B | 0 | 156 | 0 |
| C | 0 | 156 | 0 |
| D | 0 | 156 | 0 |
| Mode M0 | |||
|---|---|---|---|
| Quadrant | BADHDUFLAG | Total packets | Discarded packets |
| A | 0 | 16143 | 0 |
| B | 0 | 23643 | 0 |
| C | 0 | 18726 | 0 |
| D | 0 | 19126 | 0 |
| Quadrant | Total seconds | Saturated seconds | Saturation percentage |
|---|---|---|---|
| A | 7753 | 258 | 3.327744% |
| B | 7753 | 385 | 4.965820% |
| C | 7753 | 529 | 6.823165% |
| D | 7754 | 304 | 3.920557% |
Noise dominated data is calculated using 1-second bins in cleaned event files. If a bin has >2000 counts, and if more than 50% of those come from <1% of pixels, then it is considered to be noise-dominated and hence unusable.
| Quadrant | # 1 sec bins | Bins with >0 counts | Bins with >2000 counts | High rate bins dominated by noise | Noise dominated (total time) | Noise dominated (detector-on time) | Marked lightcurve |
|---|---|---|---|---|---|---|---|
| A | 7753 | 7753 | 0 | 0 | 0.00% | 0.00% | 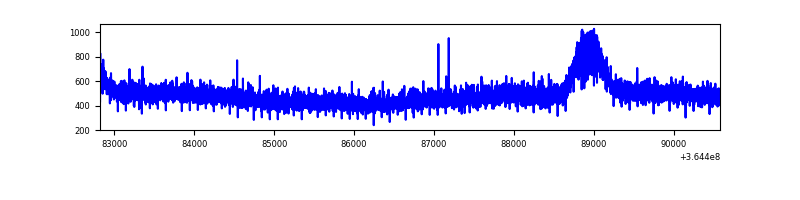 |
| B | 7753 | 7753 | 0 | 0 | 0.00% | 0.00% | 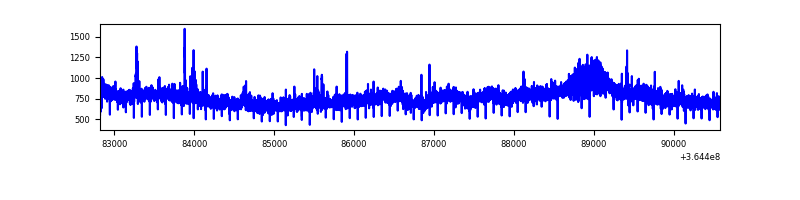 |
| C | 7753 | 7753 | 102 | 102 | 1.32% | 1.32% | 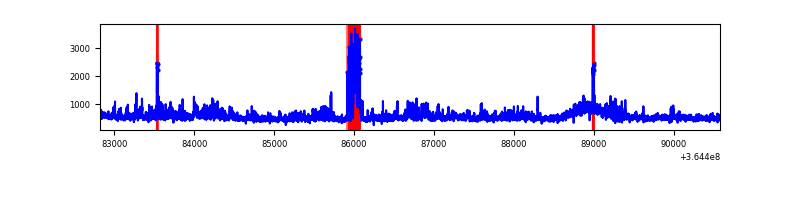 |
| D | 7754 | 7754 | 60 | 60 | 0.77% | 0.77% | 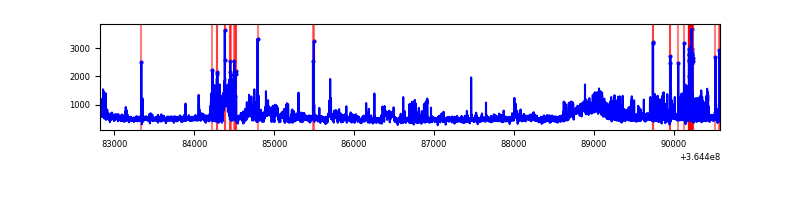 |
Top three noisy pixels from each quadrant. If the there are fewer than three noisy pixels in the level2.evt file, extra rows are filled as -1
| Pixel properties | Quadrant properties | ||||||
|---|---|---|---|---|---|---|---|
| Quadrant | DetID | PixID | Counts | Sigma | Mean | Median | Sigma |
| A | 13 | 254 | 12212 | 56.8 | 985 | 962 | 198.1 |
| A | 3 | 137 | 10785 | 49.6 | 985 | 962 | 198.1 |
| A | 0 | 226 | 8305 | 37.08 | 985 | 962 | 198.1 |
| B | 6 | 159 | 2106346 | 11303.38 | 959 | 931 | 186.3 |
| B | 0 | 190 | 46774 | 246.12 | 959 | 931 | 186.3 |
| B | 12 | 111 | 24333 | 125.64 | 959 | 931 | 186.3 |
| C | 3 | 233 | 519935 | 2349.03 | 930 | 935 | 220.9 |
| C | 10 | 22 | 337573 | 1523.65 | 930 | 935 | 220.9 |
| C | 14 | 238 | 169541 | 763.12 | 930 | 935 | 220.9 |
| D | 8 | 195 | 942812 | 4117.09 | 954 | 927 | 228.8 |
| D | 12 | 218 | 171831 | 747.04 | 954 | 927 | 228.8 |
| D | 2 | 250 | 76985 | 332.46 | 954 | 927 | 228.8 |
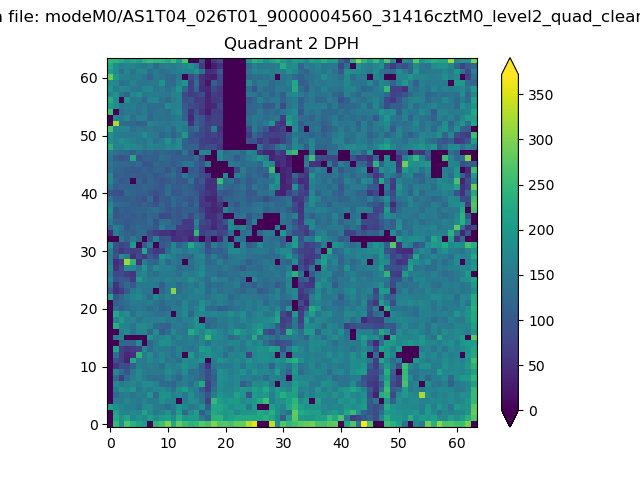
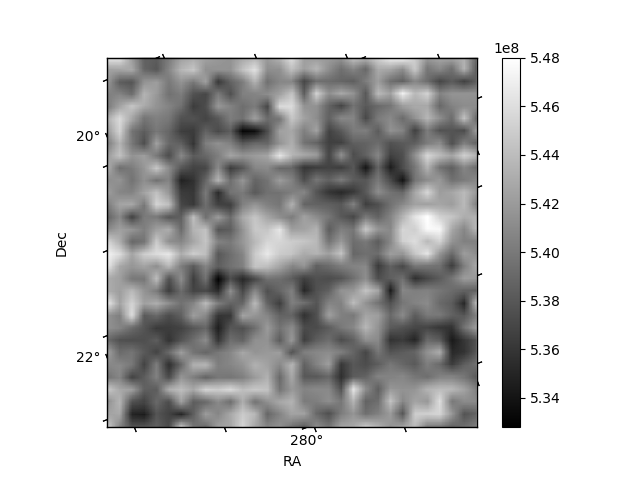
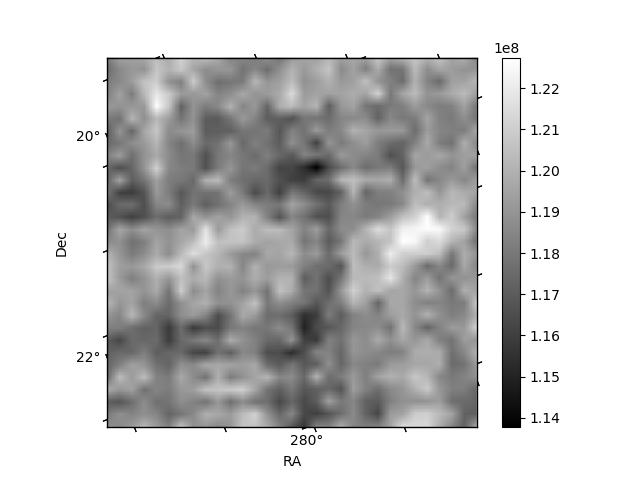
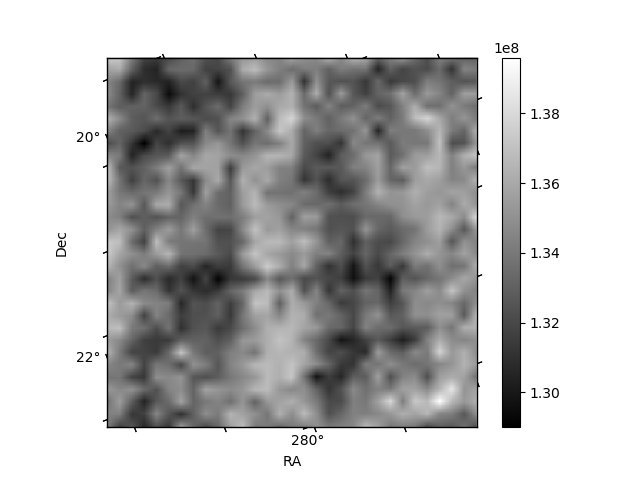
Histogram calculated using DETX and DETY for each event in the final _common_clean file
| Quadrant A | 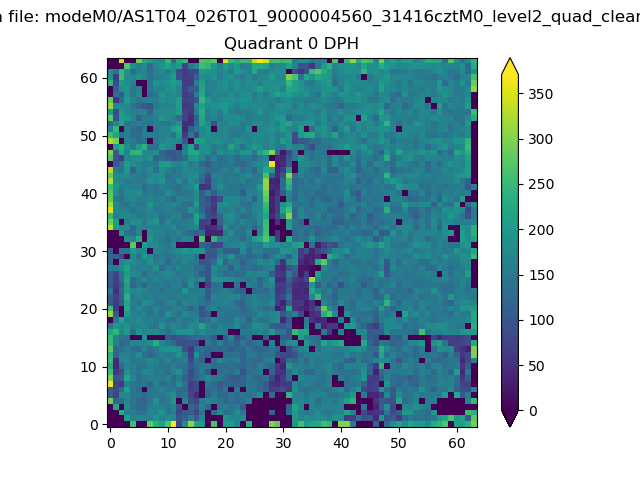 |
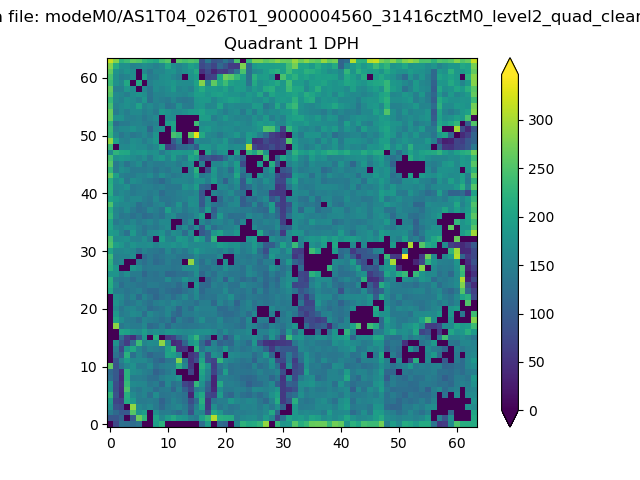 |
Quadrant B |
|---|---|---|---|
| Quadrant D | 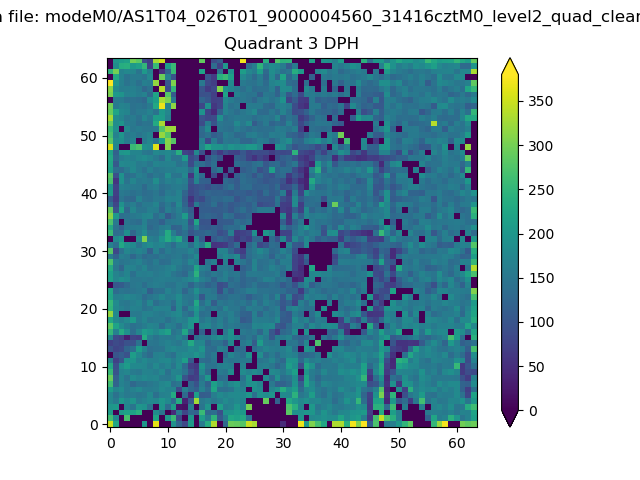 |
 |
Quadrant C |
| Plot type | Count rate plots | Images |
|---|---|---|
| Comparison with Poisson distribution Blue bars denote a histogram of data divided into 1 sec bins. Red curve is a Poisson curve with rate = median count rate of data. |
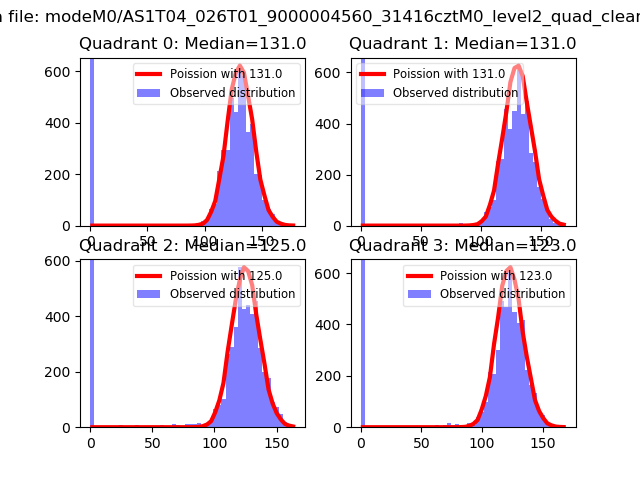 |
 |
| Quadrant-wise count rates Data is divided into 100 sec bins |
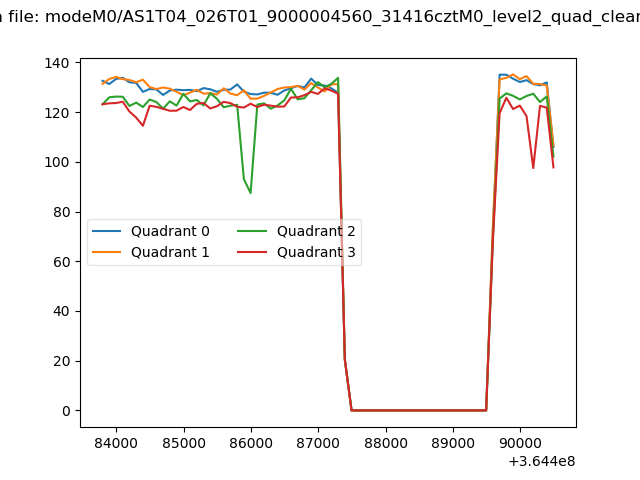 |
|
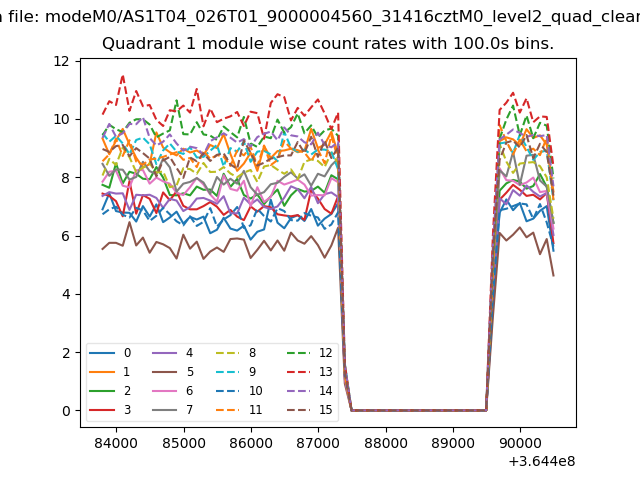
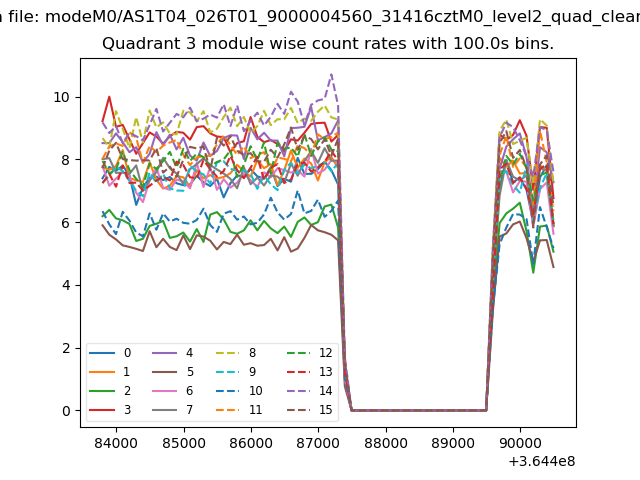
| Module-wise count rates for Quadrant A Data is divided into 100 sec bins |
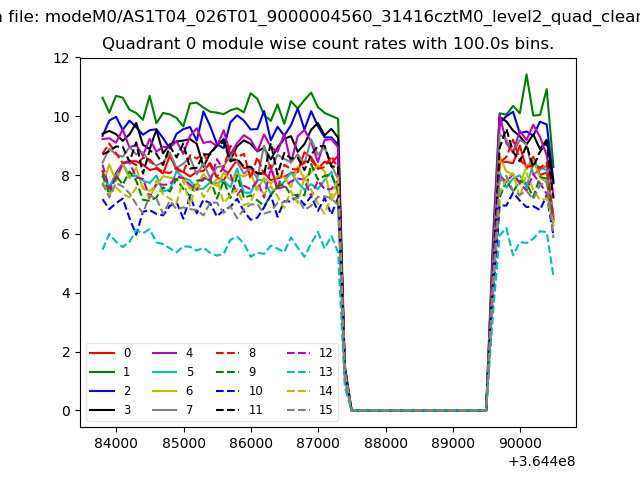 |
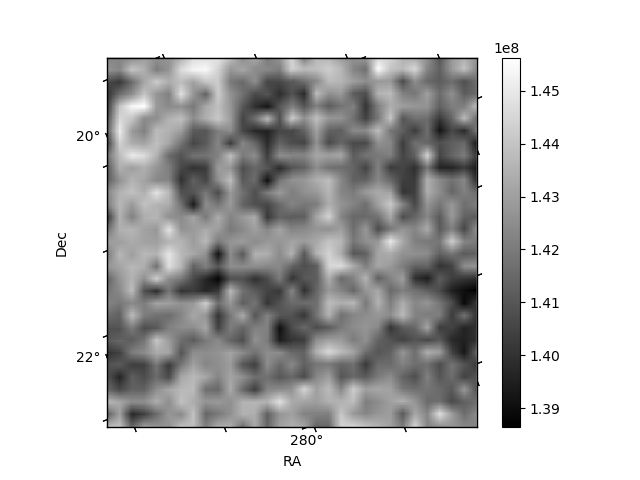 |
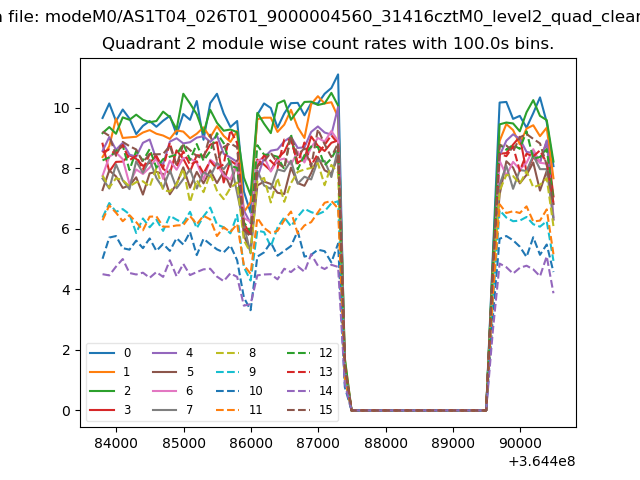
| Module-wise count rates for Quadrant B Data is divided into 100 sec bins |
 |
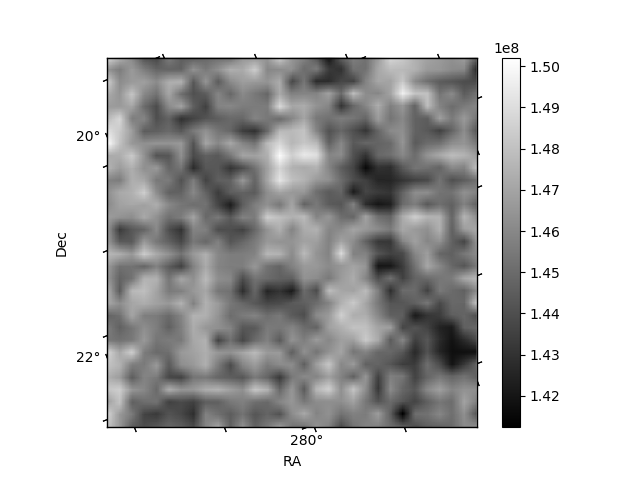 |
| Module-wise count rates for Quadrant C Data is divided into 100 sec bins |
 |
 |
| Module-wise count rates for Quadrant D Data is divided into 100 sec bins |
 |
 |
| Parameter | Plot |
|---|---|
| CZT HV Monitor |  |
| D_VDD | 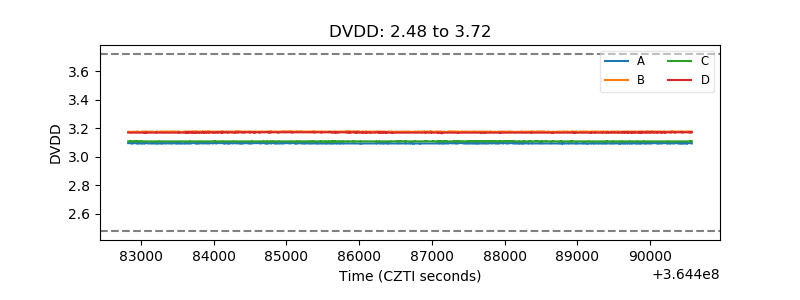 |
| Temperature 1 | 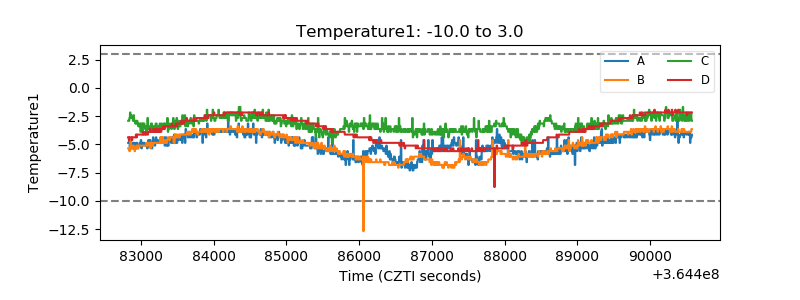 |
| Veto HV Monitor | 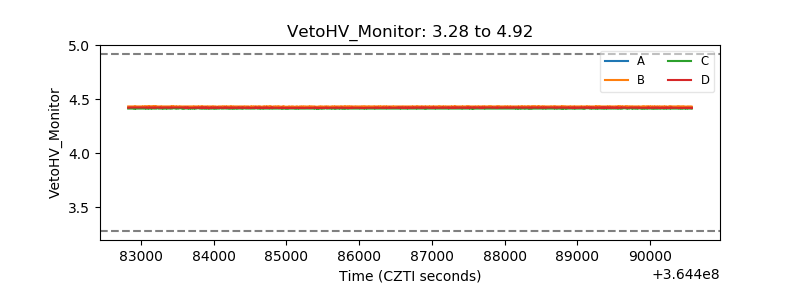 |
| Veto LLD | 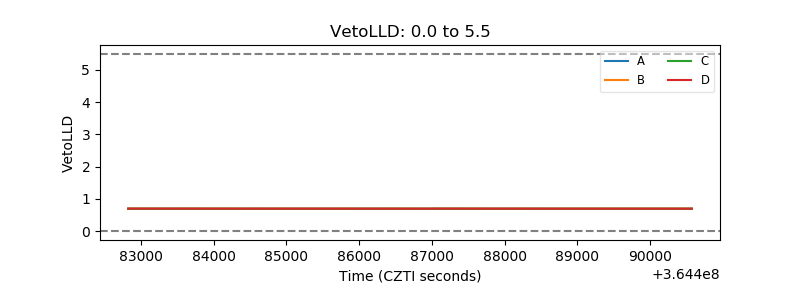 |
| Alpha Counter | 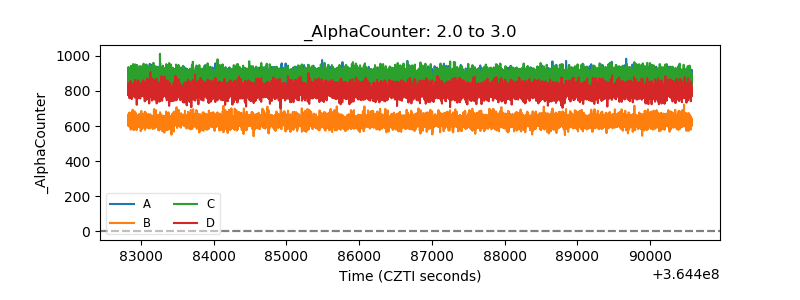 |
| _CPM_Rate | 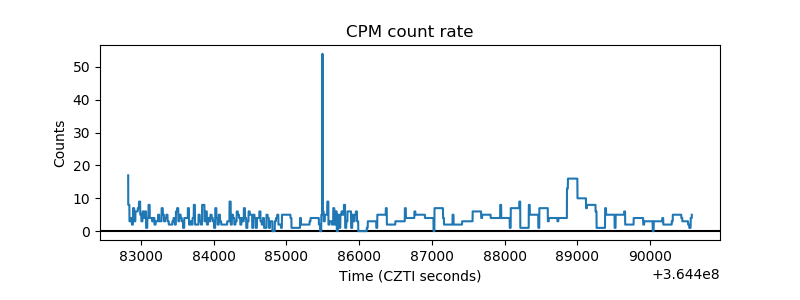 |
| CZT Counter | 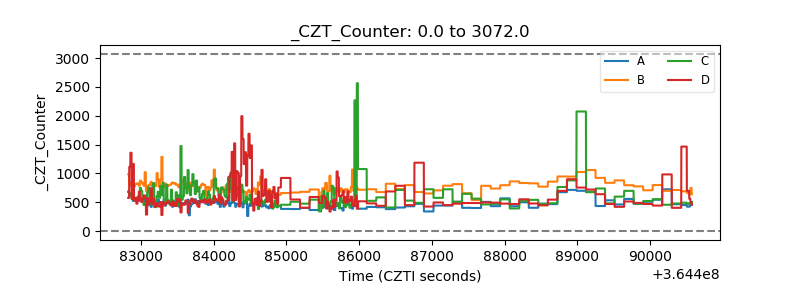 |
| +2.5 Volts monitor |  |
| +5 Volts monitor |  |
| _ROLL_ROT | 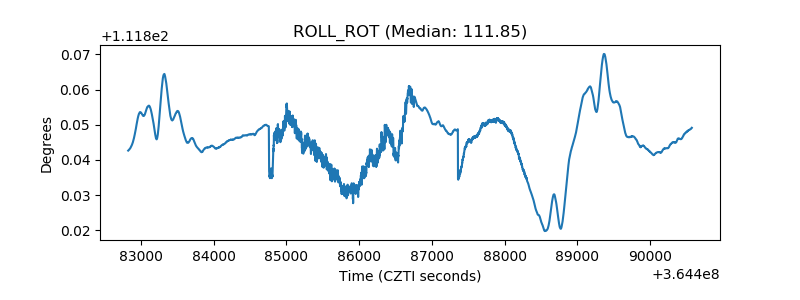 |
| _Roll_DEC | 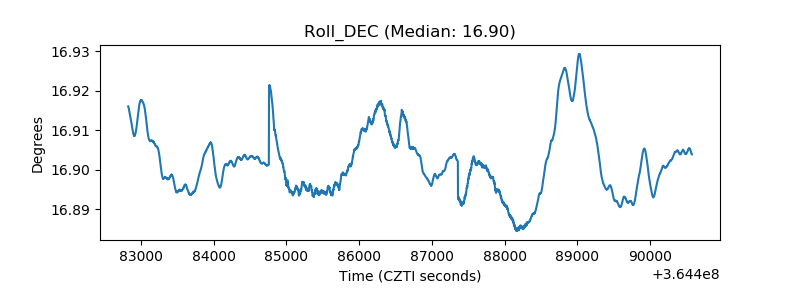 |
| _Roll_RA | 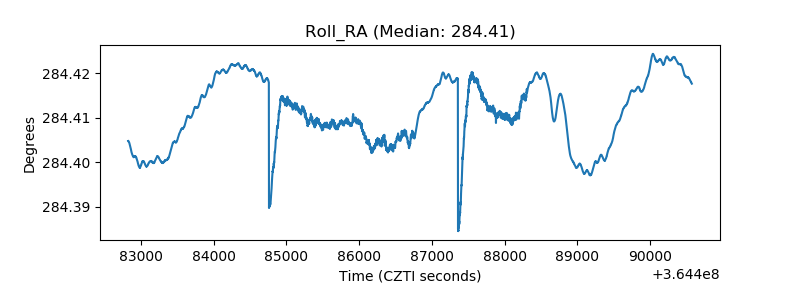 |
| Veto Counter | 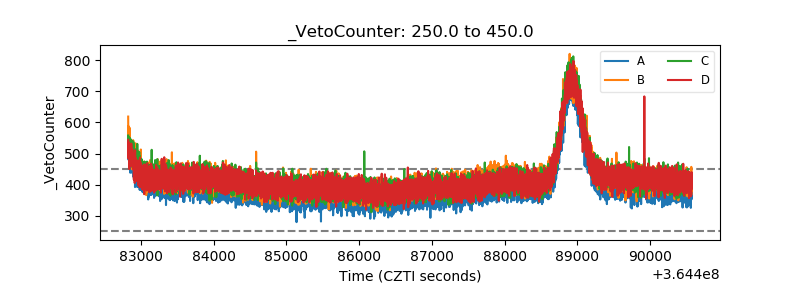 |