| Param | Original file | Final file |
|---|---|---|
| Filename | modeM0/AS1T04_026T01_9000004560_31417cztM0_level2.evt | modeM0/AS1T04_026T01_9000004560_31417cztM0_level2_quad_clean.evt |
| Size (bytes) | 171,990,720 | 40,838,400 |
| Size | 164.0 MB | 38.9 MB |
| Events in quadrant A | 1,001,505 | 276,973 |
| Events in quadrant B | 1,541,709 | 278,167 |
| Events in quadrant C | 1,138,737 | 265,482 |
| Events in quadrant D | 1,375,512 | 257,247 |
| Mode SS | |||
|---|---|---|---|
| Quadrant | BADHDUFLAG | Total packets | Discarded packets |
| A | 0 | 44 | 0 |
| B | 0 | 44 | 0 |
| C | 0 | 44 | 0 |
| D | 0 | 44 | 0 |
| Mode M0 | |||
|---|---|---|---|
| Quadrant | BADHDUFLAG | Total packets | Discarded packets |
| A | 0 | 4392 | 0 |
| B | 0 | 6542 | 2 |
| C | 0 | 4683 | 0 |
| D | 0 | 5447 | 0 |
| Quadrant | Total seconds | Saturated seconds | Saturation percentage |
|---|---|---|---|
| A | 2192 | 0 | 0.000000% |
| B | 2192 | 3 | 0.136861% |
| C | 2192 | 46 | 2.098540% |
| D | 2192 | 54 | 2.463504% |
Noise dominated data is calculated using 1-second bins in cleaned event files. If a bin has >2000 counts, and if more than 50% of those come from <1% of pixels, then it is considered to be noise-dominated and hence unusable.
| Quadrant | # 1 sec bins | Bins with >0 counts | Bins with >2000 counts | High rate bins dominated by noise | Noise dominated (total time) | Noise dominated (detector-on time) | Marked lightcurve |
|---|---|---|---|---|---|---|---|
| A | 2192 | 2192 | 0 | 0 | 0.00% | 0.00% | 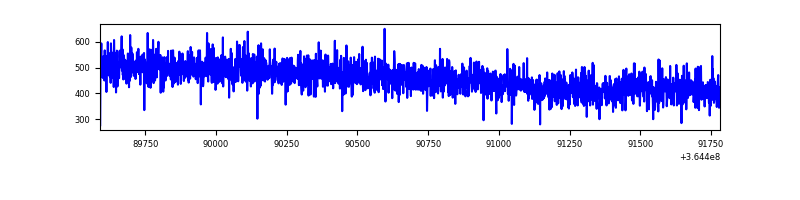 |
| B | 2192 | 2192 | 0 | 0 | 0.00% | 0.00% | 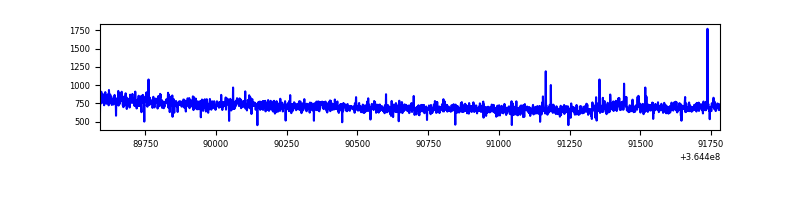 |
| C | 2192 | 2192 | 1 | 1 | 0.05% | 0.05% | 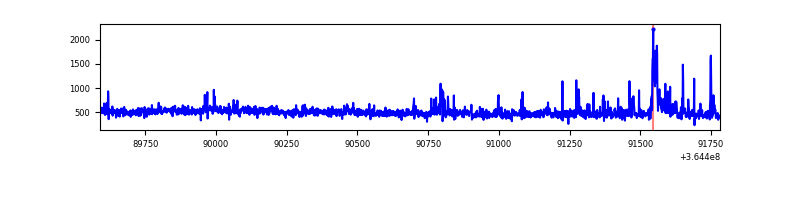 |
| D | 2192 | 2192 | 45 | 45 | 2.05% | 2.05% | 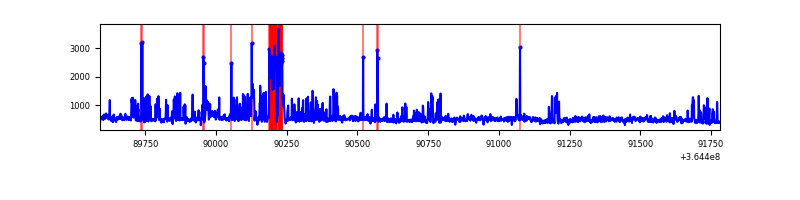 |
Top three noisy pixels from each quadrant. If the there are fewer than three noisy pixels in the level2.evt file, extra rows are filled as -1
| Pixel properties | Quadrant properties | ||||||
|---|---|---|---|---|---|---|---|
| Quadrant | DetID | PixID | Counts | Sigma | Mean | Median | Sigma |
| A | 13 | 254 | 3563 | 61.32 | 259 | 254 | 54.0 |
| A | 3 | 137 | 2732 | 45.92 | 259 | 254 | 54.0 |
| A | 0 | 226 | 2159 | 35.3 | 259 | 254 | 54.0 |
| B | 6 | 159 | 525412 | 10365.88 | 254 | 247 | 50.7 |
| B | 0 | 190 | 8936 | 171.51 | 254 | 247 | 50.7 |
| B | 12 | 111 | 6177 | 117.05 | 254 | 247 | 50.7 |
| C | 14 | 238 | 57042 | 934.64 | 251 | 252 | 60.8 |
| C | 10 | 22 | 42354 | 692.91 | 251 | 252 | 60.8 |
| C | 3 | 233 | 31137 | 508.3 | 251 | 252 | 60.8 |
| D | 8 | 195 | 259999 | 4230.47 | 253 | 246 | 61.4 |
| D | 12 | 218 | 120473 | 1958.08 | 253 | 246 | 61.4 |
| D | 2 | 250 | 26292 | 424.2 | 253 | 246 | 61.4 |
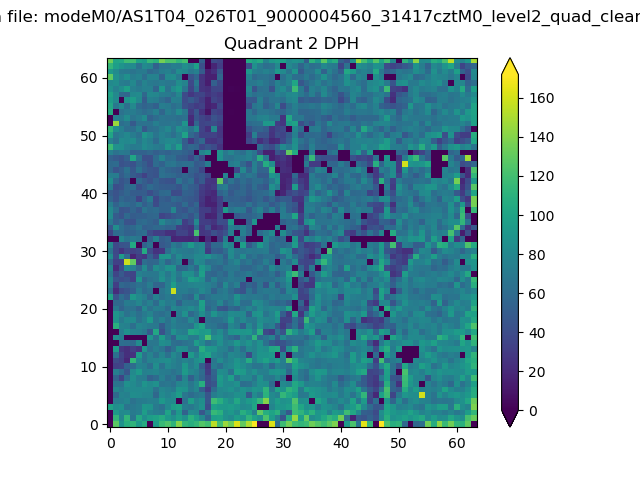
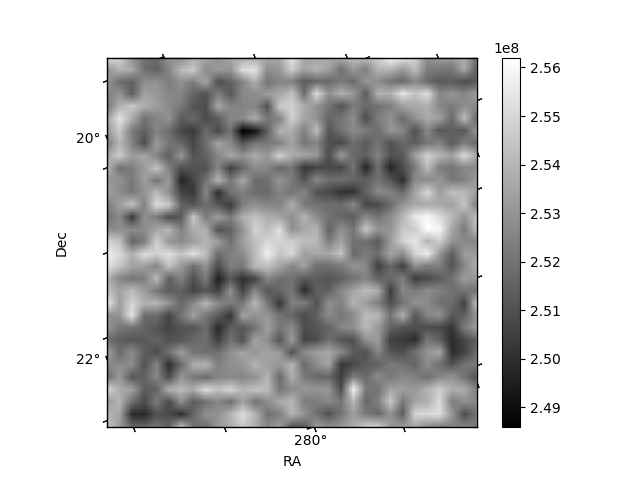
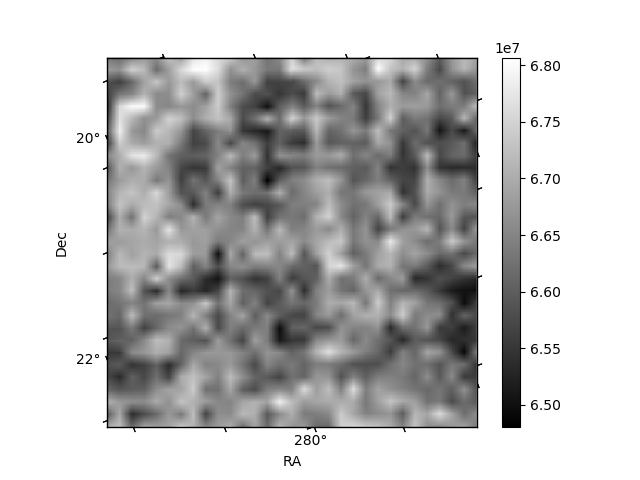
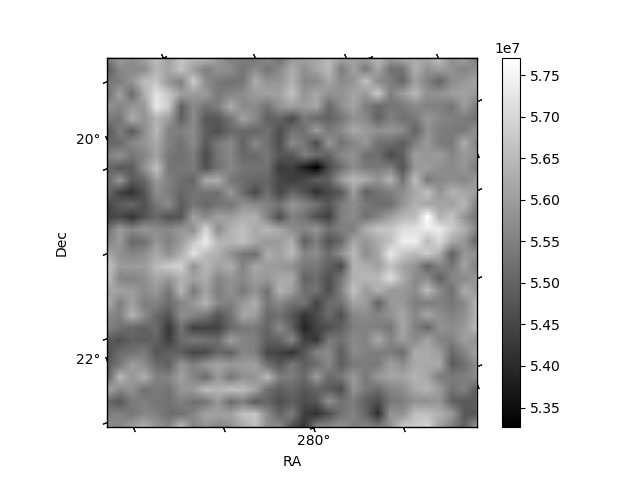
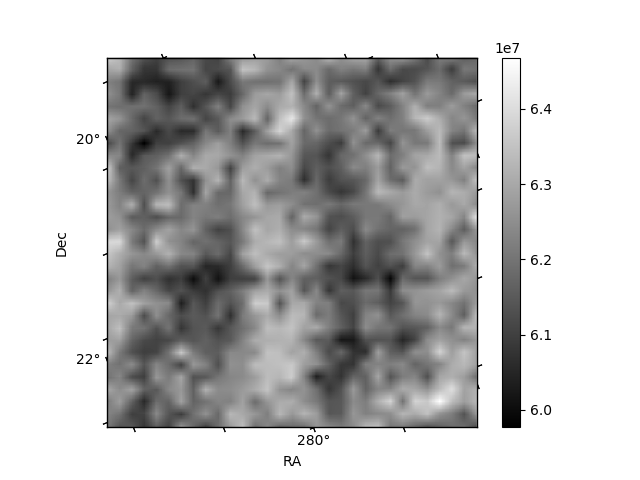
Histogram calculated using DETX and DETY for each event in the final _common_clean file
| Quadrant A | 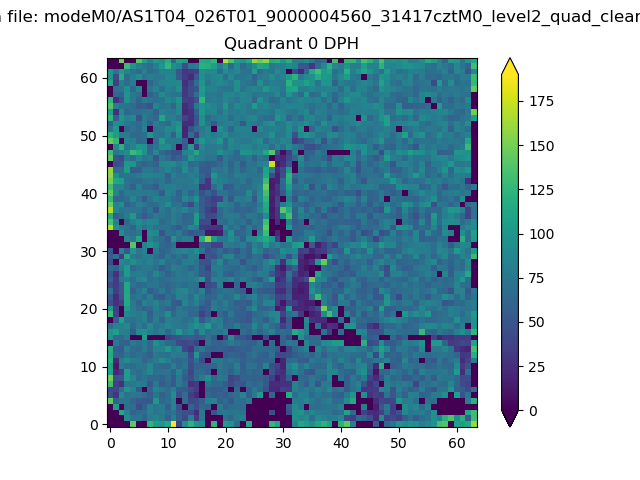 |
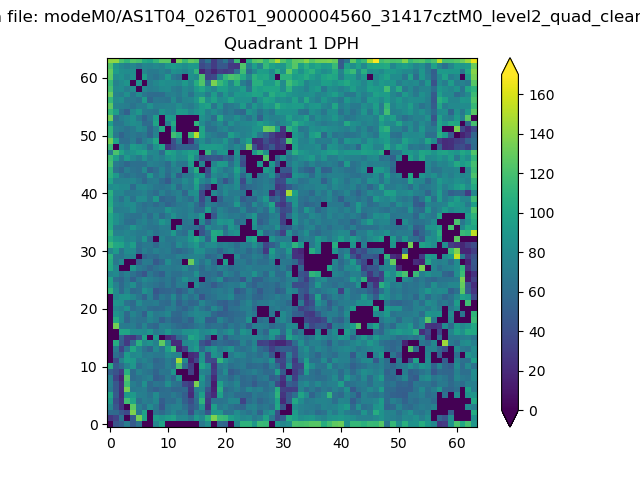 |
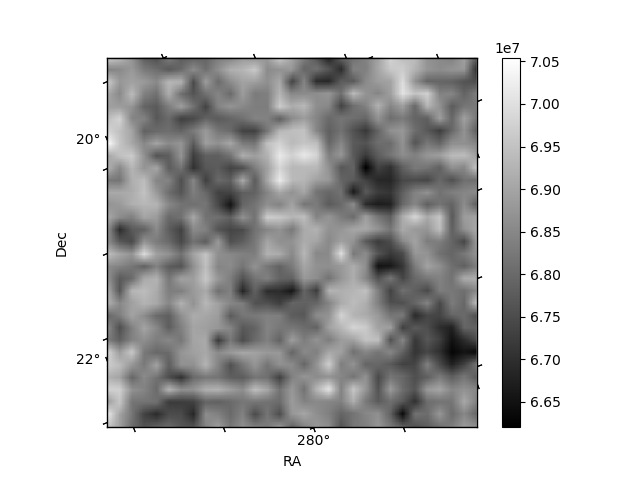
Quadrant B |
|---|---|---|---|
| Quadrant D | 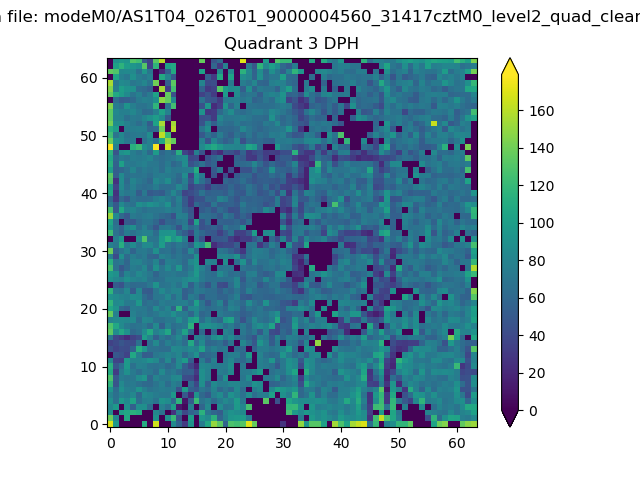 |
 |
Quadrant C |
| Plot type | Count rate plots | Images |
|---|---|---|
| Comparison with Poisson distribution Blue bars denote a histogram of data divided into 1 sec bins. Red curve is a Poisson curve with rate = median count rate of data. |
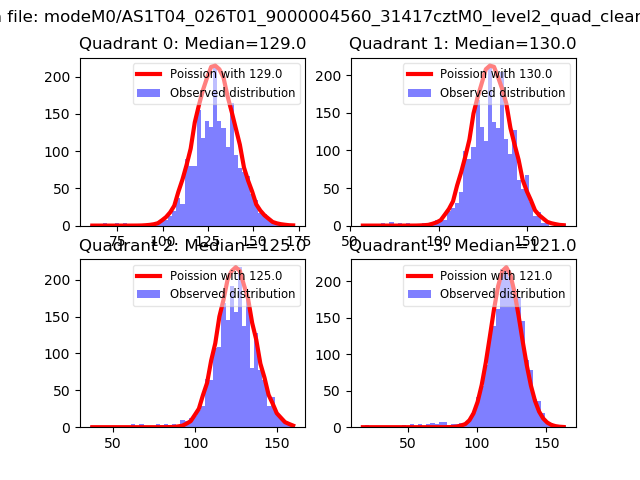 |
 |
| Quadrant-wise count rates Data is divided into 100 sec bins |
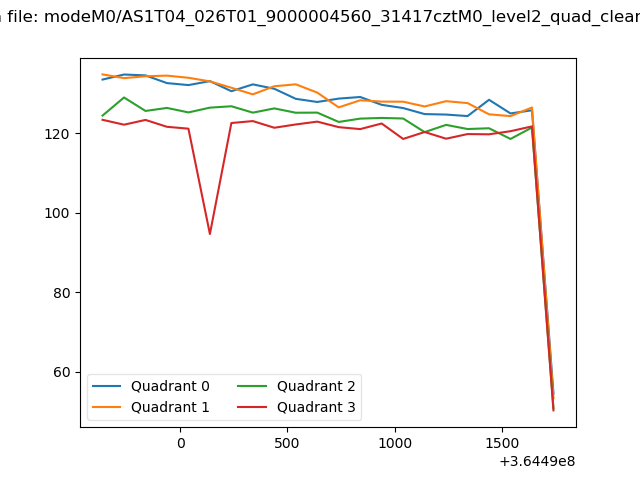 |
|
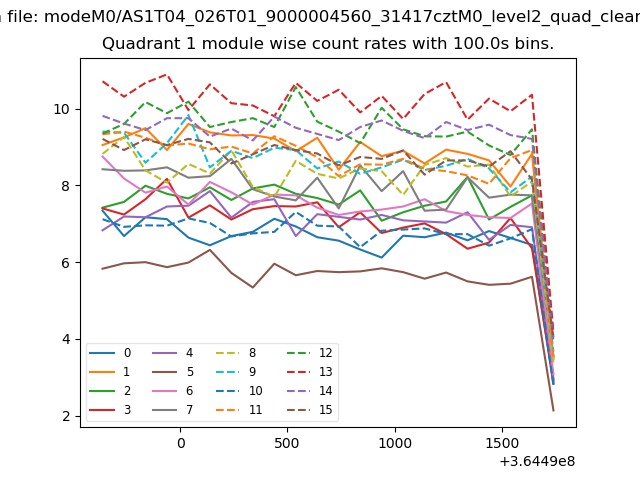
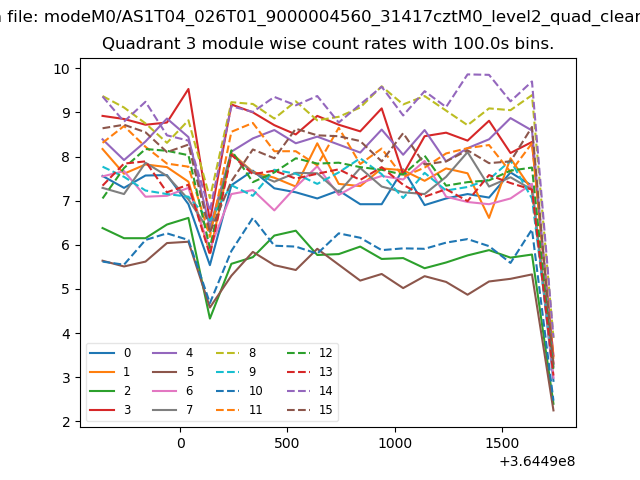
| Module-wise count rates for Quadrant A Data is divided into 100 sec bins |
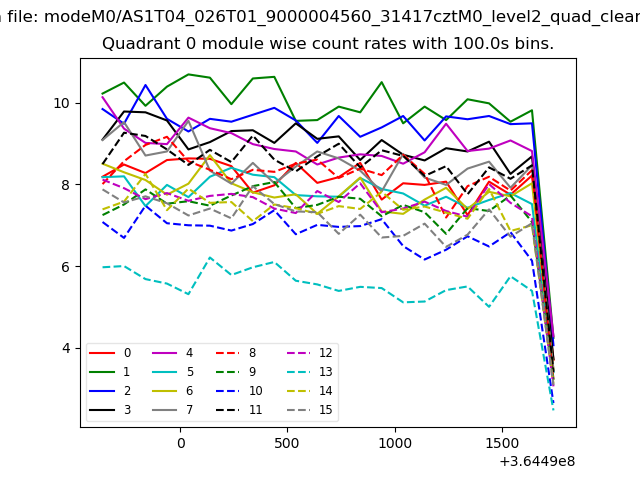 |
 |
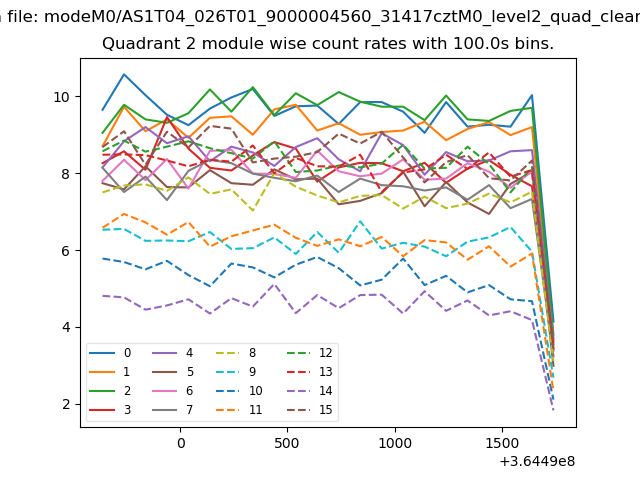
| Module-wise count rates for Quadrant B Data is divided into 100 sec bins |
 |
 |
| Module-wise count rates for Quadrant C Data is divided into 100 sec bins |
 |
 |
| Module-wise count rates for Quadrant D Data is divided into 100 sec bins |
 |
 |
| Parameter | Plot |
|---|---|
| CZT HV Monitor | 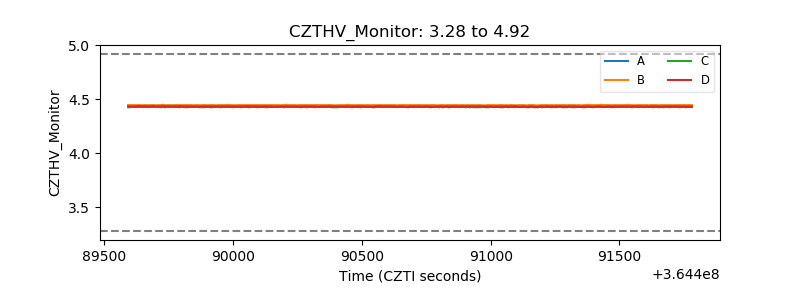 |
| D_VDD | 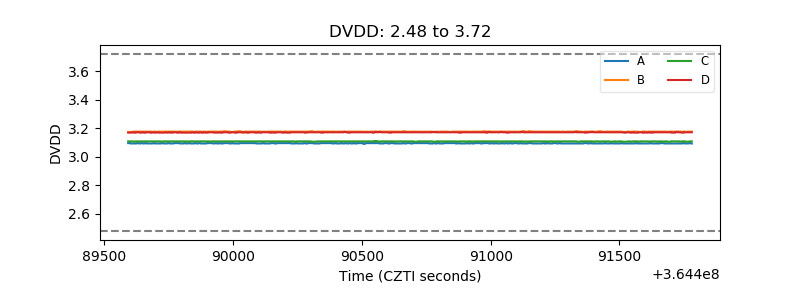 |
| Temperature 1 | 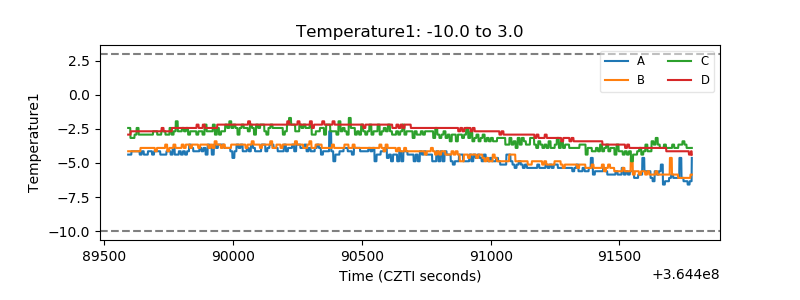 |
| Veto HV Monitor | 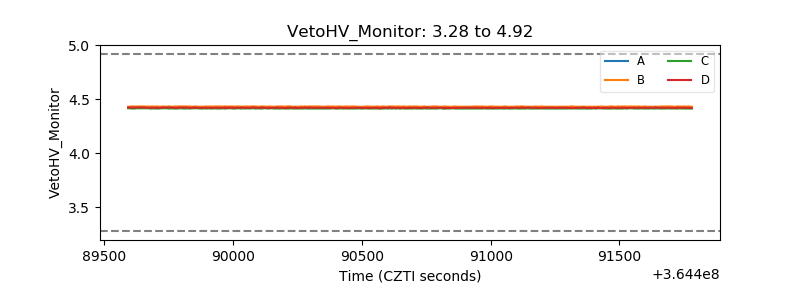 |
| Veto LLD | 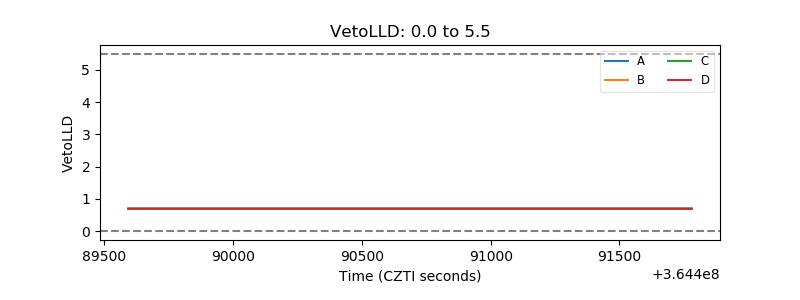 |
| Alpha Counter | 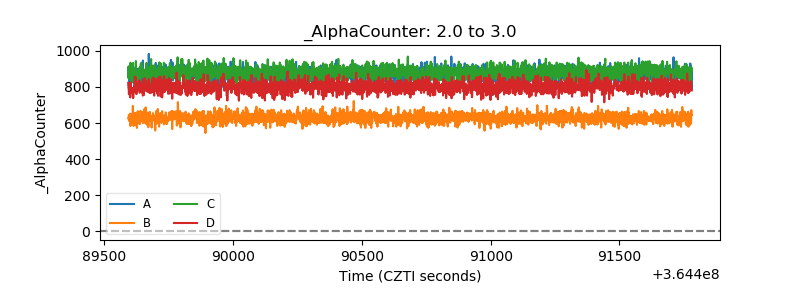 |
| _CPM_Rate | 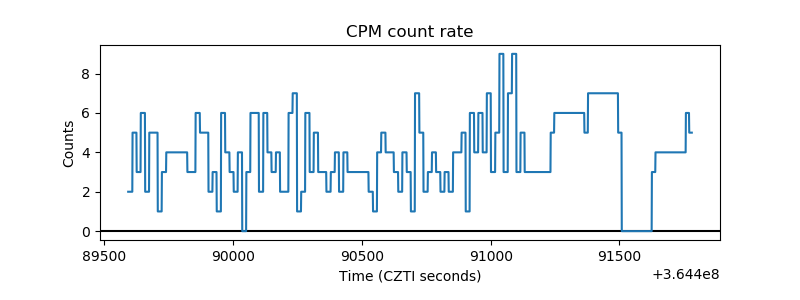 |
| CZT Counter | 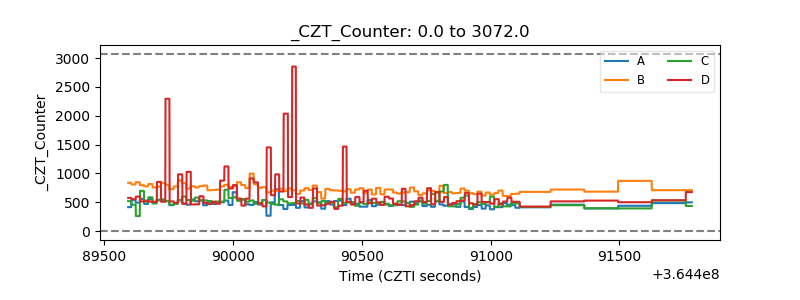 |
| +2.5 Volts monitor |  |
| +5 Volts monitor |  |
| _ROLL_ROT | 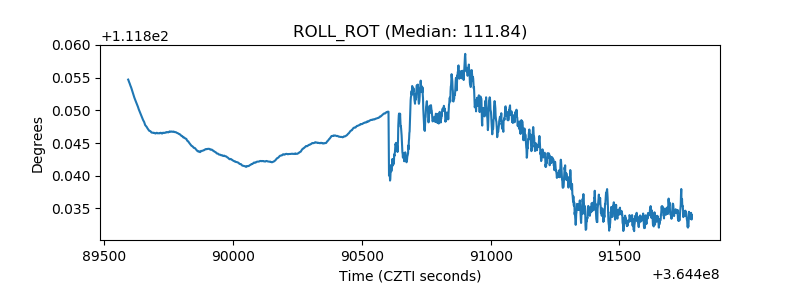 |
| _Roll_DEC | 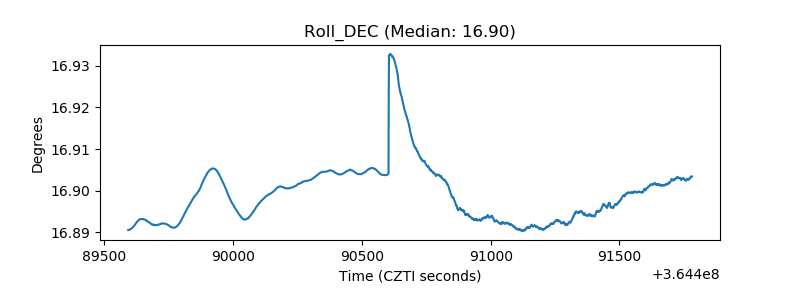 |
| _Roll_RA | 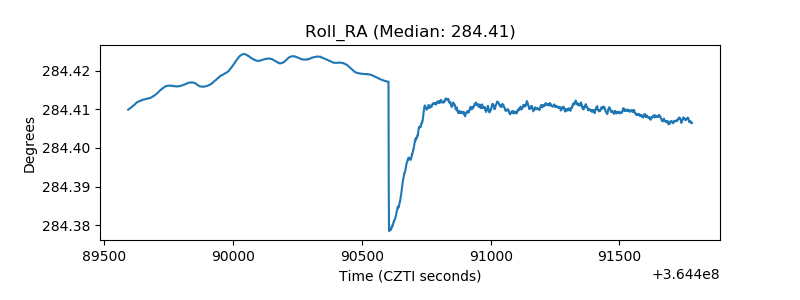 |
| Veto Counter | 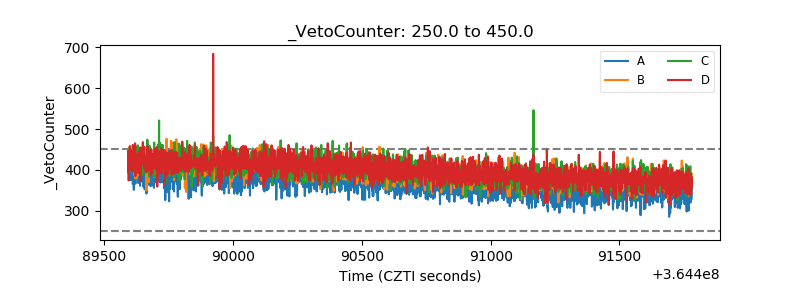 |