| Param | Original file | Final file |
|---|---|---|
| Filename | modeM0/AS1T04_026T01_9000004560_31419cztM0_level2.evt | modeM0/AS1T04_026T01_9000004560_31419cztM0_level2_quad_clean.evt |
| Size (bytes) | 585,593,280 | 108,267,840 |
| Size | 558.5 MB | 103.3 MB |
| Events in quadrant A | 3,426,605 | 705,745 |
| Events in quadrant B | 5,487,705 | 707,413 |
| Events in quadrant C | 3,904,850 | 681,067 |
| Events in quadrant D | 4,413,956 | 669,600 |
| Mode SS | |||
|---|---|---|---|
| Quadrant | BADHDUFLAG | Total packets | Discarded packets |
| A | 0 | 148 | 0 |
| B | 0 | 148 | 0 |
| C | 0 | 148 | 0 |
| D | 0 | 148 | 0 |
| Mode M9 | |||
|---|---|---|---|
| Quadrant | BADHDUFLAG | Total packets | Discarded packets |
| A | 0 | 4 | 0 |
| B | 0 | 4 | 0 |
| C | 0 | 4 | 0 |
| D | 0 | 4 | 0 |
| Mode M0 | |||
|---|---|---|---|
| Quadrant | BADHDUFLAG | Total packets | Discarded packets |
| A | 0 | 15155 | 1 |
| B | 0 | 22405 | 1 |
| C | 0 | 16455 | 1 |
| D | 0 | 18021 | 1 |
| Quadrant | Total seconds | Saturated seconds | Saturation percentage |
|---|---|---|---|
| A | 7410 | 94 | 1.268556% |
| B | 7411 | 161 | 2.172446% |
| C | 7411 | 248 | 3.346377% |
| D | 7411 | 125 | 1.686682% |
Noise dominated data is calculated using 1-second bins in cleaned event files. If a bin has >2000 counts, and if more than 50% of those come from <1% of pixels, then it is considered to be noise-dominated and hence unusable.
| Quadrant | # 1 sec bins | Bins with >0 counts | Bins with >2000 counts | High rate bins dominated by noise | Noise dominated (total time) | Noise dominated (detector-on time) | Marked lightcurve |
|---|---|---|---|---|---|---|---|
| A | 7750 | 7410 | 0 | 0 | 0.00% | 0.00% | 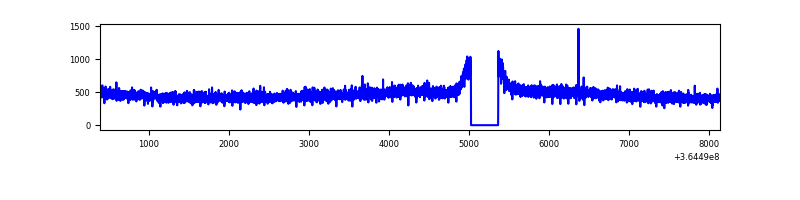 |
| B | 7751 | 7411 | 0 | 0 | 0.00% | 0.00% | 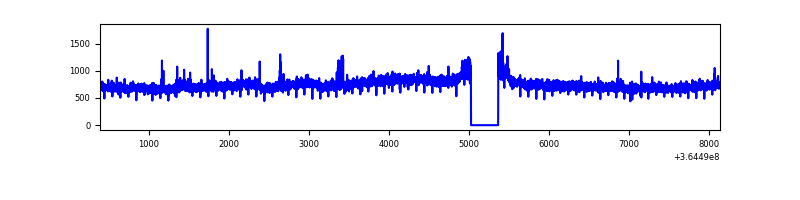 |
| C | 7751 | 7411 | 3 | 3 | 0.04% | 0.04% | 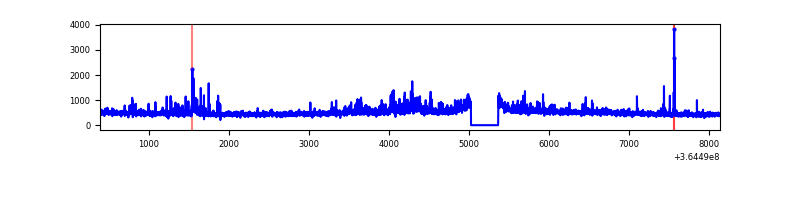 |
| D | 7751 | 7411 | 39 | 39 | 0.50% | 0.53% | 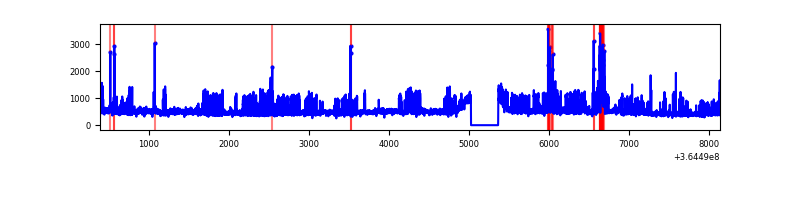 |
Top three noisy pixels from each quadrant. If the there are fewer than three noisy pixels in the level2.evt file, extra rows are filled as -1
| Pixel properties | Quadrant properties | ||||||
|---|---|---|---|---|---|---|---|
| Quadrant | DetID | PixID | Counts | Sigma | Mean | Median | Sigma |
| A | 13 | 254 | 11956 | 61.8 | 888 | 869 | 179.4 |
| A | 3 | 137 | 9427 | 47.71 | 888 | 869 | 179.4 |
| A | 0 | 226 | 7378 | 36.28 | 888 | 869 | 179.4 |
| B | 6 | 159 | 1986909 | 11745.51 | 874 | 851 | 169.1 |
| B | 0 | 190 | 37966 | 219.5 | 874 | 851 | 169.1 |
| B | 12 | 111 | 21509 | 122.17 | 874 | 851 | 169.1 |
| C | 3 | 233 | 279504 | 1374.93 | 855 | 861 | 202.7 |
| C | 14 | 238 | 165950 | 814.61 | 855 | 861 | 202.7 |
| C | 10 | 22 | 69889 | 340.61 | 855 | 861 | 202.7 |
| D | 8 | 195 | 903329 | 4354.04 | 868 | 846 | 207.3 |
| D | 12 | 218 | 168841 | 810.49 | 868 | 846 | 207.3 |
| D | 2 | 250 | 38573 | 182.01 | 868 | 846 | 207.3 |
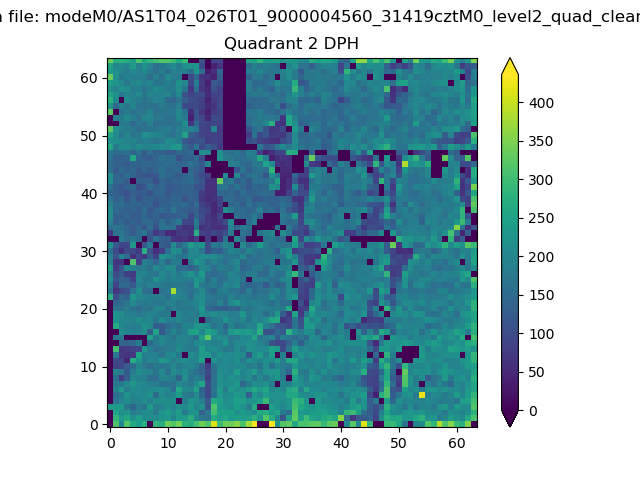
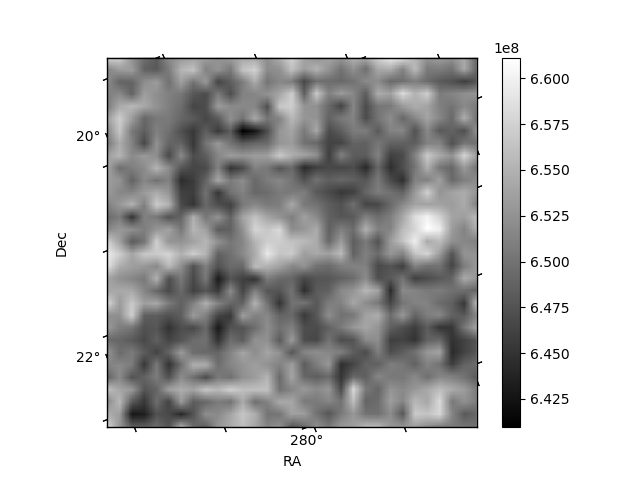
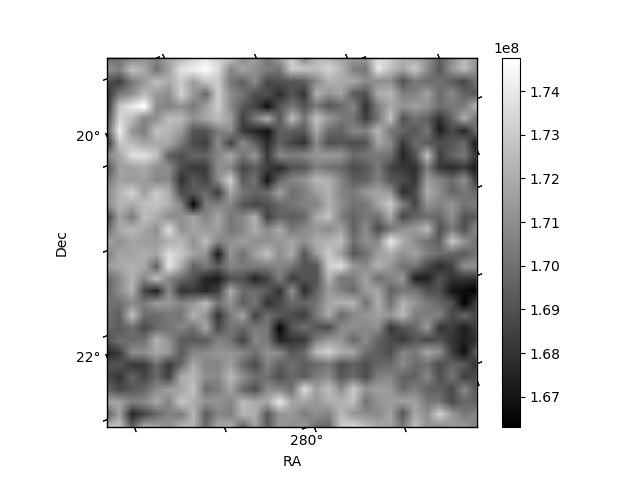
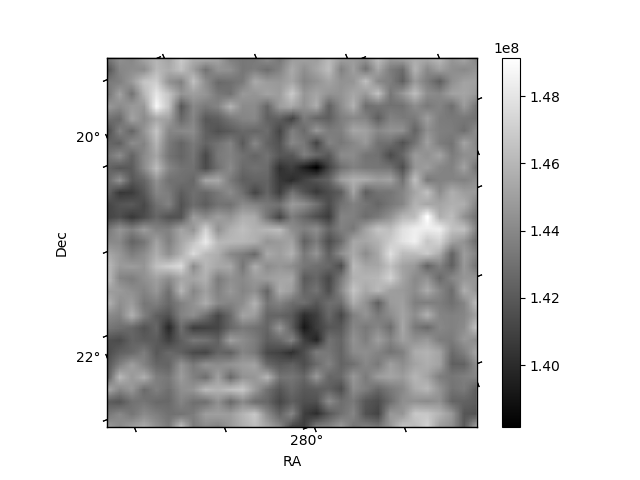
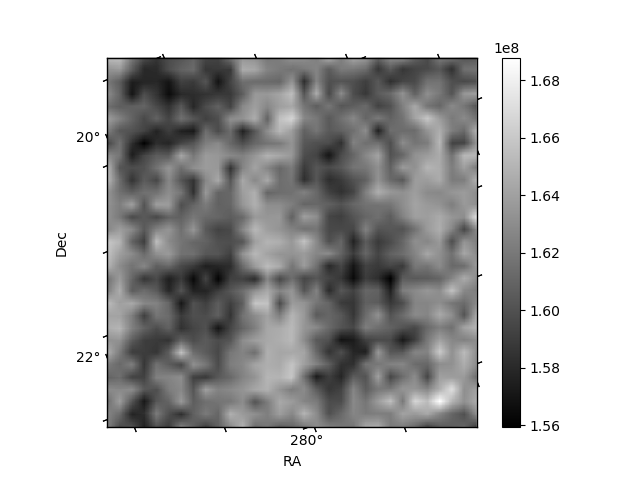
Histogram calculated using DETX and DETY for each event in the final _common_clean file
| Quadrant A | 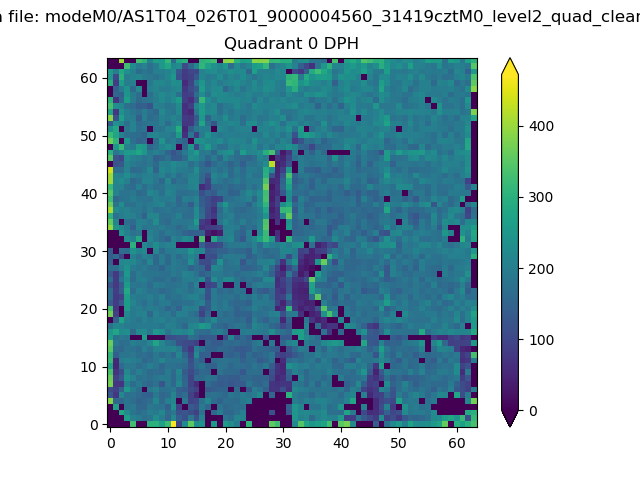 |
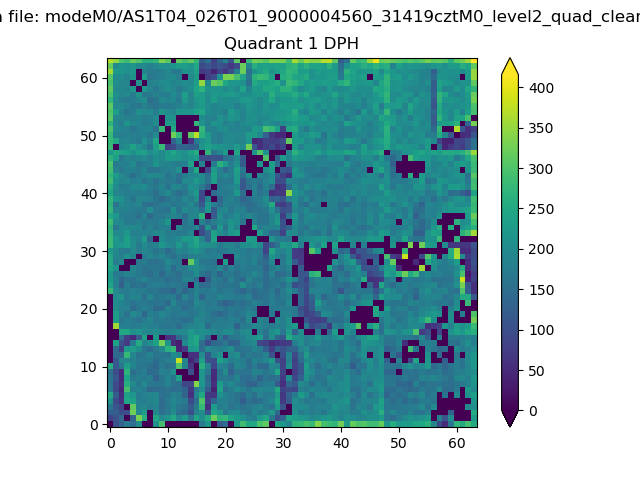 |
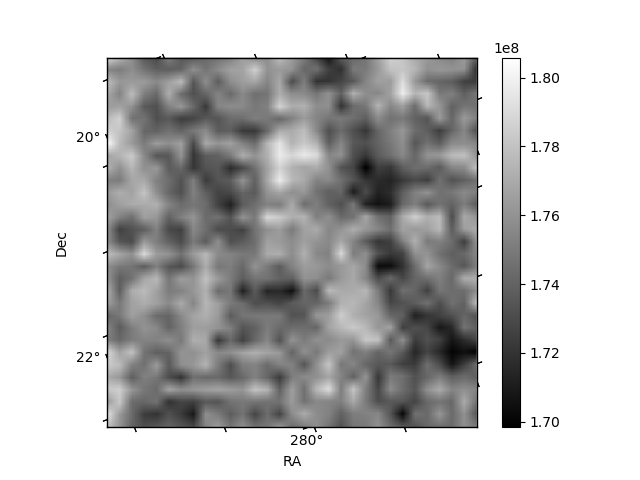
Quadrant B |
|---|---|---|---|
| Quadrant D | 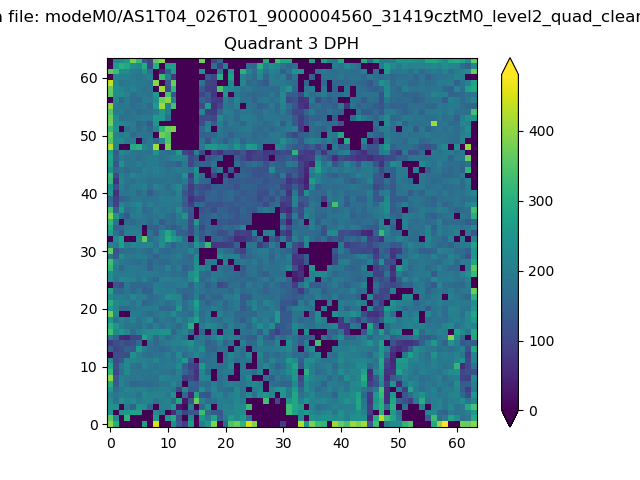 |
 |
Quadrant C |
| Plot type | Count rate plots | Images |
|---|---|---|
| Comparison with Poisson distribution Blue bars denote a histogram of data divided into 1 sec bins. Red curve is a Poisson curve with rate = median count rate of data. |
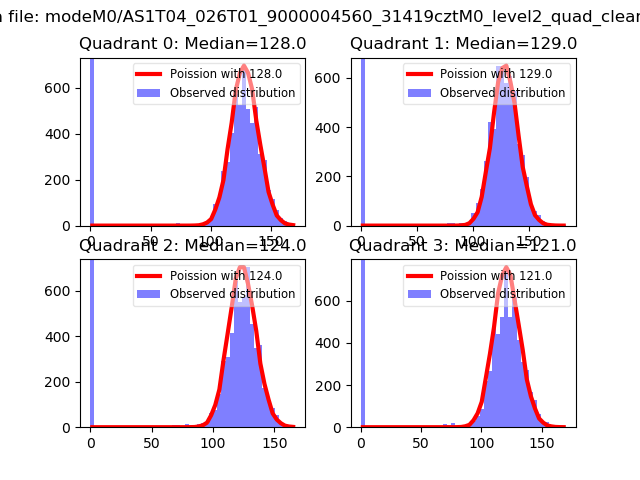 |
 |
| Quadrant-wise count rates Data is divided into 100 sec bins |
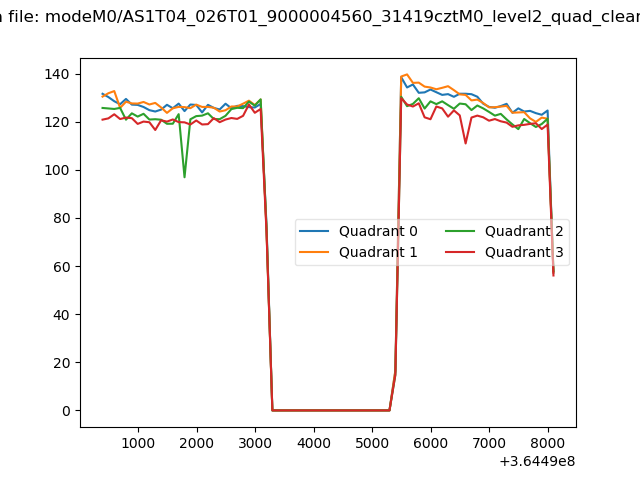 |
|
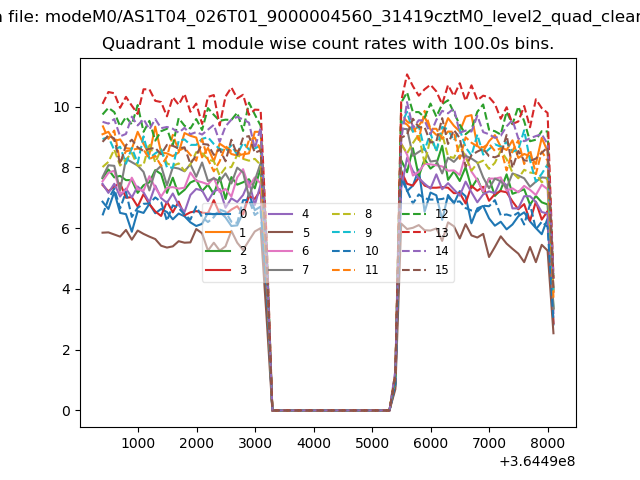
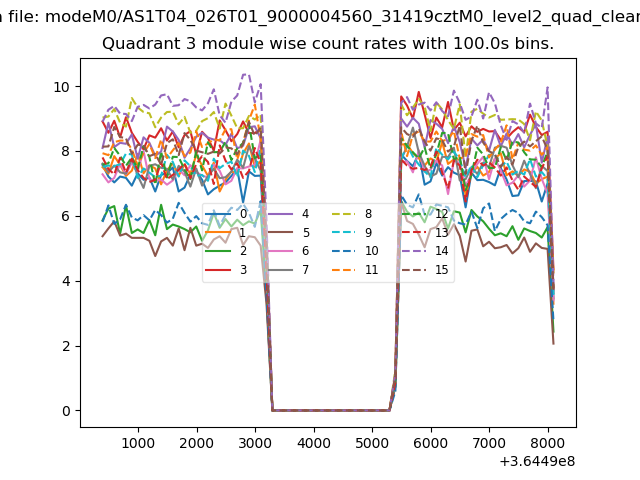
| Module-wise count rates for Quadrant A Data is divided into 100 sec bins |
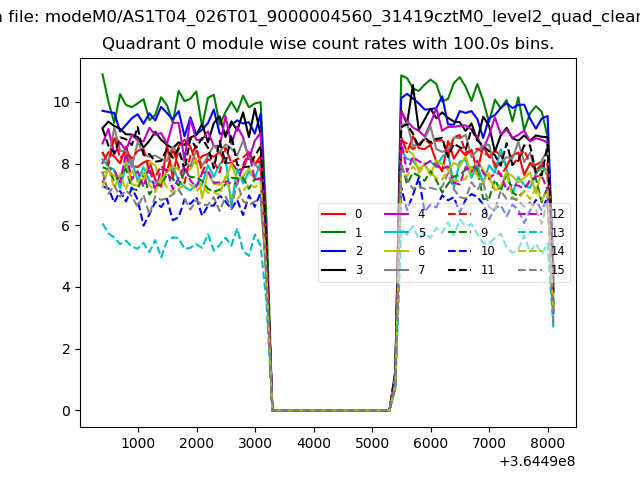 |
 |
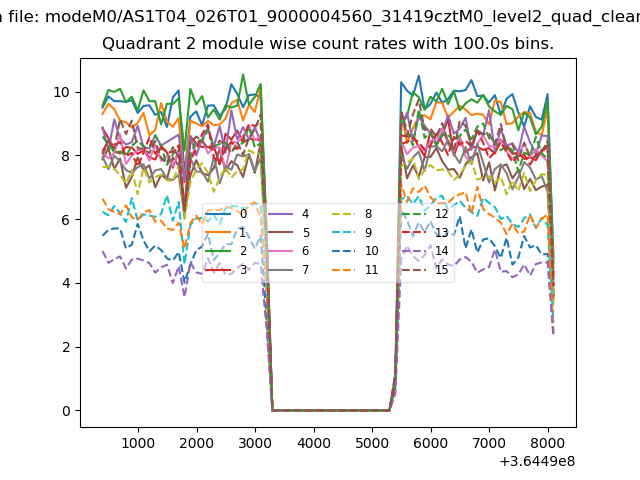
| Module-wise count rates for Quadrant B Data is divided into 100 sec bins |
 |
 |
| Module-wise count rates for Quadrant C Data is divided into 100 sec bins |
 |
 |
| Module-wise count rates for Quadrant D Data is divided into 100 sec bins |
 |
 |
| Parameter | Plot |
|---|---|
| CZT HV Monitor |  |
| D_VDD | 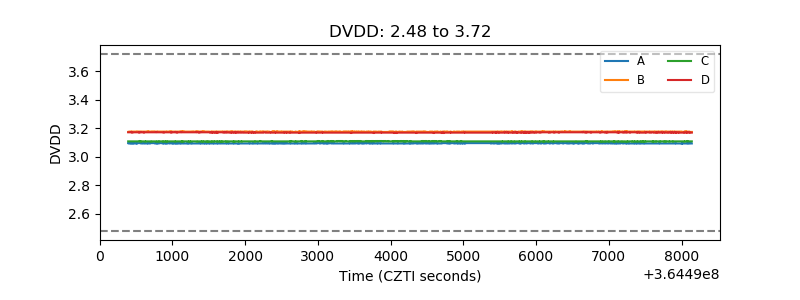 |
| Temperature 1 | 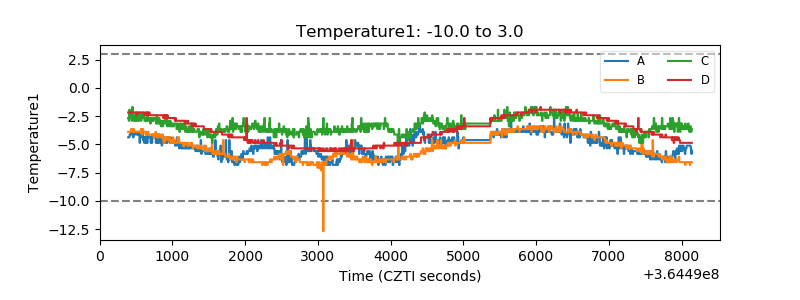 |
| Veto HV Monitor | 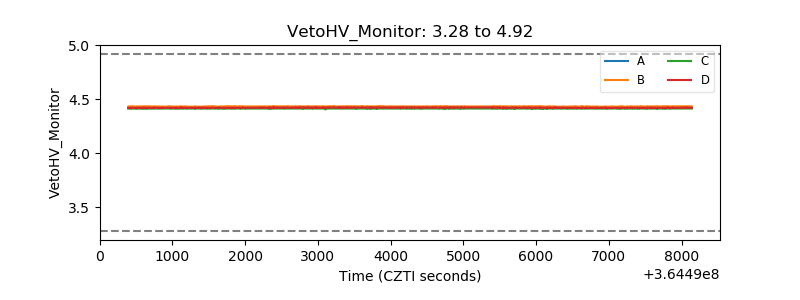 |
| Veto LLD | 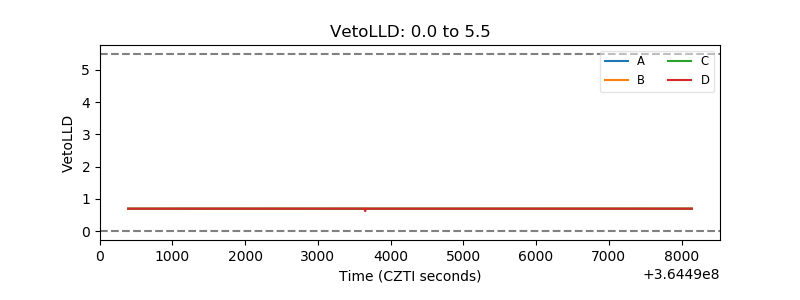 |
| Alpha Counter | 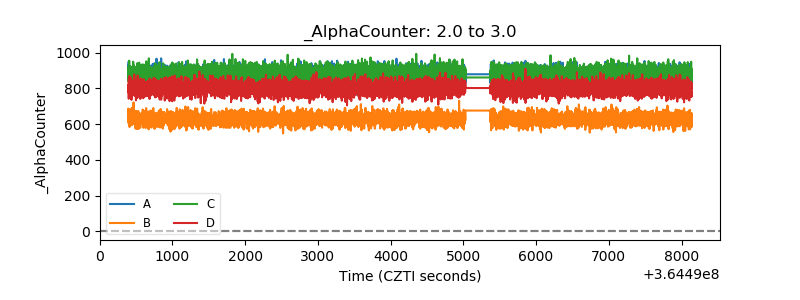 |
| _CPM_Rate | 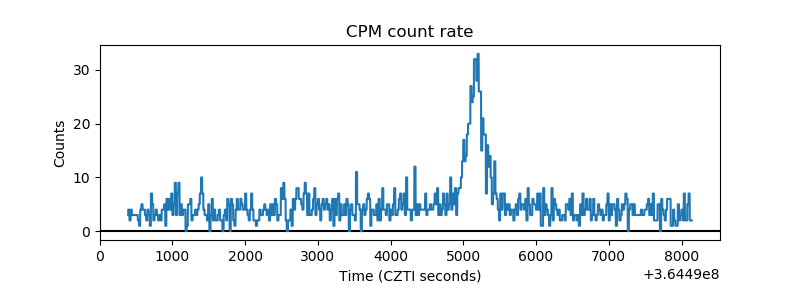 |
| CZT Counter | 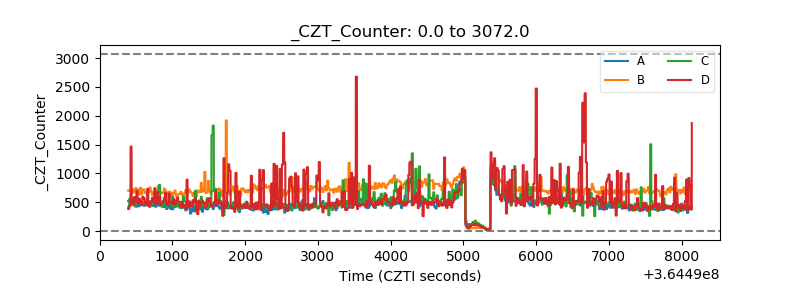 |
| +2.5 Volts monitor | 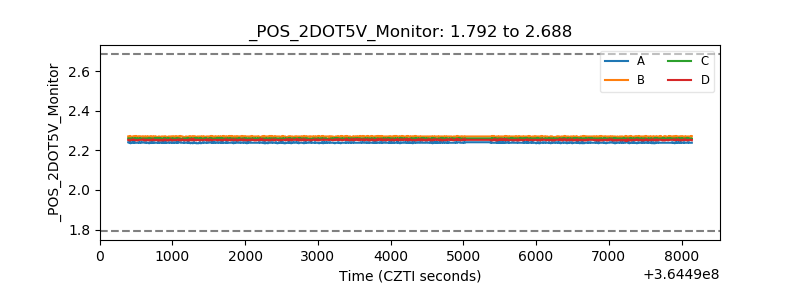 |
| +5 Volts monitor |  |
| _ROLL_ROT | 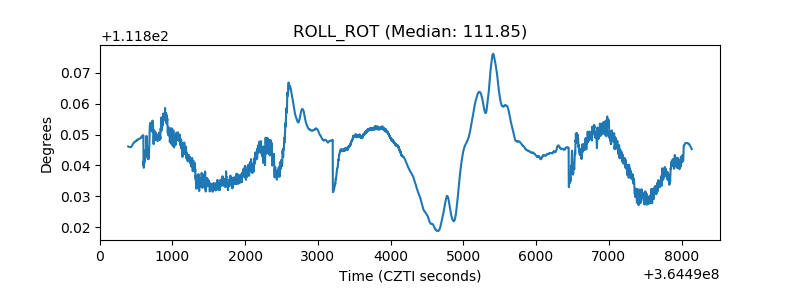 |
| _Roll_DEC | 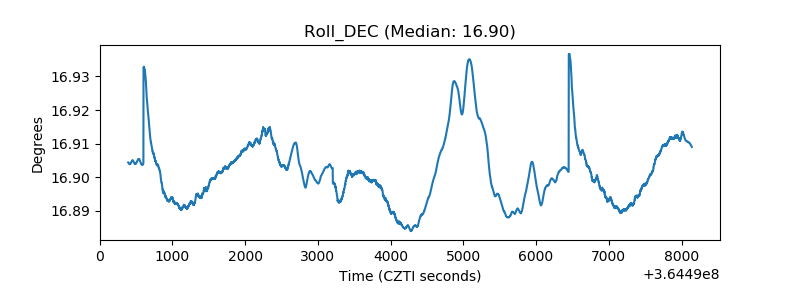 |
| _Roll_RA | 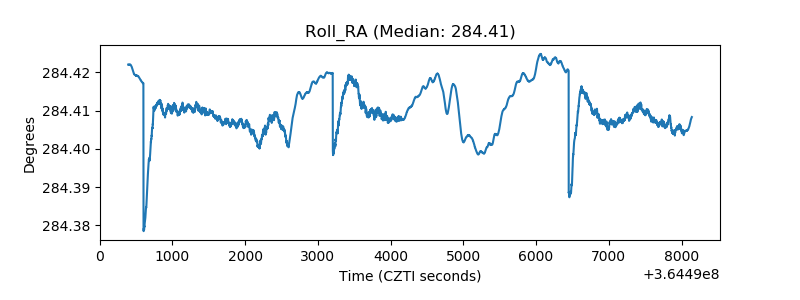 |
| Veto Counter | 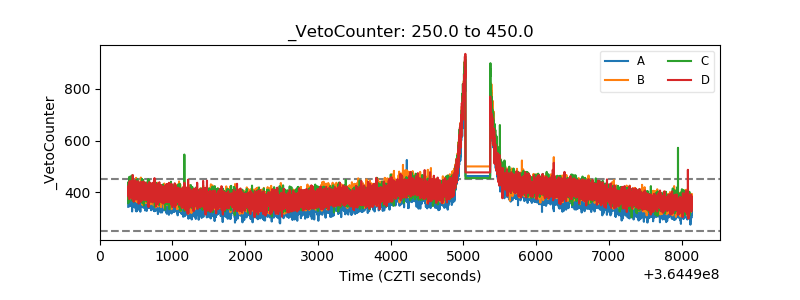 |