| Param | Original file | Final file |
|---|---|---|
| Filename | modeM0/AS1A10_094T25_9000004576cztM0_level2.fits | modeM0/AS1A10_094T25_9000004576cztM0_level2_quad_clean.evt |
| Size (bytes) | 45,198,720 | 56,208,960 |
| Size | 43.1 MB | 53.6 MB |
| Events in quadrant A | 280,252 | 359,514 |
| Events in quadrant B | 234,694 | 340,476 |
| Events in quadrant C | 271,634 | 345,207 |
| Events in quadrant D | 238,824 | 313,355 |
| Mode M9 | |||
|---|---|---|---|
| Quadrant | BADHDUFLAG | Total packets | Discarded packets |
| A | 0 | 5 | 0 |
| B | 0 | 5 | 0 |
| C | 0 | 5 | 0 |
| D | 0 | 5 | 0 |
| Mode M0 | |||
|---|---|---|---|
| Quadrant | BADHDUFLAG | Total packets | Discarded packets |
| A | 0 | 10012 | 0 |
| B | 0 | 19230 | 0 |
| C | 0 | 10666 | 0 |
| D | 0 | 15907 | 0 |
| Mode SS | |||
|---|---|---|---|
| Quadrant | BADHDUFLAG | Total packets | Discarded packets |
| A | 0 | 98 | 0 |
| B | 0 | 98 | 0 |
| C | 0 | 98 | 0 |
| D | 0 | 98 | 0 |
| Quadrant | Total seconds | Saturated seconds | Saturation percentage |
|---|---|---|---|
| A | 4894 | 86 | 1.757254% |
| B | 4894 | 980 | 20.024520% |
| C | 4894 | 153 | 3.126277% |
| D | 4894 | 198 | 4.045770% |
Noise dominated data is calculated using 1-second bins in cleaned event files. If a bin has >2000 counts, and if more than 50% of those come from <1% of pixels, then it is considered to be noise-dominated and hence unusable.
| Quadrant | # 1 sec bins | Bins with >0 counts | Bins with >2000 counts | High rate bins dominated by noise | Noise dominated (total time) | Noise dominated (detector-on time) | Marked lightcurve |
|---|---|---|---|---|---|---|---|
| A | 5334 | 4893 | 0 | 0 | 0.00% | 0.00% |  |
| B | 5334 | 4889 | 0 | 0 | 0.00% | 0.00% |  |
| C | 5334 | 4893 | 0 | 0 | 0.00% | 0.00% |  |
| D | 5334 | 4891 | 0 | 0 | 0.00% | 0.00% |  |
Top three noisy pixels from each quadrant. If the there are fewer than three noisy pixels in the level2.evt file, extra rows are filled as -1
| Pixel properties | Quadrant properties | ||||||
|---|---|---|---|---|---|---|---|
| Quadrant | DetID | PixID | Counts | Sigma | Mean | Median | Sigma |
| A | 0 | 29 | 276 | 10.48 | 73 | 68 | 19.8 |
| A | 14 | 95 | 221 | 7.71 | 73 | 68 | 19.8 |
| A | 0 | 30 | 213 | 7.31 | 73 | 68 | 19.8 |
| B | 2 | 9 | 183 | 8.67 | 62 | 59 | 14.3 |
| B | 2 | 245 | 161 | 7.14 | 62 | 59 | 14.3 |
| B | 14 | 254 | 159 | 7.0 | 62 | 59 | 14.3 |
| C | 3 | 187 | 194 | 6.43 | 71 | 67 | 19.8 |
| C | 9 | 233 | 188 | 6.12 | 71 | 67 | 19.8 |
| C | 12 | 241 | 186 | 6.02 | 71 | 67 | 19.8 |
| D | 6 | 38 | 191 | 6.43 | 68 | 61 | 20.2 |
| D | 4 | 246 | 189 | 6.33 | 68 | 61 | 20.2 |
| D | 4 | 160 | 184 | 6.08 | 68 | 61 | 20.2 |
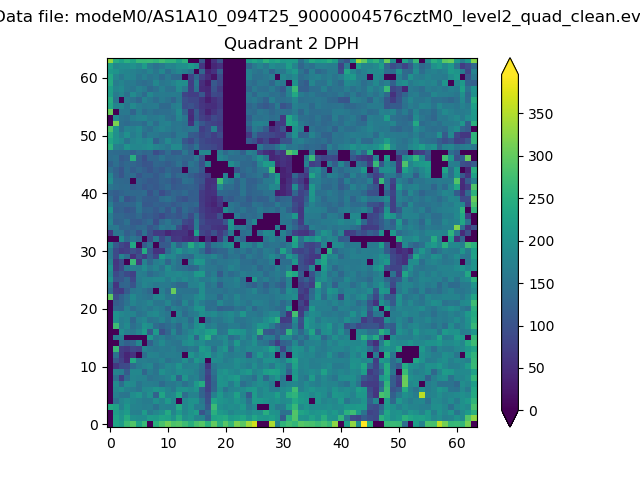
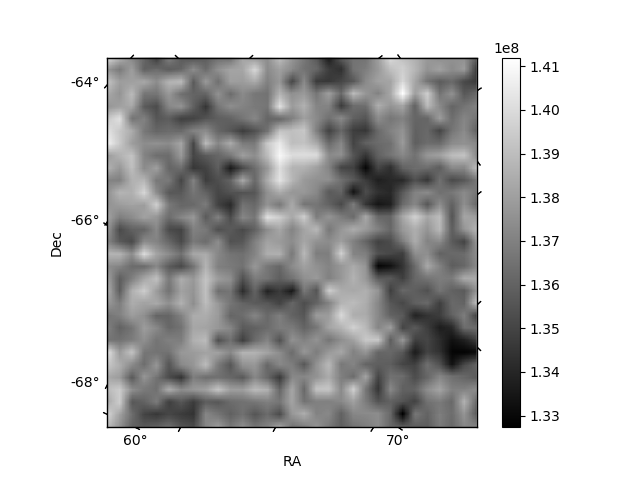
Histogram calculated using DETX and DETY for each event in the final _common_clean file
| Quadrant A |  |
 |
Quadrant B |
|---|---|---|---|
| Quadrant D | 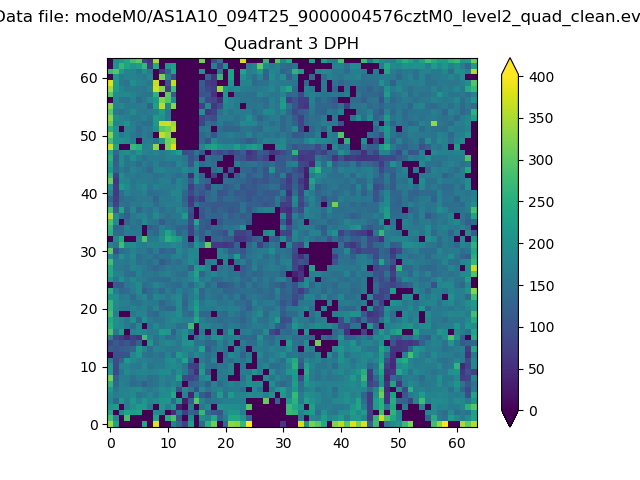 |
 |
Quadrant C |
| Plot type | Count rate plots | Images |
|---|---|---|
| Comparison with Poisson distribution Blue bars denote a histogram of data divided into 1 sec bins. Red curve is a Poisson curve with rate = median count rate of data. |
 |
 |
| Quadrant-wise count rates Data is divided into 100 sec bins |
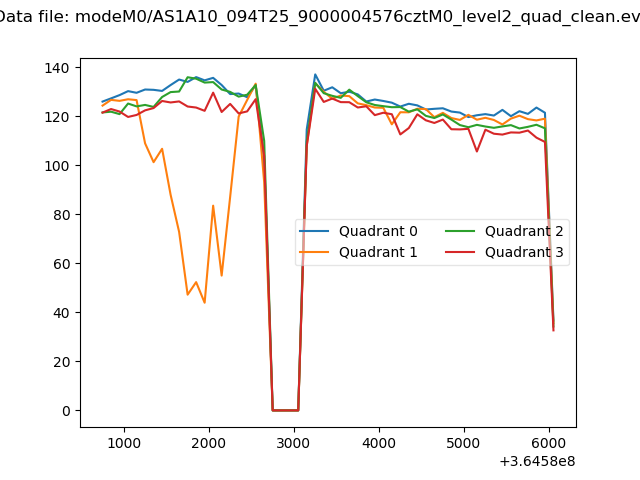 |
|
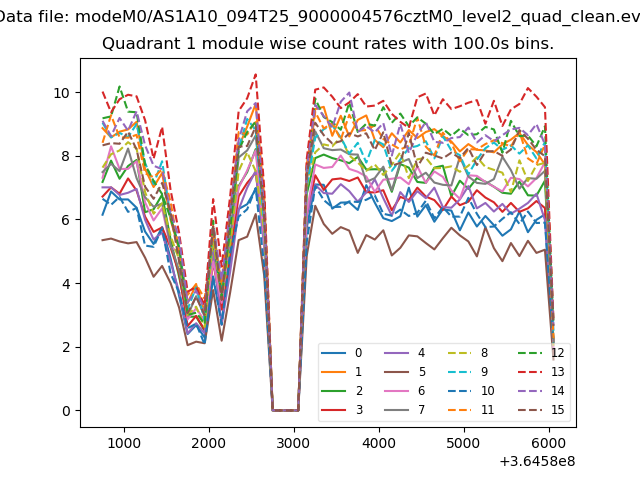
| Module-wise count rates for Quadrant A Data is divided into 100 sec bins |
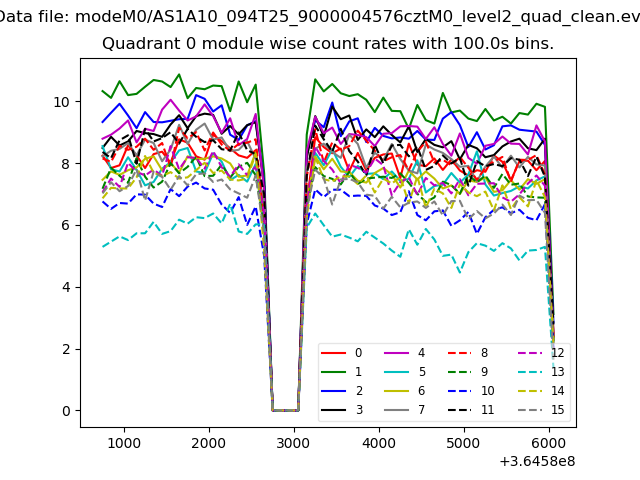 |
 |
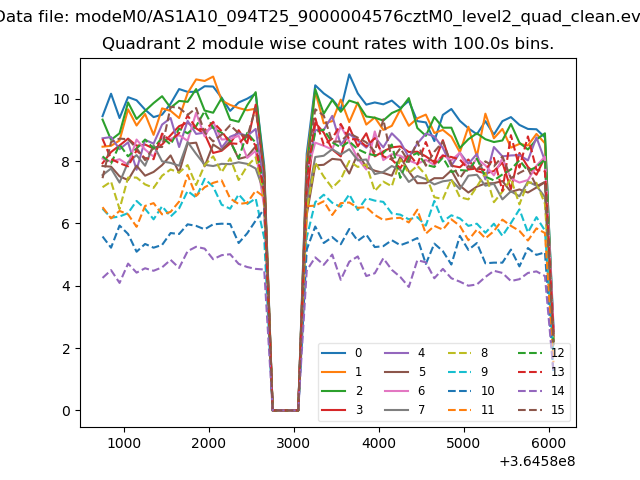
| Module-wise count rates for Quadrant B Data is divided into 100 sec bins |
 |
 |
| Module-wise count rates for Quadrant C Data is divided into 100 sec bins |
 |
 |
| Module-wise count rates for Quadrant D Data is divided into 100 sec bins |
 |
 |
| Parameter | Plot |
|---|---|
| CZT HV Monitor | 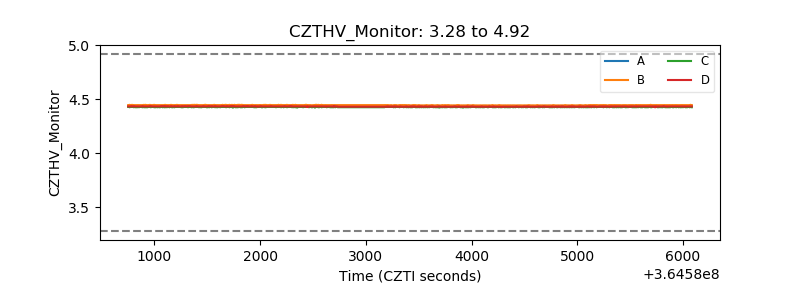 |
| D_VDD |  |
| Temperature 1 |  |
| Veto HV Monitor |  |
| Veto LLD |  |
| Alpha Counter |  |
| _CPM_Rate |  |
| CZT Counter |  |
| +2.5 Volts monitor | 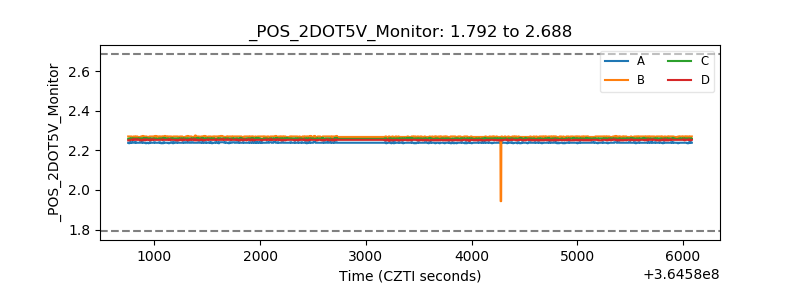 |
| +5 Volts monitor | 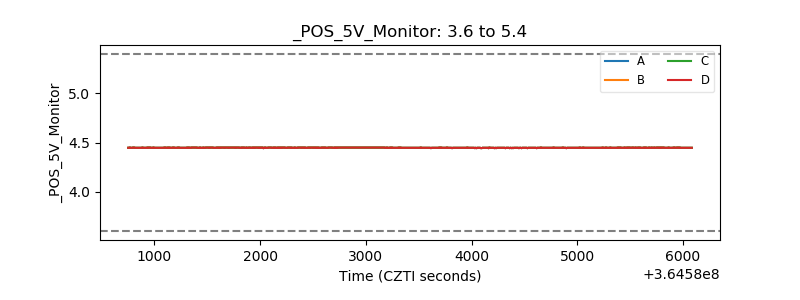 |
| _ROLL_ROT |  |
| _Roll_DEC |  |
| _Roll_RA |  |
| Veto Counter | 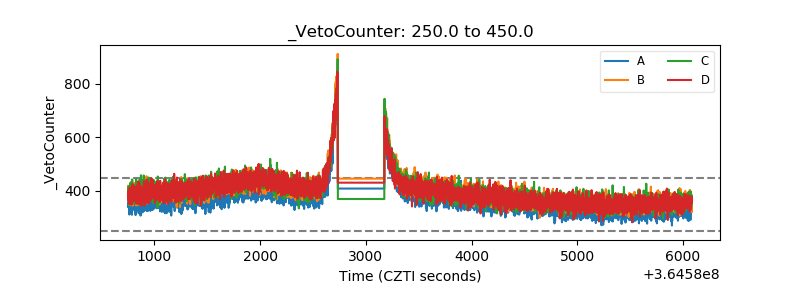 |