| Param | Original file | Final file |
|---|---|---|
| Filename | modeM0/AS1A10_094T25_9000004576_31433cztM0_level2.evt | modeM0/AS1A10_094T25_9000004576_31433cztM0_level2_quad_clean.evt |
| Size (bytes) | 480,839,040 | 89,758,080 |
| Size | 458.6 MB | 85.6 MB |
| Events in quadrant A | 2,282,324 | 624,151 |
| Events in quadrant B | 5,252,143 | 551,606 |
| Events in quadrant C | 2,528,040 | 609,504 |
| Events in quadrant D | 4,168,087 | 589,581 |
| Mode M9 | |||
|---|---|---|---|
| Quadrant | BADHDUFLAG | Total packets | Discarded packets |
| A | 0 | 5 | 0 |
| B | 0 | 5 | 0 |
| C | 0 | 5 | 0 |
| D | 0 | 5 | 0 |
| Mode M0 | |||
|---|---|---|---|
| Quadrant | BADHDUFLAG | Total packets | Discarded packets |
| A | 0 | 10013 | 1 |
| B | 0 | 19231 | 1 |
| C | 0 | 10667 | 1 |
| D | 0 | 15908 | 1 |
| Mode SS | |||
|---|---|---|---|
| Quadrant | BADHDUFLAG | Total packets | Discarded packets |
| A | 0 | 98 | 0 |
| B | 0 | 98 | 0 |
| C | 0 | 98 | 0 |
| D | 0 | 98 | 0 |
| Quadrant | Total seconds | Saturated seconds | Saturation percentage |
|---|---|---|---|
| A | 4894 | 86 | 1.757254% |
| B | 4894 | 980 | 20.024520% |
| C | 4894 | 153 | 3.126277% |
| D | 4894 | 198 | 4.045770% |
Noise dominated data is calculated using 1-second bins in cleaned event files. If a bin has >2000 counts, and if more than 50% of those come from <1% of pixels, then it is considered to be noise-dominated and hence unusable.
| Quadrant | # 1 sec bins | Bins with >0 counts | Bins with >2000 counts | High rate bins dominated by noise | Noise dominated (total time) | Noise dominated (detector-on time) | Marked lightcurve |
|---|---|---|---|---|---|---|---|
| A | 5334 | 4894 | 0 | 0 | 0.00% | 0.00% | 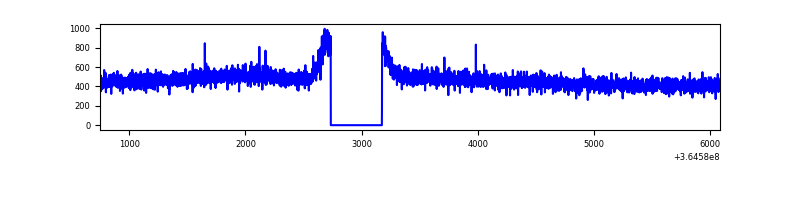 |
| B | 5334 | 4894 | 704 | 704 | 13.20% | 14.38% | 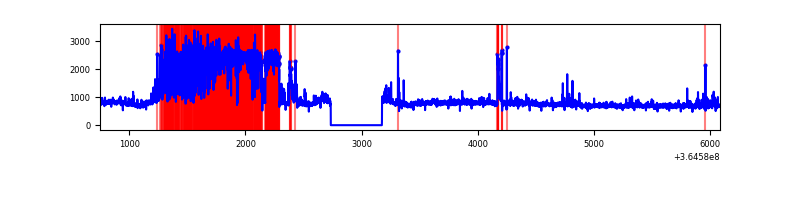 |
| C | 5334 | 4894 | 1 | 1 | 0.02% | 0.02% | 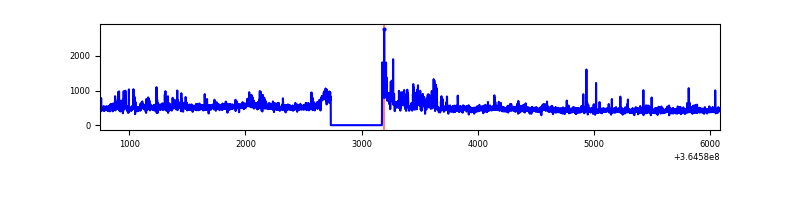 |
| D | 5334 | 4894 | 101 | 101 | 1.89% | 2.06% | 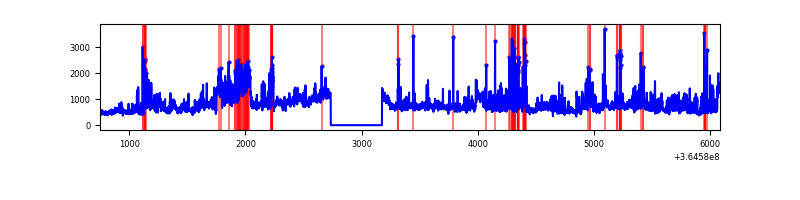 |
Top three noisy pixels from each quadrant. If the there are fewer than three noisy pixels in the level2.evt file, extra rows are filled as -1
| Pixel properties | Quadrant properties | ||||||
|---|---|---|---|---|---|---|---|
| Quadrant | DetID | PixID | Counts | Sigma | Mean | Median | Sigma |
| A | 13 | 254 | 10585 | 83.83 | 589 | 575 | 119.4 |
| A | 3 | 137 | 6252 | 47.54 | 589 | 575 | 119.4 |
| A | 0 | 226 | 4974 | 36.84 | 589 | 575 | 119.4 |
| B | 12 | 1 | 1769749 | 17264.01 | 527 | 513 | 102.5 |
| B | 6 | 159 | 1250940 | 12201.53 | 527 | 513 | 102.5 |
| B | 5 | 172 | 45182 | 435.88 | 527 | 513 | 102.5 |
| C | 3 | 233 | 170460 | 1274.57 | 565 | 569 | 133.3 |
| C | 14 | 238 | 107070 | 799.0 | 565 | 569 | 133.3 |
| C | 14 | 254 | 24150 | 176.91 | 565 | 569 | 133.3 |
| D | 1 | 52 | 729494 | 5410.16 | 568 | 550 | 134.7 |
| D | 12 | 218 | 542090 | 4019.26 | 568 | 550 | 134.7 |
| D | 8 | 195 | 438358 | 3249.37 | 568 | 550 | 134.7 |
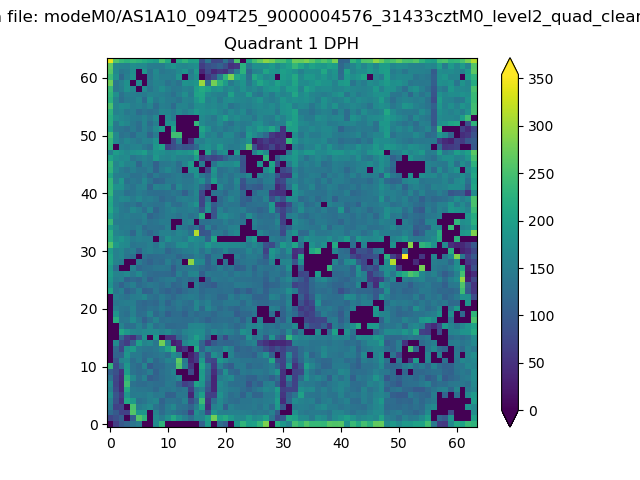
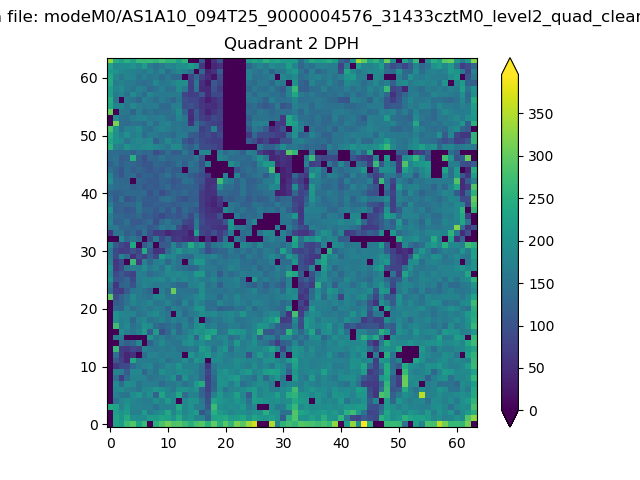
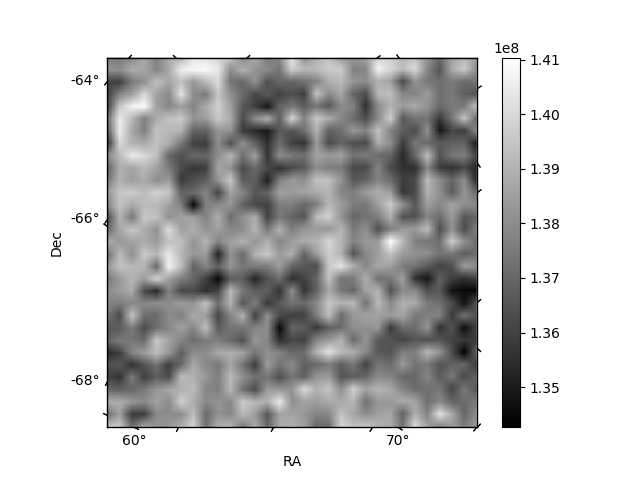
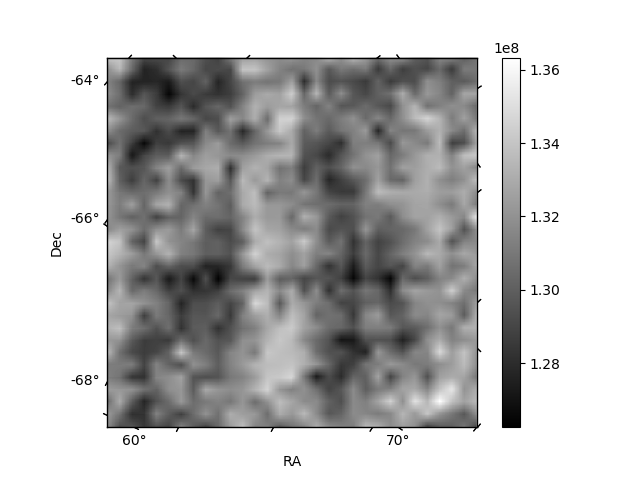
Histogram calculated using DETX and DETY for each event in the final _common_clean file
| Quadrant A |  |
 |
Quadrant B |
|---|---|---|---|
| Quadrant D |  |
 |
Quadrant C |
| Plot type | Count rate plots | Images |
|---|---|---|
| Comparison with Poisson distribution Blue bars denote a histogram of data divided into 1 sec bins. Red curve is a Poisson curve with rate = median count rate of data. |
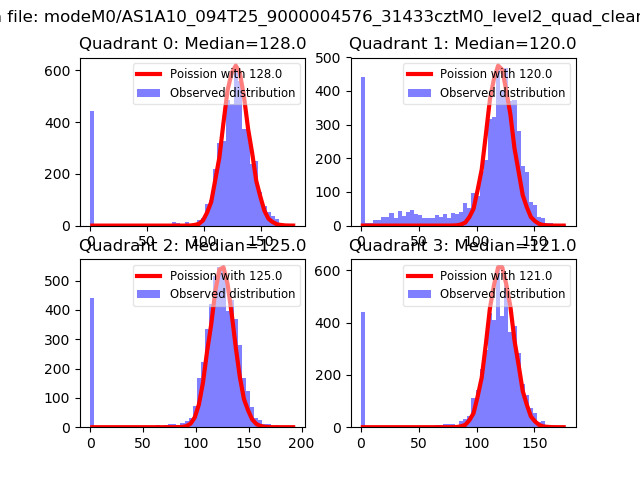 |
 |
| Quadrant-wise count rates Data is divided into 100 sec bins |
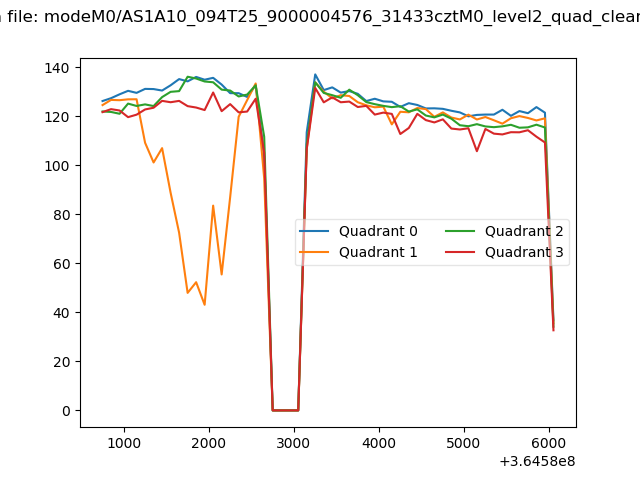 |
|
| Module-wise count rates for Quadrant A Data is divided into 100 sec bins |
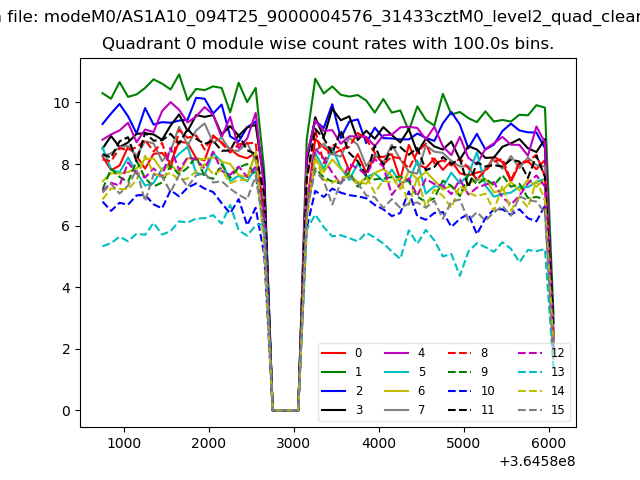 |
 |
| Module-wise count rates for Quadrant B Data is divided into 100 sec bins |
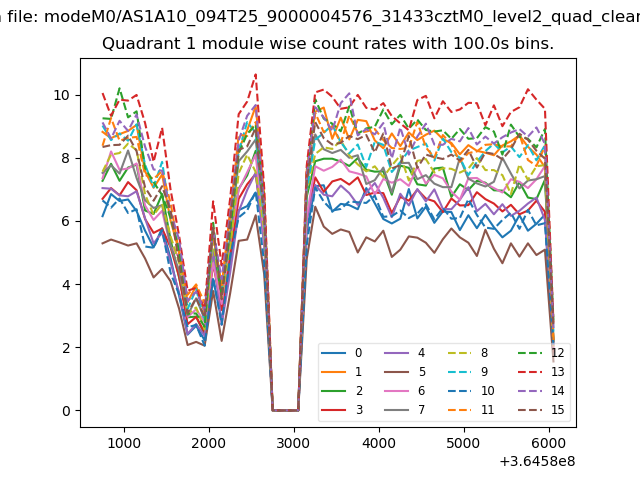 |
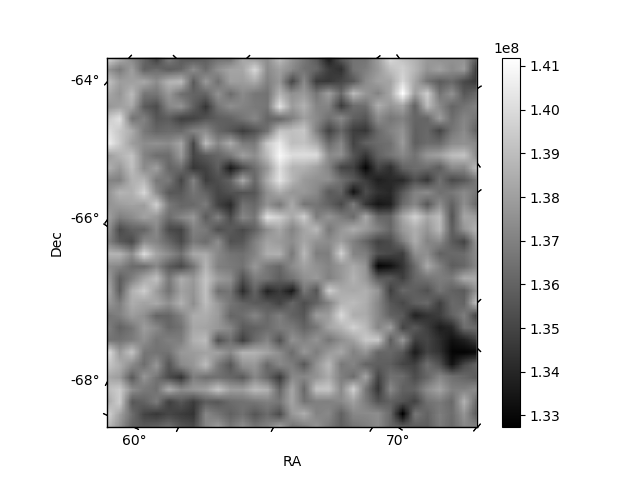 |
| Module-wise count rates for Quadrant C Data is divided into 100 sec bins |
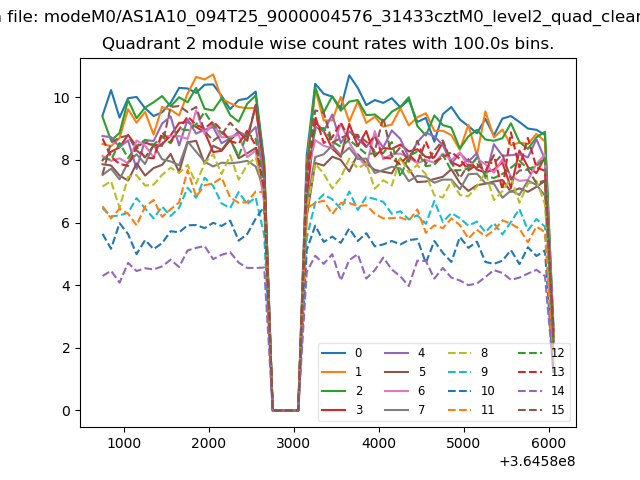 |
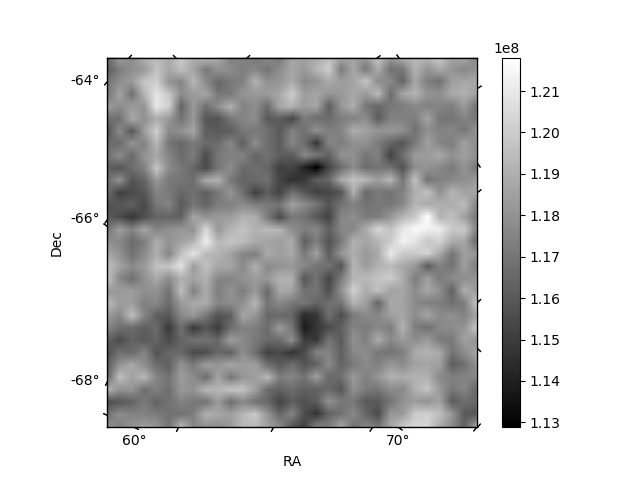 |
| Module-wise count rates for Quadrant D Data is divided into 100 sec bins |
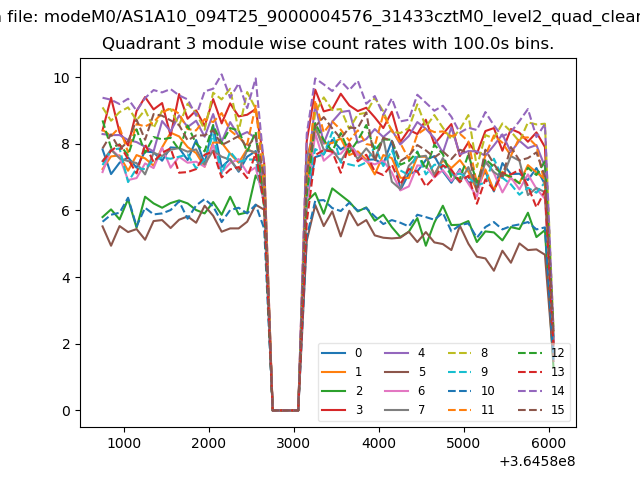 |
 |
| Parameter | Plot |
|---|---|
| CZT HV Monitor | 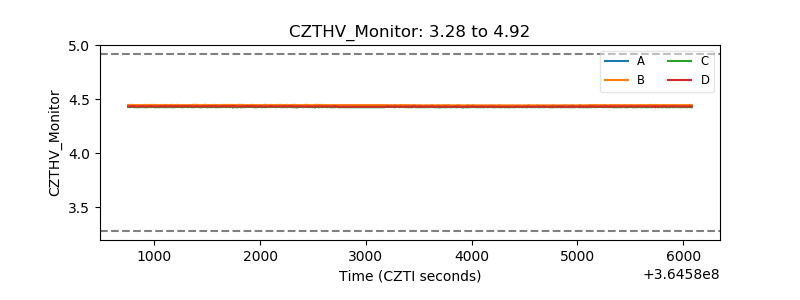 |
| D_VDD | 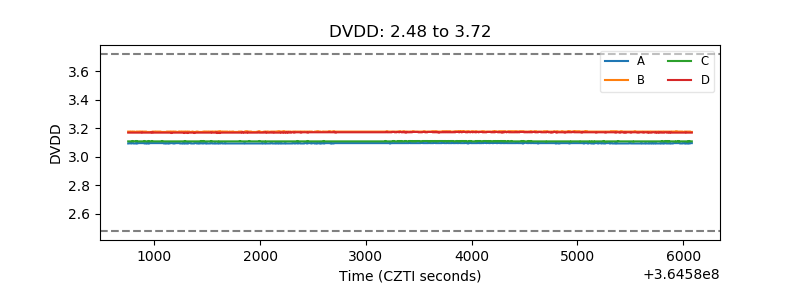 |
| Temperature 1 | 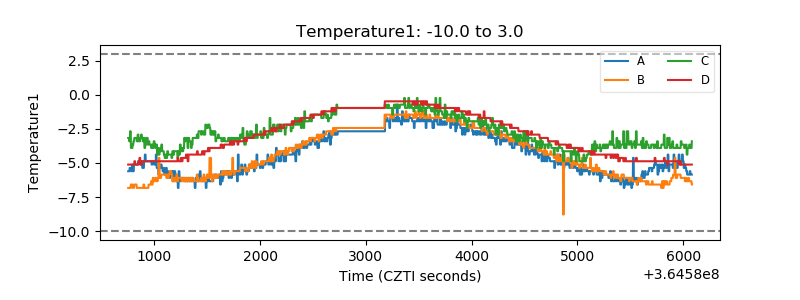 |
| Veto HV Monitor | 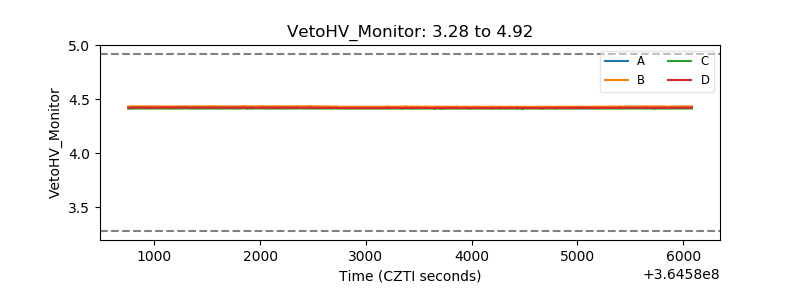 |
| Veto LLD | 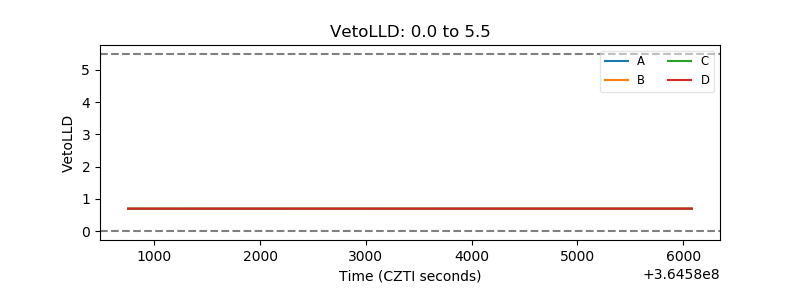 |
| Alpha Counter | 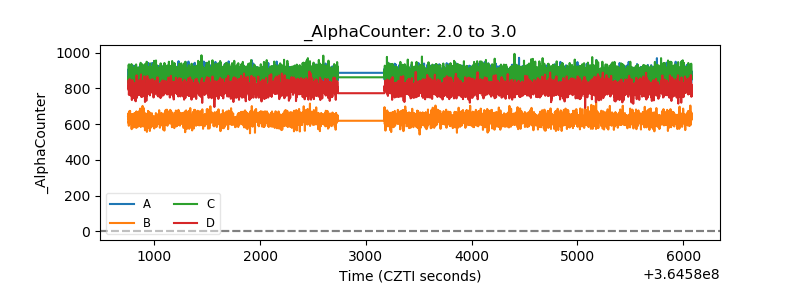 |
| _CPM_Rate | 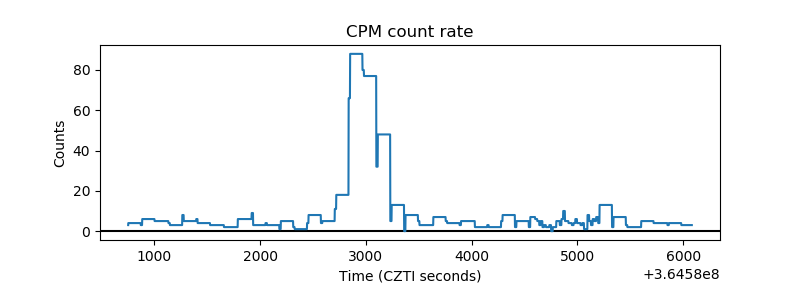 |
| CZT Counter | 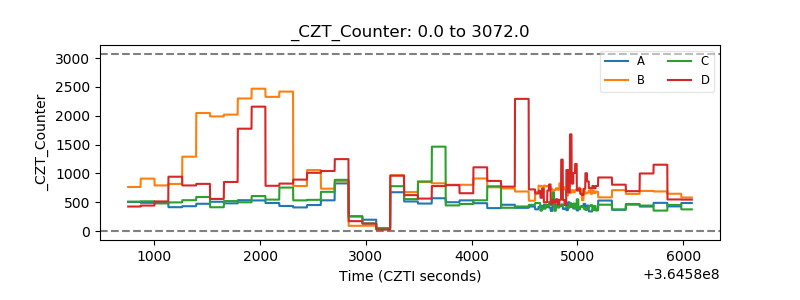 |
| +2.5 Volts monitor |  |
| +5 Volts monitor |  |
| _ROLL_ROT | 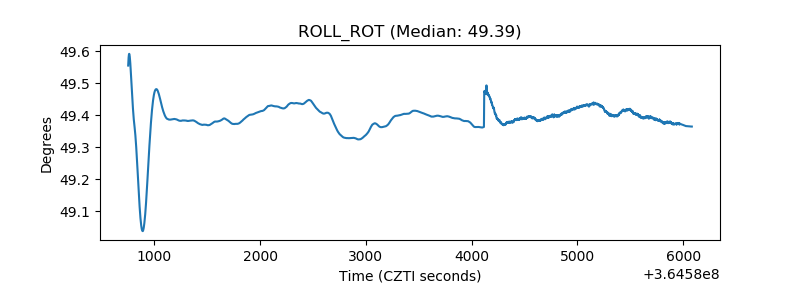 |
| _Roll_DEC | 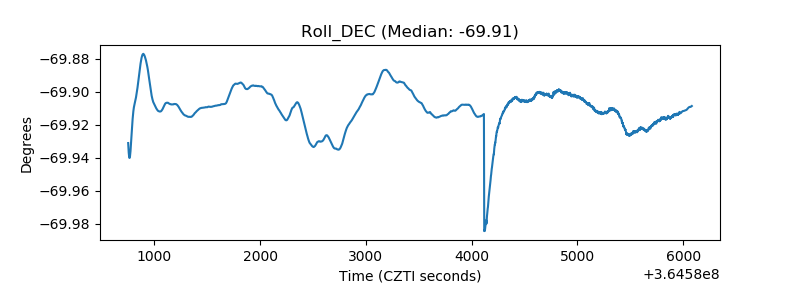 |
| _Roll_RA | 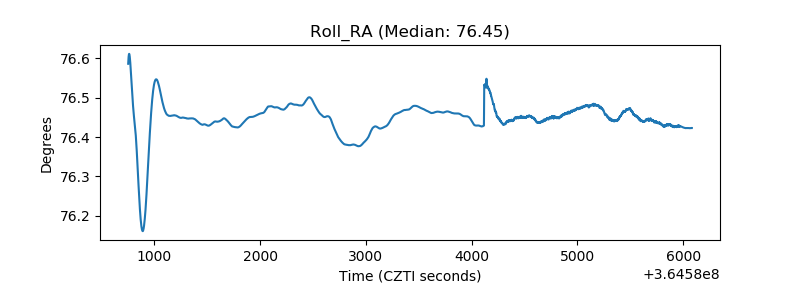 |
| Veto Counter | 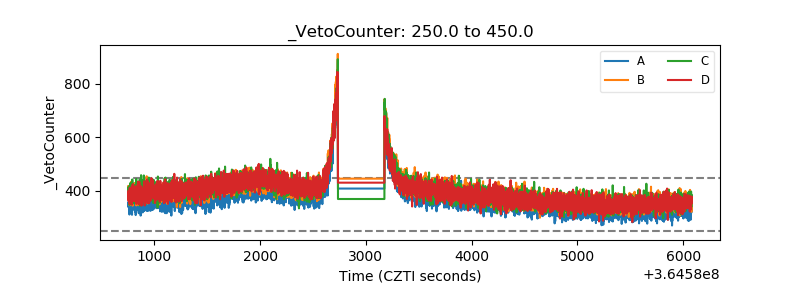 |