| Param | Original file | Final file |
|---|---|---|
| Filename | modeM0/AS1A10_094T28_9000004578cztM0_level2.fits | modeM0/AS1A10_094T28_9000004578cztM0_level2_quad_clean.evt |
| Size (bytes) | 73,739,520 | 82,756,800 |
| Size | 70.3 MB | 78.9 MB |
| Events in quadrant A | 453,642 | 524,414 |
| Events in quadrant B | 399,742 | 478,104 |
| Events in quadrant C | 441,660 | 496,419 |
| Events in quadrant D | 389,544 | 458,266 |
| Mode M9 | |||
|---|---|---|---|
| Quadrant | BADHDUFLAG | Total packets | Discarded packets |
| A | 0 | 11 | 0 |
| B | 0 | 11 | 0 |
| C | 0 | 11 | 0 |
| D | 0 | 11 | 0 |
| Mode M0 | |||
|---|---|---|---|
| Quadrant | BADHDUFLAG | Total packets | Discarded packets |
| A | 0 | 16013 | 0 |
| B | 0 | 27547 | 0 |
| C | 0 | 16455 | 0 |
| D | 0 | 19893 | 0 |
| Mode SS | |||
|---|---|---|---|
| Quadrant | BADHDUFLAG | Total packets | Discarded packets |
| A | 0 | 162 | 0 |
| B | 0 | 162 | 0 |
| C | 0 | 162 | 0 |
| D | 0 | 162 | 0 |
| Quadrant | Total seconds | Saturated seconds | Saturation percentage |
|---|---|---|---|
| A | 7889 | 61 | 0.773229% |
| B | 7889 | 793 | 10.051971% |
| C | 7889 | 159 | 2.015465% |
| D | 7889 | 122 | 1.546457% |
Noise dominated data is calculated using 1-second bins in cleaned event files. If a bin has >2000 counts, and if more than 50% of those come from <1% of pixels, then it is considered to be noise-dominated and hence unusable.
| Quadrant | # 1 sec bins | Bins with >0 counts | Bins with >2000 counts | High rate bins dominated by noise | Noise dominated (total time) | Noise dominated (detector-on time) | Marked lightcurve |
|---|---|---|---|---|---|---|---|
| A | 8558 | 7888 | 0 | 0 | 0.00% | 0.00% |  |
| B | 8558 | 7852 | 0 | 0 | 0.00% | 0.00% |  |
| C | 8558 | 7888 | 0 | 0 | 0.00% | 0.00% | 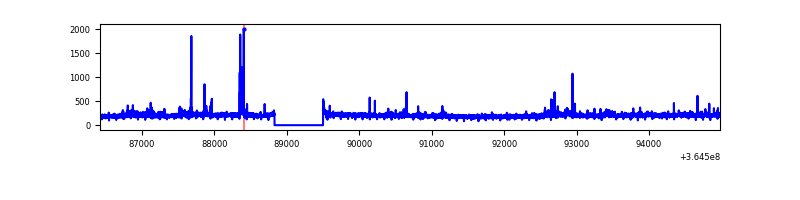 |
| D | 8558 | 7886 | 0 | 0 | 0.00% | 0.00% |  |
Top three noisy pixels from each quadrant. If the there are fewer than three noisy pixels in the level2.evt file, extra rows are filled as -1
| Pixel properties | Quadrant properties | ||||||
|---|---|---|---|---|---|---|---|
| Quadrant | DetID | PixID | Counts | Sigma | Mean | Median | Sigma |
| A | 0 | 29 | 434 | 10.19 | 118 | 111 | 31.7 |
| A | 0 | 30 | 338 | 7.16 | 118 | 111 | 31.7 |
| A | 15 | 236 | 335 | 7.06 | 118 | 111 | 31.7 |
| B | 2 | 9 | 333 | 9.77 | 105 | 100 | 23.8 |
| B | 14 | 254 | 272 | 7.21 | 105 | 100 | 23.8 |
| B | 2 | 8 | 269 | 7.09 | 105 | 100 | 23.8 |
| C | 12 | 241 | 348 | 7.63 | 116 | 109 | 31.3 |
| C | 1 | 80 | 335 | 7.21 | 116 | 109 | 31.3 |
| C | 1 | 81 | 331 | 7.09 | 116 | 109 | 31.3 |
| D | 15 | 47 | 298 | 6.4 | 111 | 101 | 30.8 |
| D | 3 | 14 | 296 | 6.33 | 111 | 101 | 30.8 |
| D | 6 | 192 | 279 | 5.78 | 111 | 101 | 30.8 |
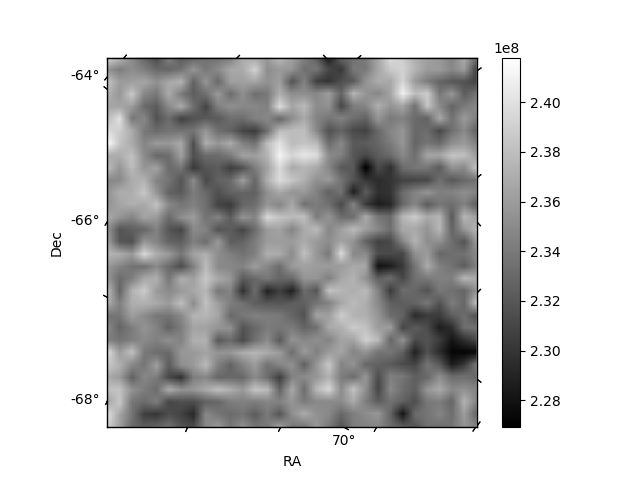
Histogram calculated using DETX and DETY for each event in the final _common_clean file
| Quadrant A | 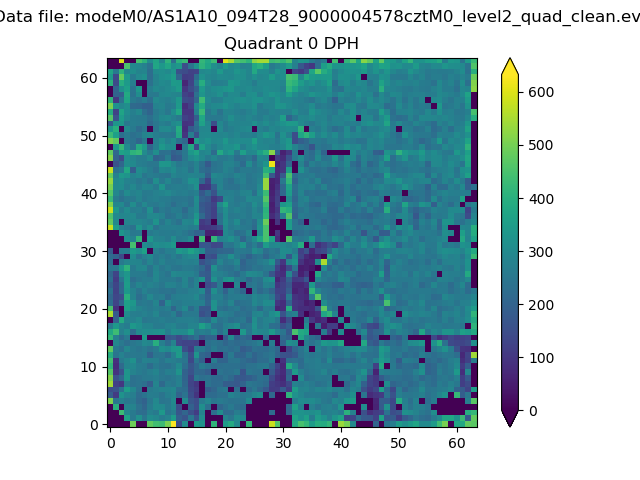 |
 |
Quadrant B |
|---|---|---|---|
| Quadrant D |  |
 |
Quadrant C |
| Plot type | Count rate plots | Images |
|---|---|---|
| Comparison with Poisson distribution Blue bars denote a histogram of data divided into 1 sec bins. Red curve is a Poisson curve with rate = median count rate of data. |
 |
 |
| Quadrant-wise count rates Data is divided into 100 sec bins |
 |
|
| Module-wise count rates for Quadrant A Data is divided into 100 sec bins |
 |
 |
| Module-wise count rates for Quadrant B Data is divided into 100 sec bins |
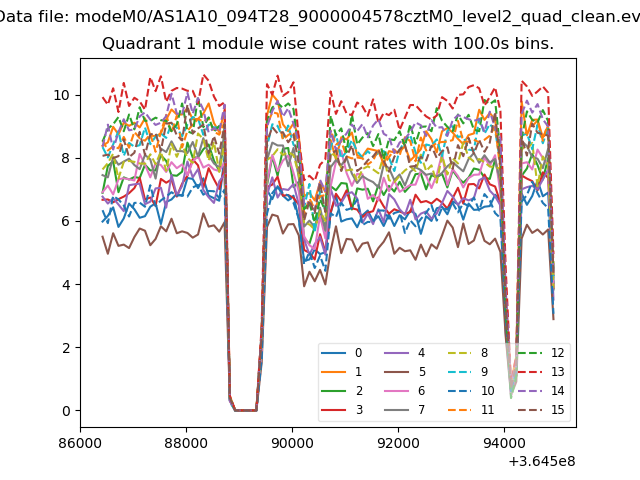 |
 |
| Module-wise count rates for Quadrant C Data is divided into 100 sec bins |
 |
 |
| Module-wise count rates for Quadrant D Data is divided into 100 sec bins |
 |
 |
| Parameter | Plot |
|---|---|
| CZT HV Monitor | 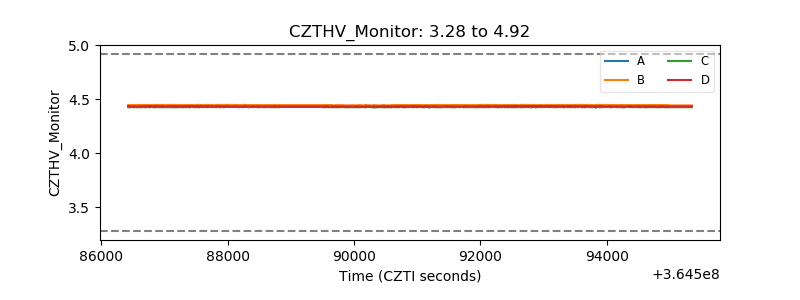 |
| D_VDD |  |
| Temperature 1 |  |
| Veto HV Monitor |  |
| Veto LLD | 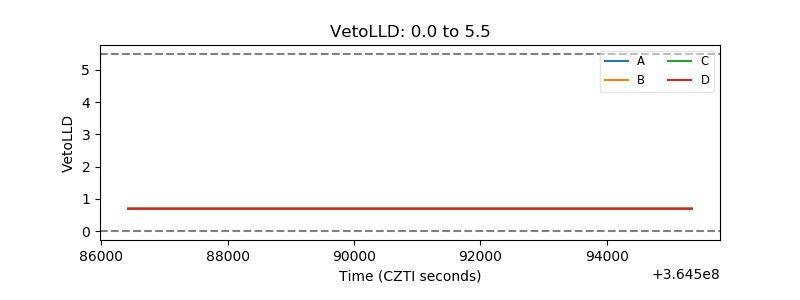 |
| Alpha Counter |  |
| _CPM_Rate |  |
| CZT Counter | 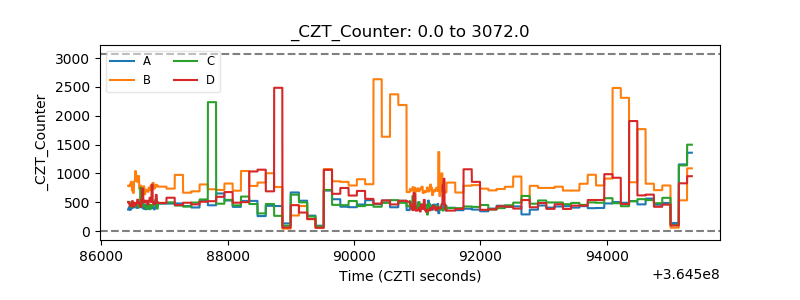 |
| +2.5 Volts monitor |  |
| +5 Volts monitor |  |
| _ROLL_ROT |  |
| _Roll_DEC |  |
| _Roll_RA |  |
| Veto Counter |  |