| Param | Original file | Final file |
|---|---|---|
| Filename | modeM0/AS1A10_094T28_9000004578_31433cztM0_level2.evt | modeM0/AS1A10_094T28_9000004578_31433cztM0_level2_quad_clean.evt |
| Size (bytes) | 35,818,560 | 9,005,760 |
| Size | 34.2 MB | 8.6 MB |
| Events in quadrant A | 204,514 | 59,384 |
| Events in quadrant B | 366,523 | 58,486 |
| Events in quadrant C | 222,189 | 56,375 |
| Events in quadrant D | 255,281 | 56,316 |
| Mode M0 | |||
|---|---|---|---|
| Quadrant | BADHDUFLAG | Total packets | Discarded packets |
| A | 0 | 962 | 0 |
| B | 0 | 1462 | 0 |
| C | 0 | 971 | 0 |
| D | 0 | 1024 | 0 |
| Mode SS | |||
|---|---|---|---|
| Quadrant | BADHDUFLAG | Total packets | Discarded packets |
| A | 0 | 10 | 0 |
| B | 0 | 10 | 0 |
| C | 0 | 10 | 0 |
| D | 0 | 10 | 0 |
| Quadrant | Total seconds | Saturated seconds | Saturation percentage |
|---|---|---|---|
| A | 480 | 0 | 0.000000% |
| B | 480 | 0 | 0.000000% |
| C | 480 | 1 | 0.208333% |
| D | 480 | 0 | 0.000000% |
Noise dominated data is calculated using 1-second bins in cleaned event files. If a bin has >2000 counts, and if more than 50% of those come from <1% of pixels, then it is considered to be noise-dominated and hence unusable.
| Quadrant | # 1 sec bins | Bins with >0 counts | Bins with >2000 counts | High rate bins dominated by noise | Noise dominated (total time) | Noise dominated (detector-on time) | Marked lightcurve |
|---|---|---|---|---|---|---|---|
| A | 480 | 480 | 0 | 0 | 0.00% | 0.00% | 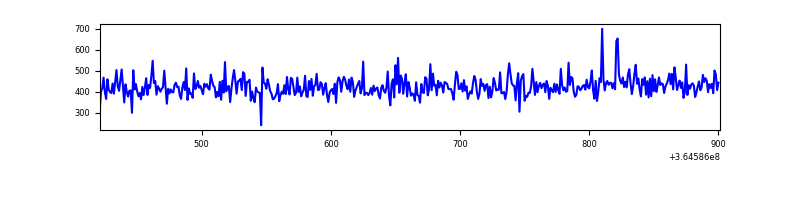 |
| B | 480 | 480 | 1 | 1 | 0.21% | 0.21% | 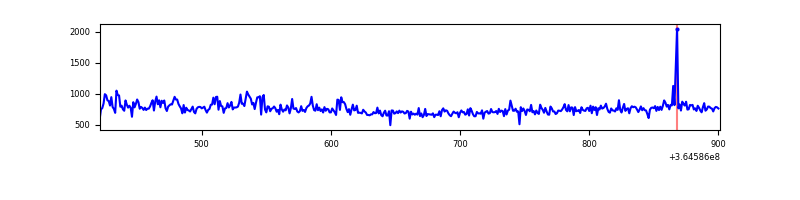 |
| C | 480 | 480 | 0 | 0 | 0.00% | 0.00% | 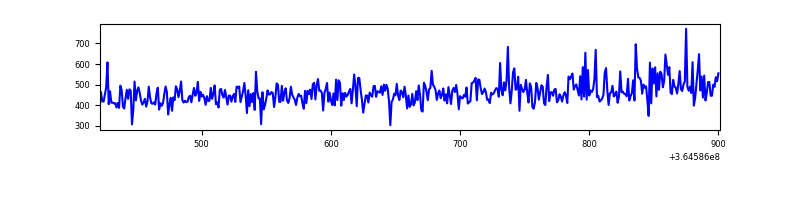 |
| D | 480 | 480 | 0 | 0 | 0.00% | 0.00% | 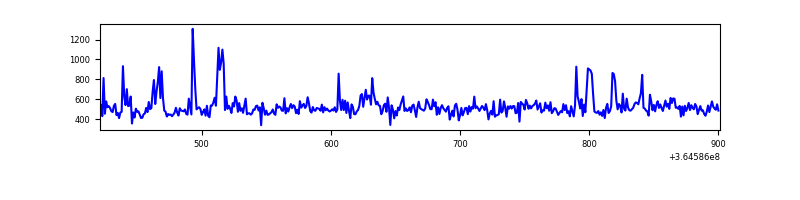 |
Top three noisy pixels from each quadrant. If the there are fewer than three noisy pixels in the level2.evt file, extra rows are filled as -1
| Pixel properties | Quadrant properties | ||||||
|---|---|---|---|---|---|---|---|
| Quadrant | DetID | PixID | Counts | Sigma | Mean | Median | Sigma |
| A | 13 | 254 | 1082 | 80.28 | 52 | 51 | 12.8 |
| A | 3 | 137 | 546 | 38.54 | 52 | 51 | 12.8 |
| A | 0 | 226 | 403 | 27.41 | 52 | 51 | 12.8 |
| B | 6 | 159 | 143910 | 11625.12 | 52 | 51 | 12.4 |
| B | 4 | 80 | 14208 | 1144.02 | 52 | 51 | 12.4 |
| B | 12 | 111 | 1221 | 94.55 | 52 | 51 | 12.4 |
| C | 14 | 238 | 8347 | 581.63 | 52 | 52 | 14.3 |
| C | 3 | 233 | 7318 | 509.48 | 52 | 52 | 14.3 |
| C | 2 | 114 | 1091 | 72.85 | 52 | 52 | 14.3 |
| D | 1 | 52 | 28771 | 1864.27 | 52 | 50 | 15.4 |
| D | 8 | 195 | 24343 | 1576.85 | 52 | 50 | 15.4 |
| D | 5 | 233 | 3194 | 204.08 | 52 | 50 | 15.4 |
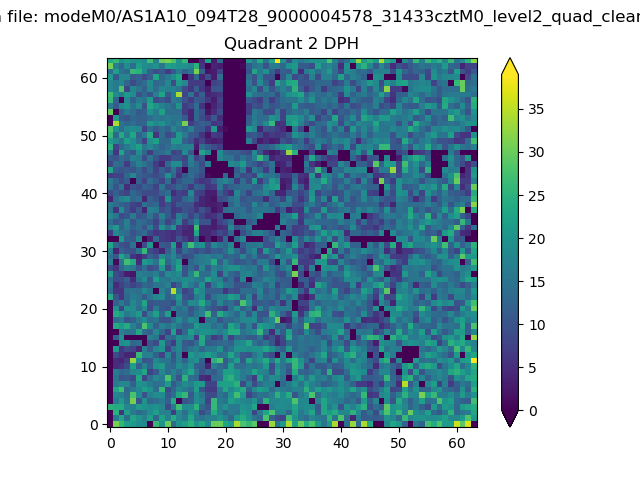
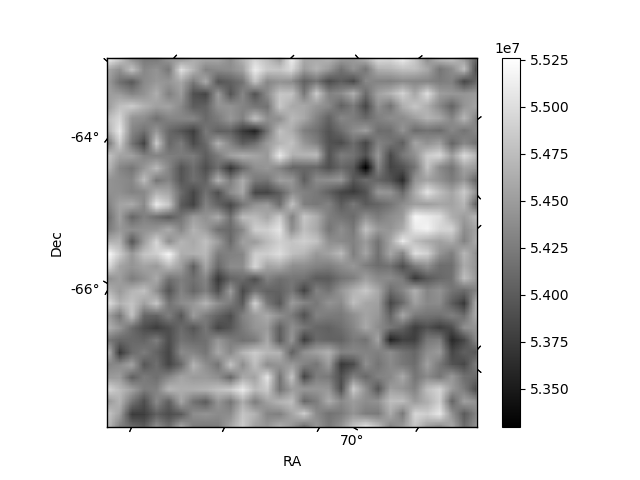
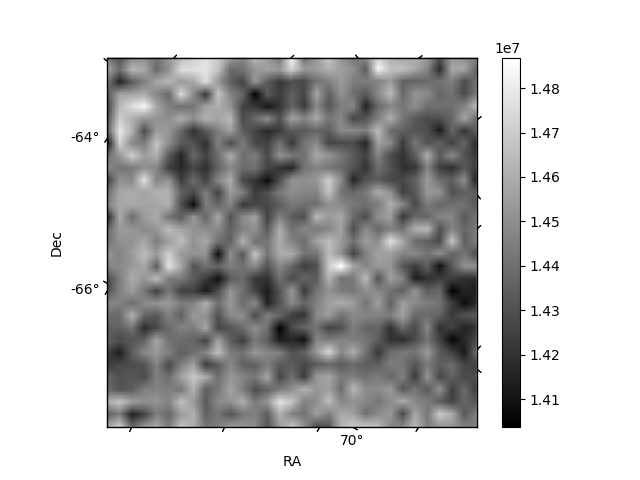
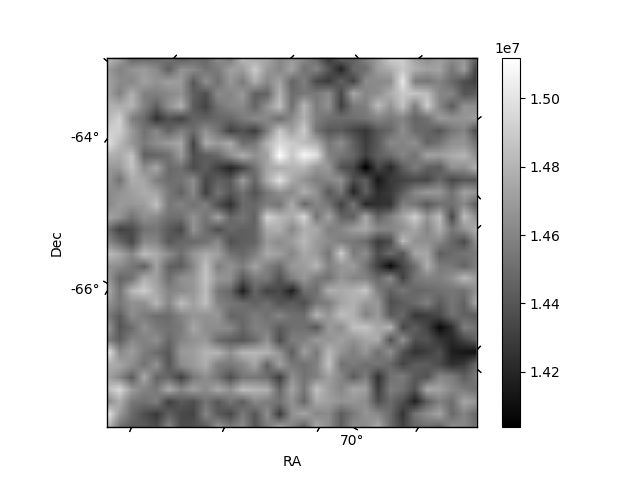
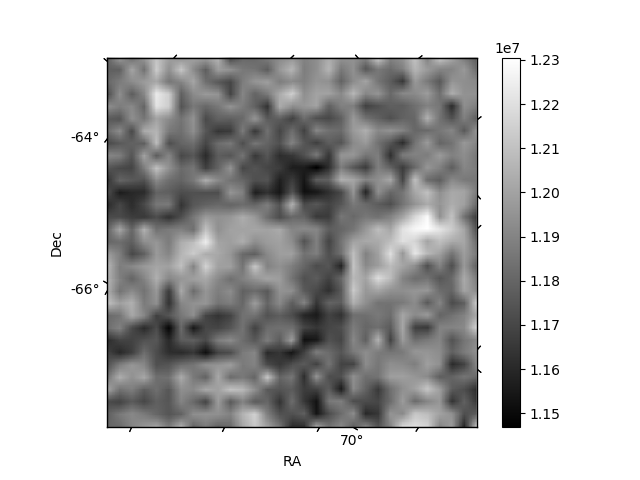
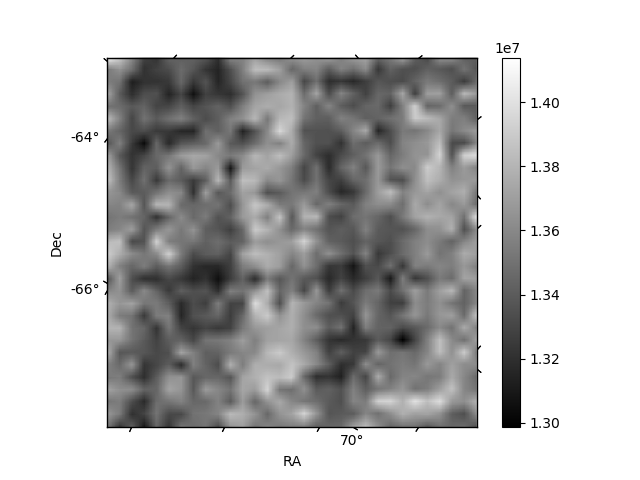
Histogram calculated using DETX and DETY for each event in the final _common_clean file
| Quadrant A | 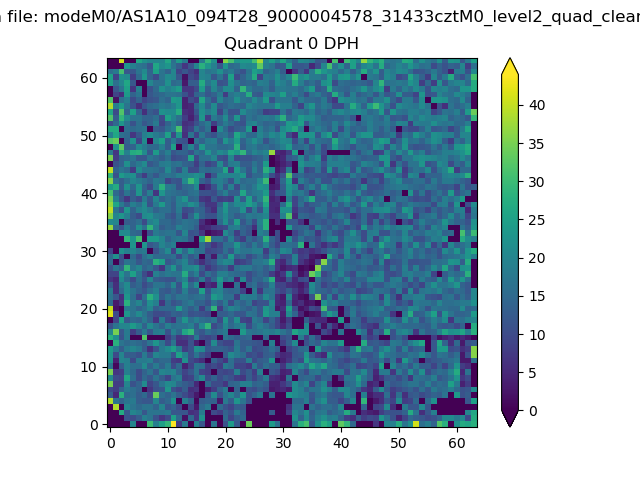 |
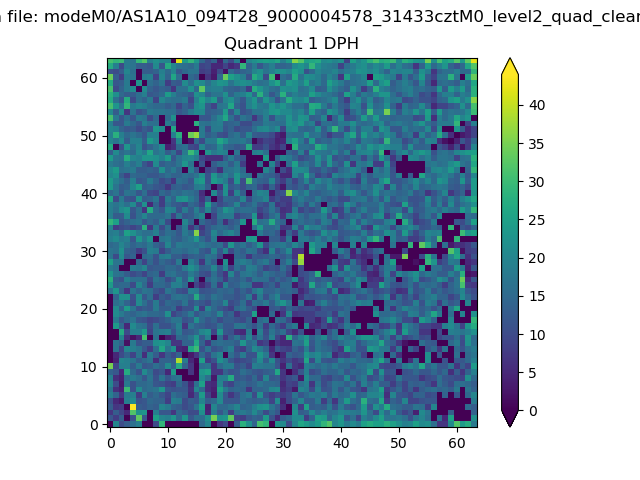 |
Quadrant B |
|---|---|---|---|
| Quadrant D | 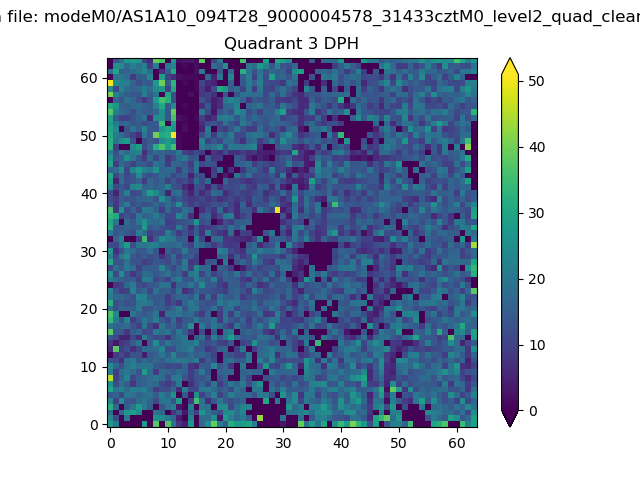 |
 |
Quadrant C |
| Plot type | Count rate plots | Images |
|---|---|---|
| Comparison with Poisson distribution Blue bars denote a histogram of data divided into 1 sec bins. Red curve is a Poisson curve with rate = median count rate of data. |
 |
 |
| Quadrant-wise count rates Data is divided into 100 sec bins |
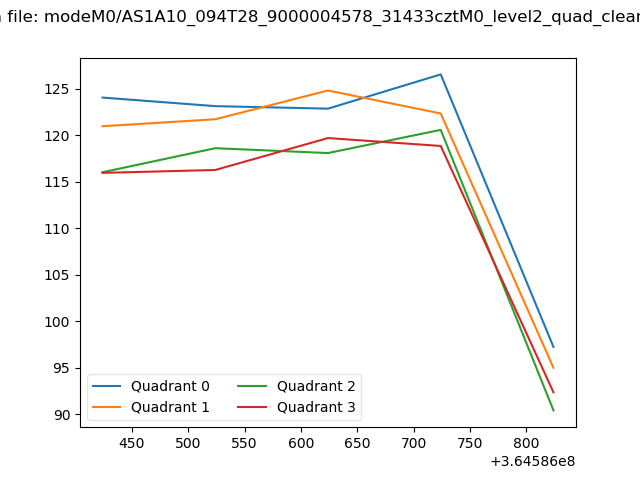 |
|
| Module-wise count rates for Quadrant A Data is divided into 100 sec bins |
 |
 |
| Module-wise count rates for Quadrant B Data is divided into 100 sec bins |
 |
 |
| Module-wise count rates for Quadrant C Data is divided into 100 sec bins |
 |
 |
| Module-wise count rates for Quadrant D Data is divided into 100 sec bins |
 |
 |
| Parameter | Plot |
|---|---|
| CZT HV Monitor |  |
| D_VDD | 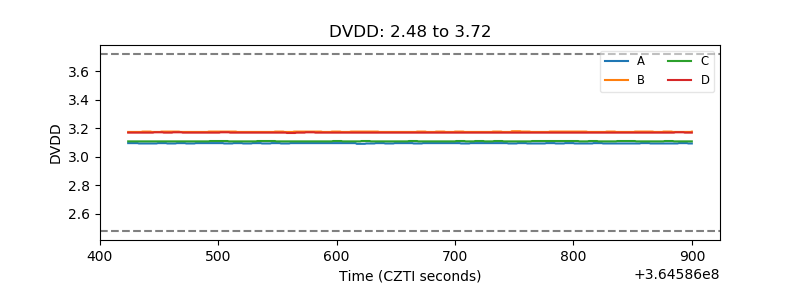 |
| Temperature 1 | 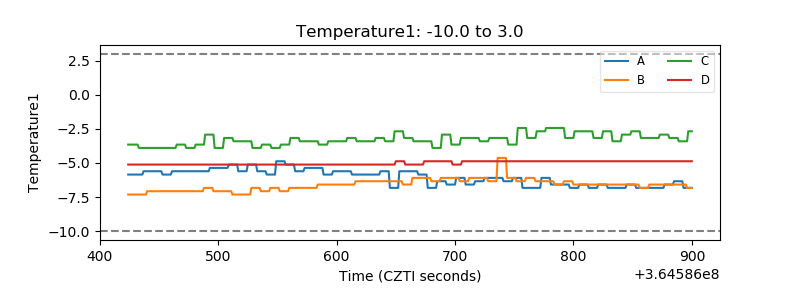 |
| Veto HV Monitor | 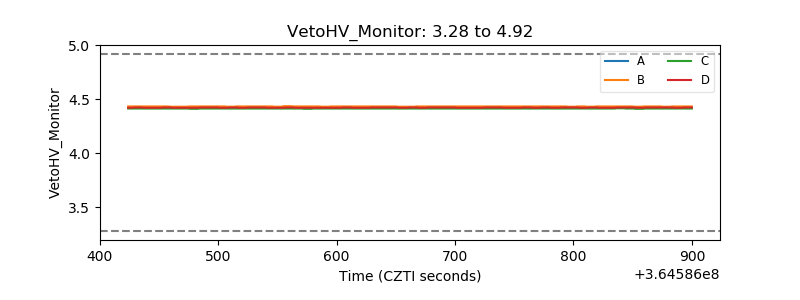 |
| Veto LLD |  |
| Alpha Counter | 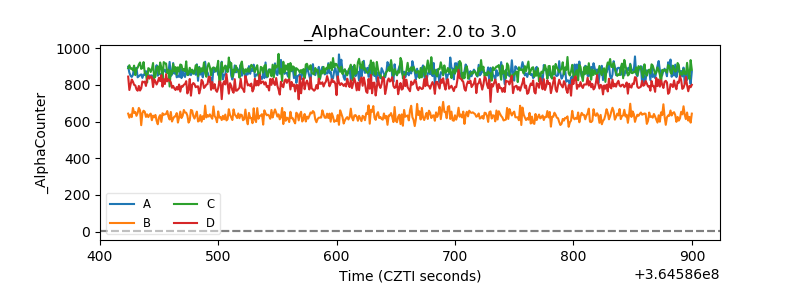 |
| _CPM_Rate | 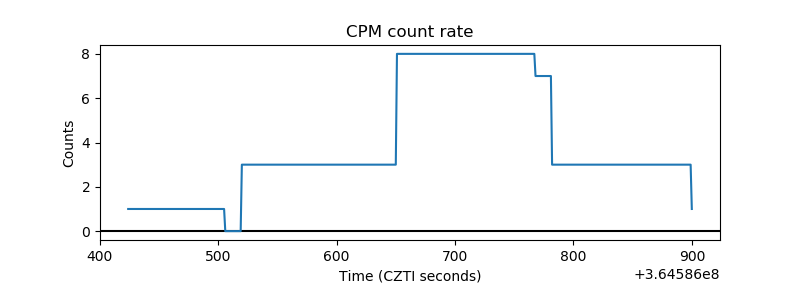 |
| CZT Counter | 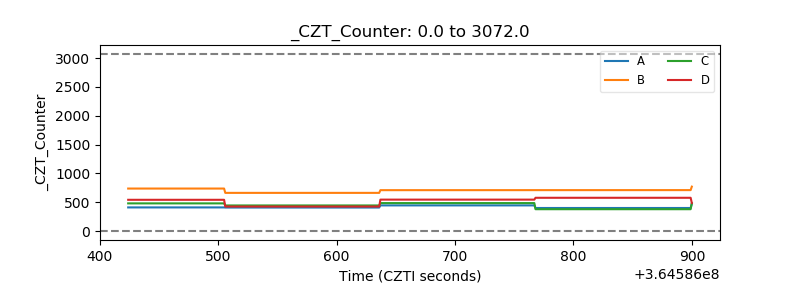 |
| +2.5 Volts monitor |  |
| +5 Volts monitor | 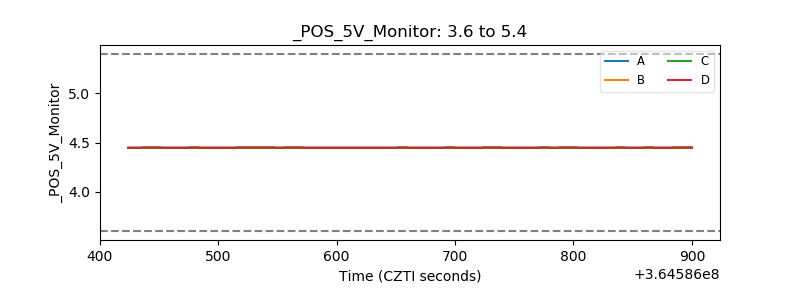 |
| _ROLL_ROT |  |
| _Roll_DEC | 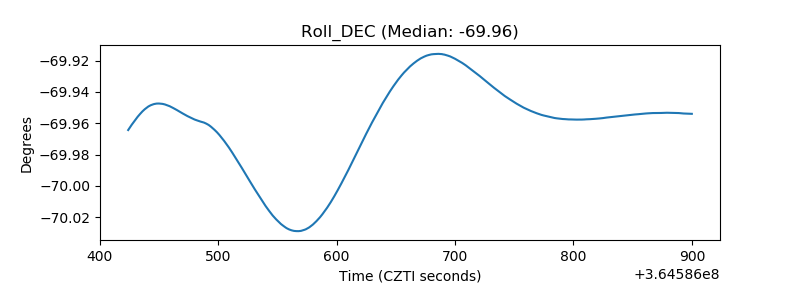 |
| _Roll_RA | 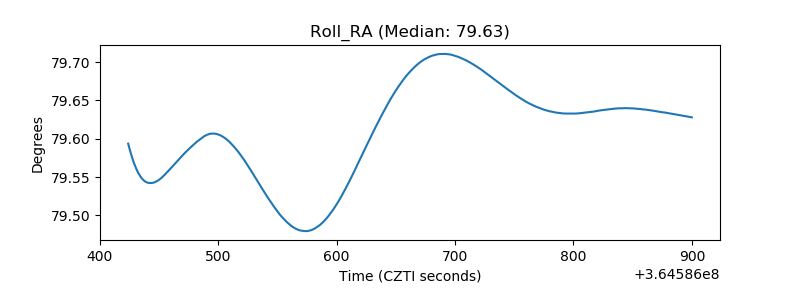 |
| Veto Counter |  |