| Param | Original file | Final file |
|---|---|---|
| Filename | modeM0/AS1A10_094T28_9000004578_31434cztM0_level2.evt | modeM0/AS1A10_094T28_9000004578_31434cztM0_level2_quad_clean.evt |
| Size (bytes) | 662,840,640 | 145,546,560 |
| Size | 632.1 MB | 138.8 MB |
| Events in quadrant A | 3,614,389 | 1,000,146 |
| Events in quadrant B | 7,226,949 | 934,775 |
| Events in quadrant C | 3,862,285 | 976,611 |
| Events in quadrant D | 4,841,005 | 952,463 |
| Mode M9 | |||
|---|---|---|---|
| Quadrant | BADHDUFLAG | Total packets | Discarded packets |
| A | 0 | 11 | 0 |
| B | 0 | 11 | 0 |
| C | 0 | 11 | 0 |
| D | 0 | 11 | 0 |
| Mode M0 | |||
|---|---|---|---|
| Quadrant | BADHDUFLAG | Total packets | Discarded packets |
| A | 0 | 15890 | 1 |
| B | 0 | 27356 | 1 |
| C | 0 | 16332 | 1 |
| D | 0 | 19759 | 1 |
| Mode SS | |||
|---|---|---|---|
| Quadrant | BADHDUFLAG | Total packets | Discarded packets |
| A | 0 | 160 | 0 |
| B | 0 | 160 | 0 |
| C | 0 | 160 | 0 |
| D | 0 | 160 | 0 |
| Quadrant | Total seconds | Saturated seconds | Saturation percentage |
|---|---|---|---|
| A | 7827 | 61 | 0.779354% |
| B | 7827 | 793 | 10.131596% |
| C | 7827 | 159 | 2.031430% |
| D | 7828 | 122 | 1.558508% |
Noise dominated data is calculated using 1-second bins in cleaned event files. If a bin has >2000 counts, and if more than 50% of those come from <1% of pixels, then it is considered to be noise-dominated and hence unusable.
| Quadrant | # 1 sec bins | Bins with >0 counts | Bins with >2000 counts | High rate bins dominated by noise | Noise dominated (total time) | Noise dominated (detector-on time) | Marked lightcurve |
|---|---|---|---|---|---|---|---|
| A | 8496 | 7827 | 0 | 0 | 0.00% | 0.00% | 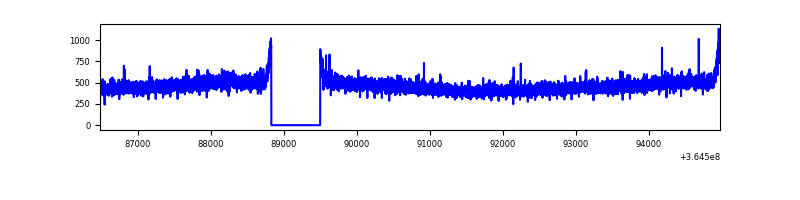 |
| B | 8496 | 7826 | 512 | 512 | 6.03% | 6.54% | 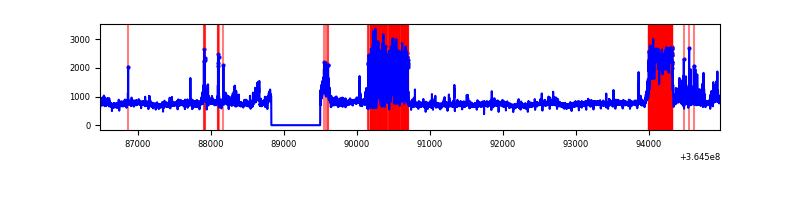 |
| C | 8496 | 7827 | 8 | 8 | 0.09% | 0.10% | 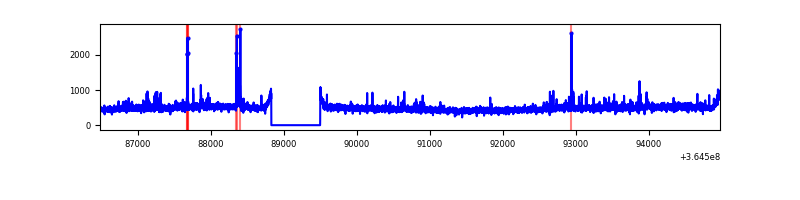 |
| D | 8497 | 7827 | 59 | 59 | 0.69% | 0.75% | 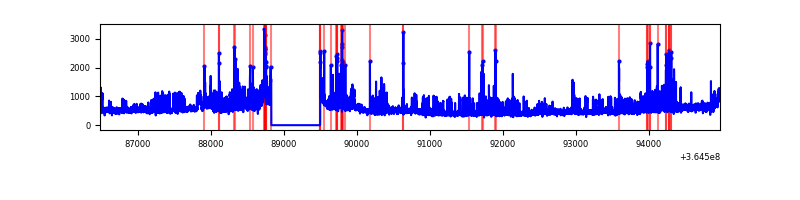 |
Top three noisy pixels from each quadrant. If the there are fewer than three noisy pixels in the level2.evt file, extra rows are filled as -1
| Pixel properties | Quadrant properties | ||||||
|---|---|---|---|---|---|---|---|
| Quadrant | DetID | PixID | Counts | Sigma | Mean | Median | Sigma |
| A | 13 | 254 | 16624 | 84.73 | 934 | 914 | 185.4 |
| A | 3 | 137 | 9600 | 46.85 | 934 | 914 | 185.4 |
| A | 0 | 226 | 7778 | 37.02 | 934 | 914 | 185.4 |
| B | 6 | 159 | 2111762 | 12392.17 | 873 | 848 | 170.3 |
| B | 12 | 1 | 1482073 | 8695.57 | 873 | 848 | 170.3 |
| B | 4 | 80 | 119648 | 697.42 | 873 | 848 | 170.3 |
| C | 14 | 238 | 166917 | 787.81 | 903 | 907 | 210.7 |
| C | 3 | 233 | 108957 | 512.76 | 903 | 907 | 210.7 |
| C | 14 | 254 | 32966 | 152.14 | 903 | 907 | 210.7 |
| D | 8 | 195 | 679660 | 3137.26 | 910 | 887 | 216.4 |
| D | 1 | 52 | 223169 | 1027.38 | 910 | 887 | 216.4 |
| D | 12 | 218 | 130048 | 596.98 | 910 | 887 | 216.4 |
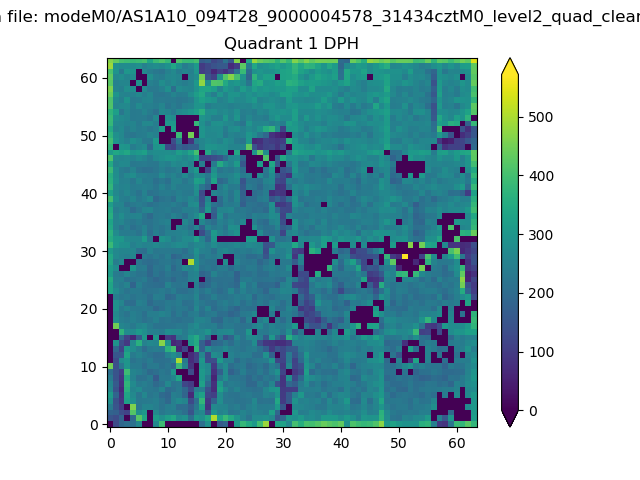
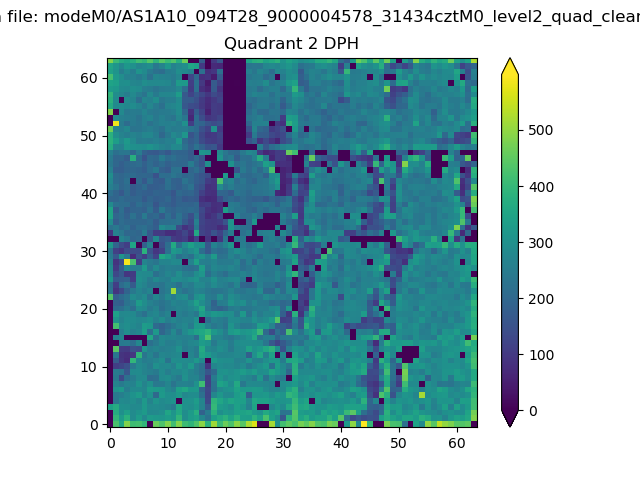
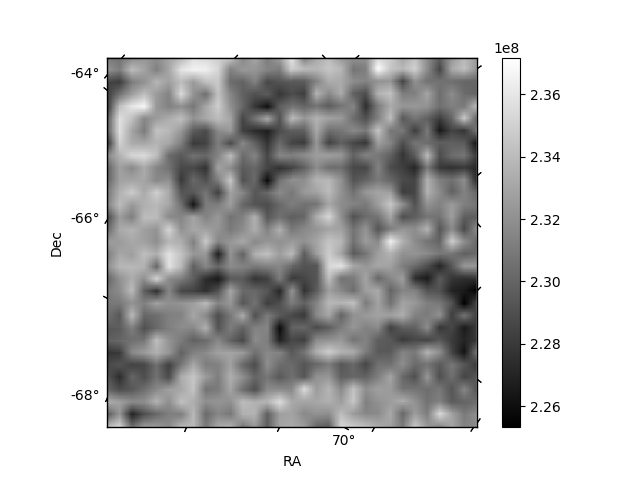
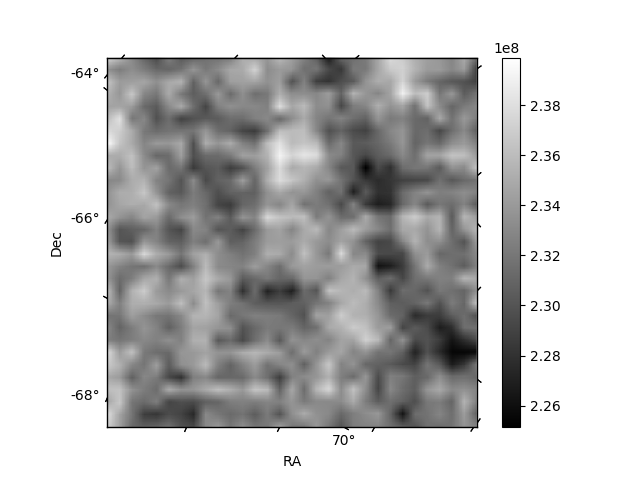
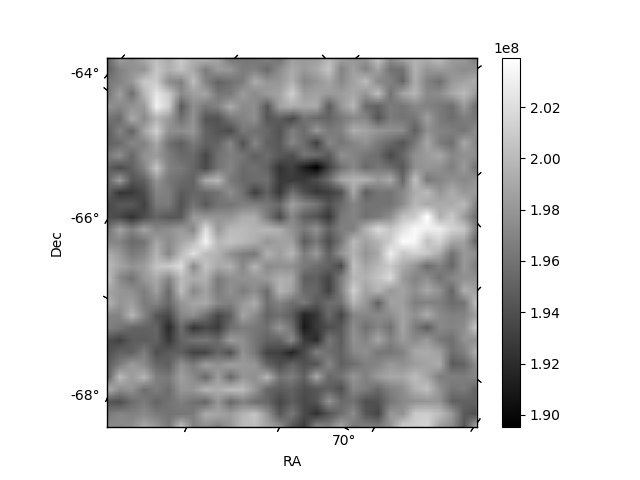
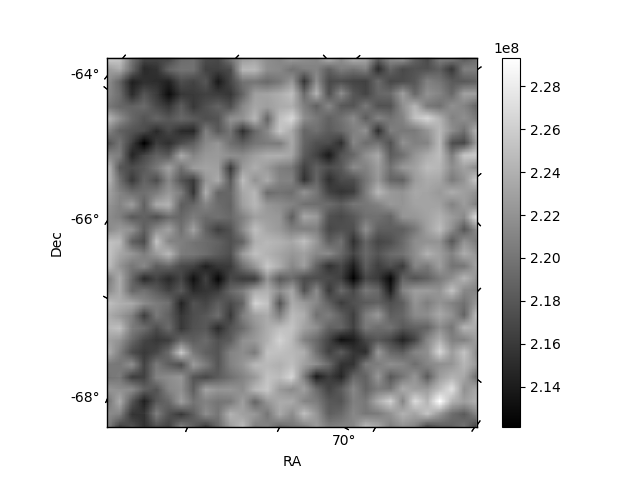
Histogram calculated using DETX and DETY for each event in the final _common_clean file
| Quadrant A |  |
 |
Quadrant B |
|---|---|---|---|
| Quadrant D |  |
 |
Quadrant C |
| Plot type | Count rate plots | Images |
|---|---|---|
| Comparison with Poisson distribution Blue bars denote a histogram of data divided into 1 sec bins. Red curve is a Poisson curve with rate = median count rate of data. |
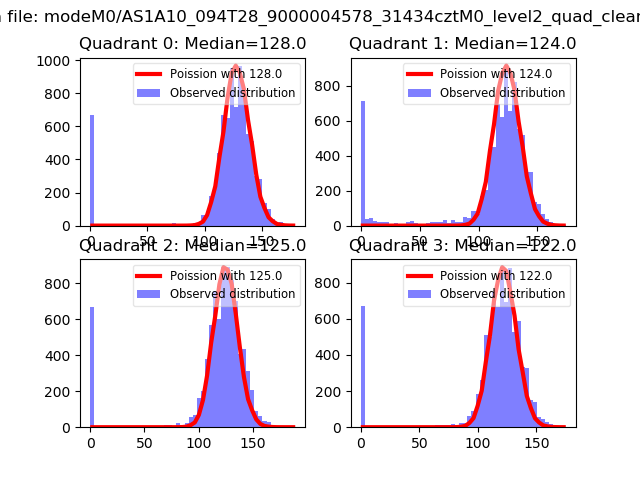 |
 |
| Quadrant-wise count rates Data is divided into 100 sec bins |
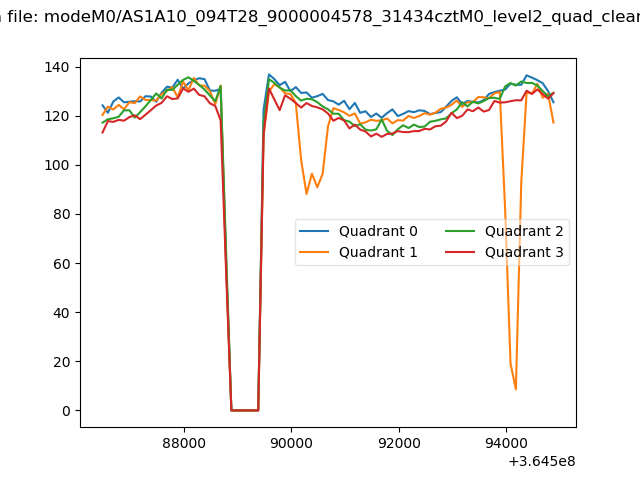 |
|
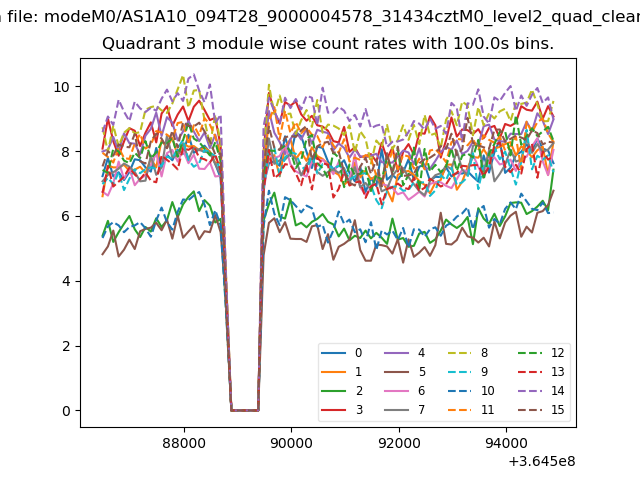
| Module-wise count rates for Quadrant A Data is divided into 100 sec bins |
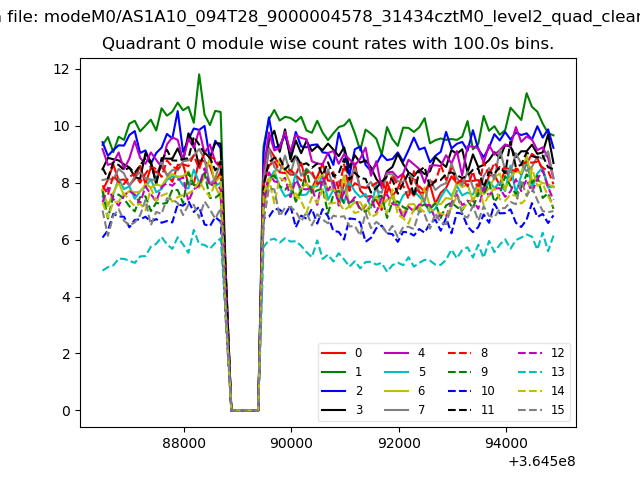 |
 |
| Module-wise count rates for Quadrant B Data is divided into 100 sec bins |
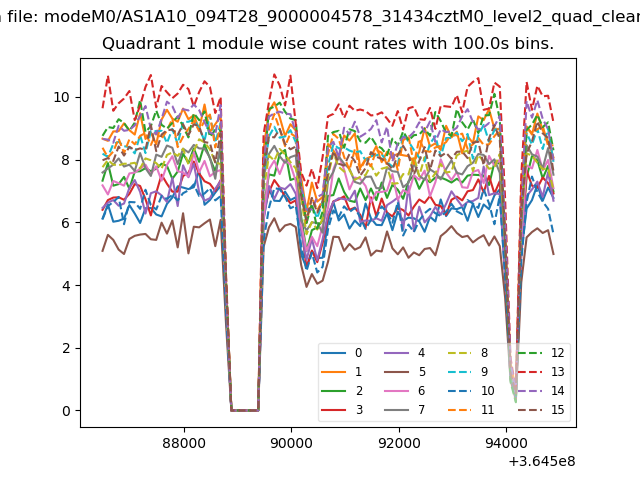 |
 |
| Module-wise count rates for Quadrant C Data is divided into 100 sec bins |
 |
 |
| Module-wise count rates for Quadrant D Data is divided into 100 sec bins |
 |
 |
| Parameter | Plot |
|---|---|
| CZT HV Monitor | 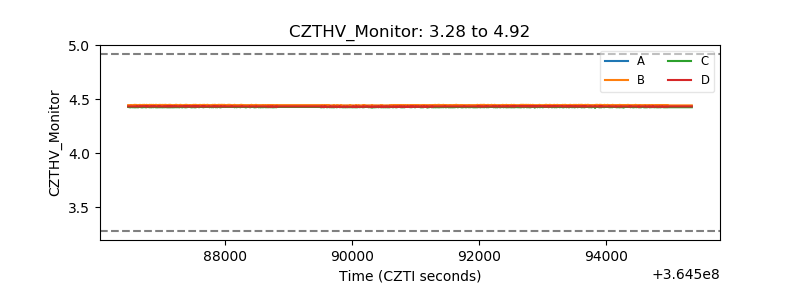 |
| D_VDD | 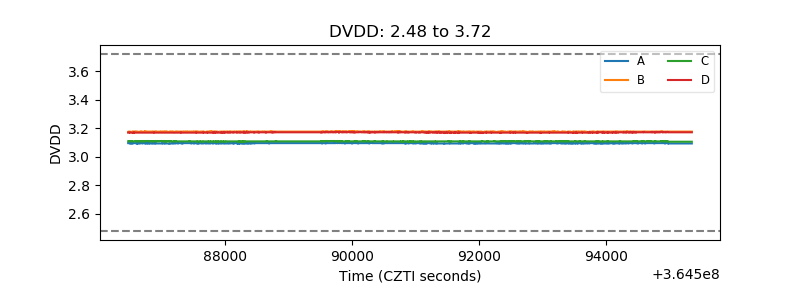 |
| Temperature 1 | 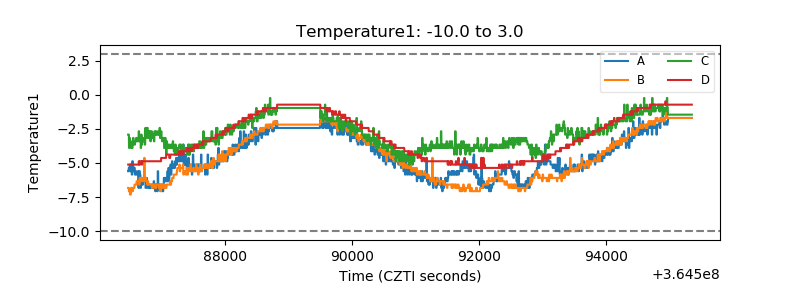 |
| Veto HV Monitor | 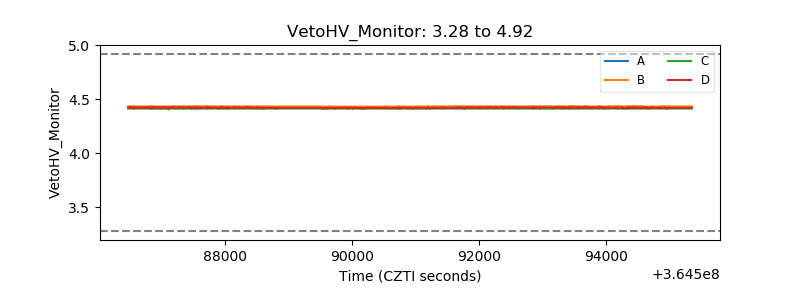 |
| Veto LLD | 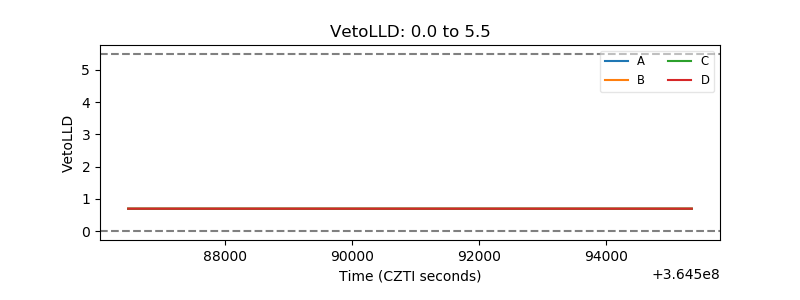 |
| Alpha Counter | 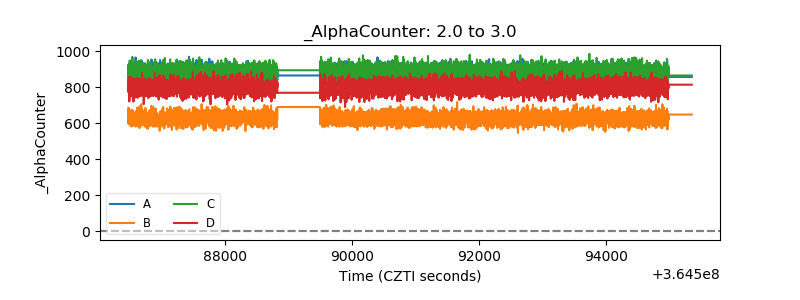 |
| _CPM_Rate | 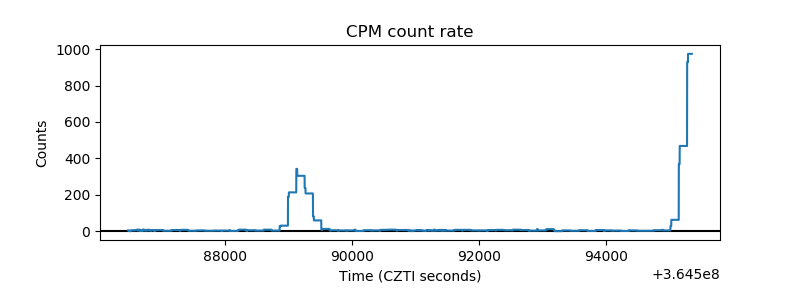 |
| CZT Counter | 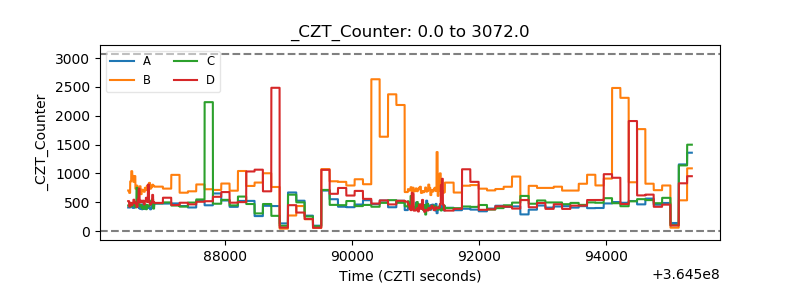 |
| +2.5 Volts monitor |  |
| +5 Volts monitor |  |
| _ROLL_ROT | 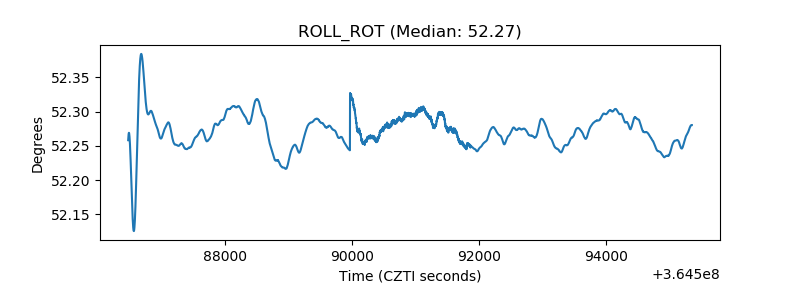 |
| _Roll_DEC | 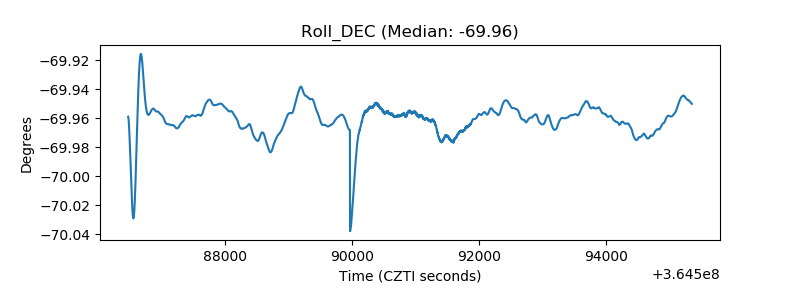 |
| _Roll_RA | 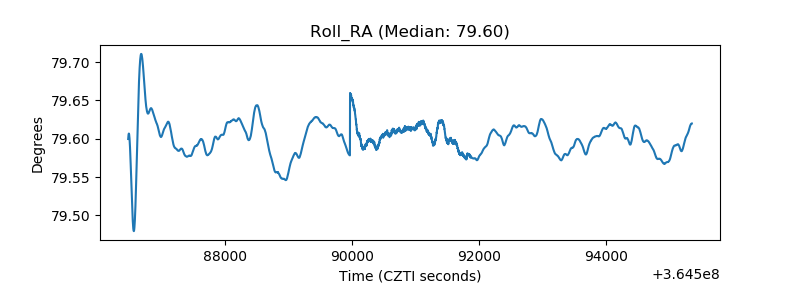 |
| Veto Counter | 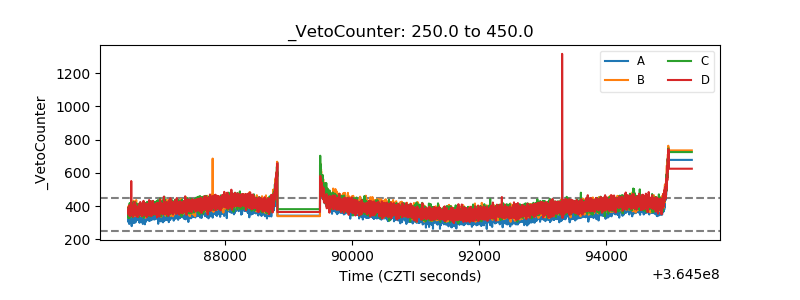 |