| Param | Original file | Final file |
|---|---|---|
| Filename | modeM0/AS1A10_094T31_9000004568cztM0_level2.fits | modeM0/AS1A10_094T31_9000004568cztM0_level2_quad_clean.evt |
| Size (bytes) | 52,081,920 | 58,187,520 |
| Size | 49.7 MB | 55.5 MB |
| Events in quadrant A | 318,756 | 363,268 |
| Events in quadrant B | 297,104 | 349,549 |
| Events in quadrant C | 311,146 | 349,360 |
| Events in quadrant D | 275,212 | 324,096 |
| Mode SS | |||
|---|---|---|---|
| Quadrant | BADHDUFLAG | Total packets | Discarded packets |
| A | 0 | 108 | 0 |
| B | 0 | 108 | 0 |
| C | 0 | 108 | 0 |
| D | 0 | 108 | 0 |
| Mode M9 | |||
|---|---|---|---|
| Quadrant | BADHDUFLAG | Total packets | Discarded packets |
| A | 0 | 9 | 0 |
| B | 0 | 9 | 0 |
| C | 0 | 9 | 0 |
| D | 0 | 9 | 0 |
| Mode M0 | |||
|---|---|---|---|
| Quadrant | BADHDUFLAG | Total packets | Discarded packets |
| A | 0 | 10972 | 0 |
| B | 0 | 16485 | 0 |
| C | 0 | 11216 | 0 |
| D | 0 | 13105 | 0 |
| Quadrant | Total seconds | Saturated seconds | Saturation percentage |
|---|---|---|---|
| A | 5362 | 91 | 1.697128% |
| B | 5362 | 165 | 3.077210% |
| C | 5362 | 148 | 2.760164% |
| D | 5362 | 116 | 2.163372% |
Noise dominated data is calculated using 1-second bins in cleaned event files. If a bin has >2000 counts, and if more than 50% of those come from <1% of pixels, then it is considered to be noise-dominated and hence unusable.
| Quadrant | # 1 sec bins | Bins with >0 counts | Bins with >2000 counts | High rate bins dominated by noise | Noise dominated (total time) | Noise dominated (detector-on time) | Marked lightcurve |
|---|---|---|---|---|---|---|---|
| A | 6202 | 5361 | 0 | 0 | 0.00% | 0.00% |  |
| B | 6202 | 5362 | 0 | 0 | 0.00% | 0.00% | 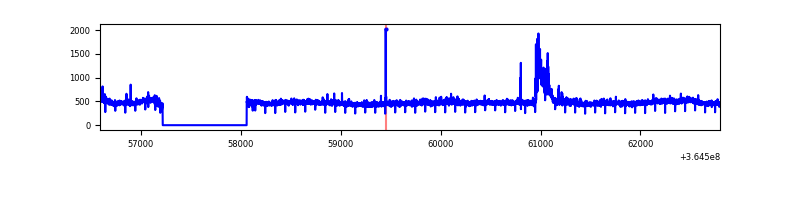 |
| C | 6202 | 5361 | 0 | 0 | 0.00% | 0.00% |  |
| D | 6202 | 5360 | 0 | 0 | 0.00% | 0.00% |  |
Top three noisy pixels from each quadrant. If the there are fewer than three noisy pixels in the level2.evt file, extra rows are filled as -1
| Pixel properties | Quadrant properties | ||||||
|---|---|---|---|---|---|---|---|
| Quadrant | DetID | PixID | Counts | Sigma | Mean | Median | Sigma |
| A | 0 | 29 | 317 | 10.76 | 83 | 78 | 22.2 |
| A | 14 | 95 | 267 | 8.51 | 83 | 78 | 22.2 |
| A | 7 | 110 | 245 | 7.52 | 83 | 78 | 22.2 |
| B | 2 | 9 | 234 | 9.12 | 78 | 75 | 17.4 |
| B | 5 | 255 | 204 | 7.4 | 78 | 75 | 17.4 |
| B | 5 | 225 | 203 | 7.34 | 78 | 75 | 17.4 |
| C | 1 | 81 | 249 | 7.64 | 82 | 77 | 22.5 |
| C | 3 | 203 | 246 | 7.5 | 82 | 77 | 22.5 |
| C | 1 | 80 | 234 | 6.97 | 82 | 77 | 22.5 |
| D | 3 | 14 | 213 | 6.22 | 78 | 71 | 22.8 |
| D | 7 | 3 | 210 | 6.09 | 78 | 71 | 22.8 |
| D | 7 | 5 | 209 | 6.04 | 78 | 71 | 22.8 |
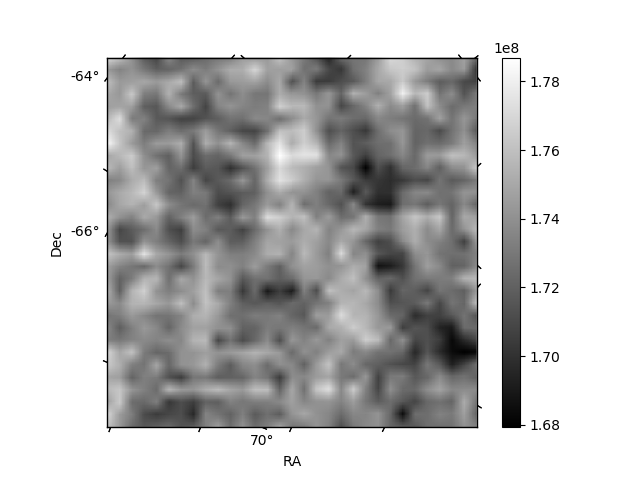
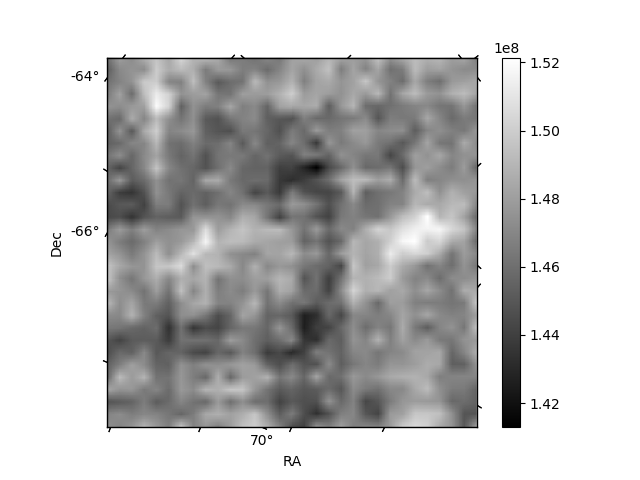
Histogram calculated using DETX and DETY for each event in the final _common_clean file
| Quadrant A |  |
 |
Quadrant B |
|---|---|---|---|
| Quadrant D |  |
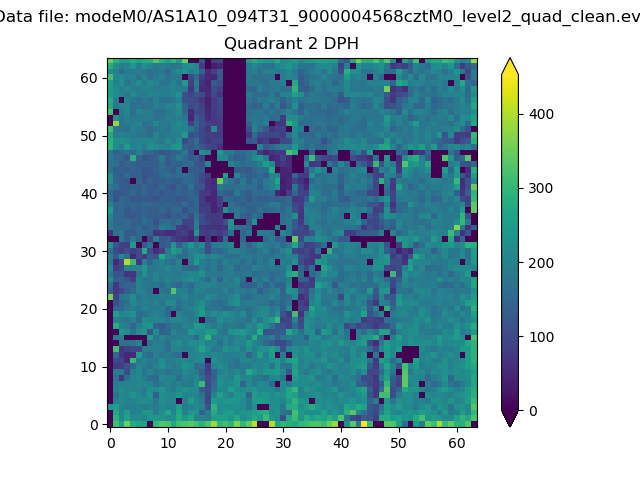 |
Quadrant C |
| Plot type | Count rate plots | Images |
|---|---|---|
| Comparison with Poisson distribution Blue bars denote a histogram of data divided into 1 sec bins. Red curve is a Poisson curve with rate = median count rate of data. |
 |
 |
| Quadrant-wise count rates Data is divided into 100 sec bins |
 |
|
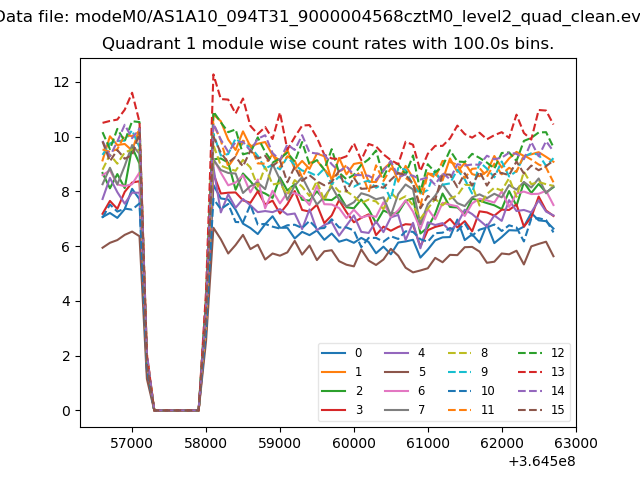
| Module-wise count rates for Quadrant A Data is divided into 100 sec bins |
 |
 |
| Module-wise count rates for Quadrant B Data is divided into 100 sec bins |
 |
 |
| Module-wise count rates for Quadrant C Data is divided into 100 sec bins |
 |
 |
| Module-wise count rates for Quadrant D Data is divided into 100 sec bins |
 |
 |
| Parameter | Plot |
|---|---|
| CZT HV Monitor | 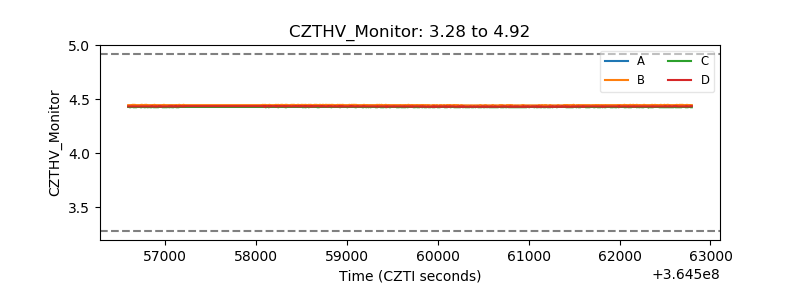 |
| D_VDD |  |
| Temperature 1 |  |
| Veto HV Monitor |  |
| Veto LLD |  |
| Alpha Counter |  |
| _CPM_Rate |  |
| CZT Counter |  |
| +2.5 Volts monitor | 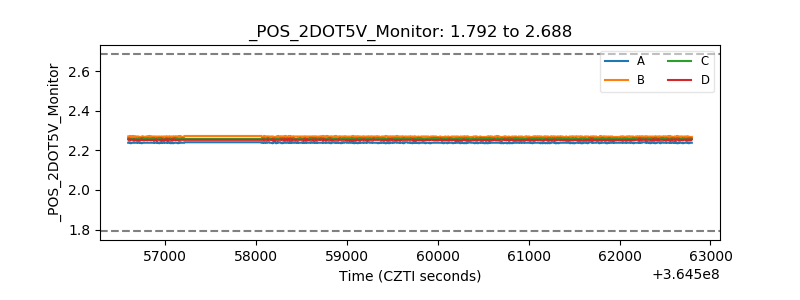 |
| +5 Volts monitor |  |
| _ROLL_ROT |  |
| _Roll_DEC | 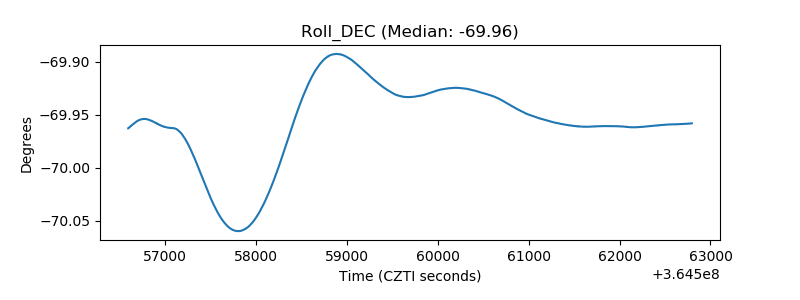 |
| _Roll_RA |  |
| Veto Counter |  |