| Param | Original file | Final file |
|---|---|---|
| Filename | modeM0/AS1A10_094T31_9000004568_31428cztM0_level2.evt | modeM0/AS1A10_094T31_9000004568_31428cztM0_level2_quad_clean.evt |
| Size (bytes) | 203,045,760 | 49,968,000 |
| Size | 193.6 MB | 47.7 MB |
| Events in quadrant A | 1,225,269 | 337,694 |
| Events in quadrant B | 1,874,093 | 336,403 |
| Events in quadrant C | 1,301,306 | 334,498 |
| Events in quadrant D | 1,578,706 | 326,729 |
| Mode SS | |||
|---|---|---|---|
| Quadrant | BADHDUFLAG | Total packets | Discarded packets |
| A | 0 | 50 | 0 |
| B | 0 | 50 | 0 |
| C | 0 | 50 | 0 |
| D | 0 | 50 | 0 |
| Mode M9 | |||
|---|---|---|---|
| Quadrant | BADHDUFLAG | Total packets | Discarded packets |
| A | 0 | 9 | 0 |
| B | 0 | 9 | 0 |
| C | 0 | 9 | 0 |
| D | 0 | 9 | 0 |
| Mode M0 | |||
|---|---|---|---|
| Quadrant | BADHDUFLAG | Total packets | Discarded packets |
| A | 0 | 5199 | 1 |
| B | 0 | 7519 | 1 |
| C | 0 | 5337 | 1 |
| D | 0 | 6228 | 1 |
| Quadrant | Total seconds | Saturated seconds | Saturation percentage |
|---|---|---|---|
| A | 2478 | 91 | 3.672316% |
| B | 2478 | 123 | 4.963680% |
| C | 2478 | 111 | 4.479419% |
| D | 2477 | 97 | 3.916027% |
Noise dominated data is calculated using 1-second bins in cleaned event files. If a bin has >2000 counts, and if more than 50% of those come from <1% of pixels, then it is considered to be noise-dominated and hence unusable.
| Quadrant | # 1 sec bins | Bins with >0 counts | Bins with >2000 counts | High rate bins dominated by noise | Noise dominated (total time) | Noise dominated (detector-on time) | Marked lightcurve |
|---|---|---|---|---|---|---|---|
| A | 3318 | 2478 | 0 | 0 | 0.00% | 0.00% |  |
| B | 3318 | 2479 | 3 | 3 | 0.09% | 0.12% | 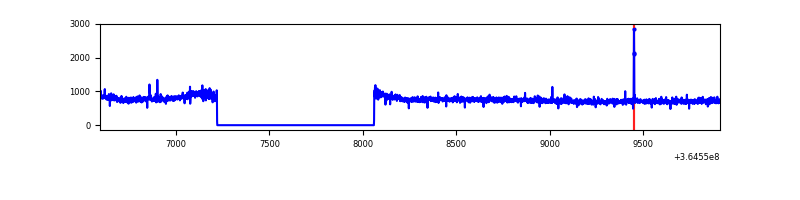 |
| C | 3318 | 2479 | 0 | 0 | 0.00% | 0.00% | 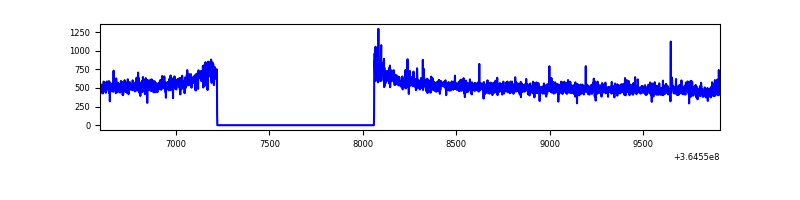 |
| D | 3317 | 2477 | 27 | 27 | 0.81% | 1.09% | 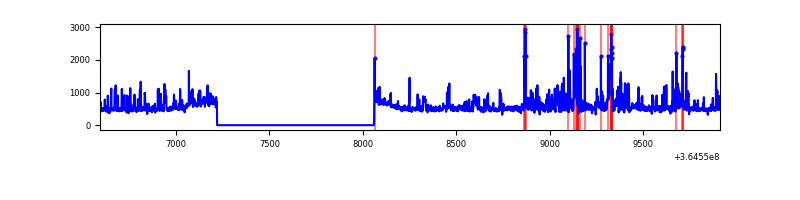 |
Top three noisy pixels from each quadrant. If the there are fewer than three noisy pixels in the level2.evt file, extra rows are filled as -1
| Pixel properties | Quadrant properties | ||||||
|---|---|---|---|---|---|---|---|
| Quadrant | DetID | PixID | Counts | Sigma | Mean | Median | Sigma |
| A | 13 | 254 | 4602 | 66.34 | 316 | 308 | 64.7 |
| A | 3 | 137 | 3339 | 46.83 | 316 | 308 | 64.7 |
| A | 0 | 226 | 2783 | 38.24 | 316 | 308 | 64.7 |
| B | 6 | 159 | 640509 | 10499.25 | 308 | 300 | 61.0 |
| B | 10 | 247 | 8018 | 126.57 | 308 | 300 | 61.0 |
| B | 12 | 111 | 7233 | 113.7 | 308 | 300 | 61.0 |
| C | 14 | 238 | 51833 | 698.5 | 309 | 309 | 73.8 |
| C | 3 | 233 | 29700 | 398.45 | 309 | 309 | 73.8 |
| C | 2 | 114 | 5782 | 74.2 | 309 | 309 | 73.8 |
| D | 8 | 195 | 162608 | 1991.0 | 312 | 303 | 81.5 |
| D | 12 | 218 | 106371 | 1301.14 | 312 | 303 | 81.5 |
| D | 10 | 203 | 36604 | 445.31 | 312 | 303 | 81.5 |
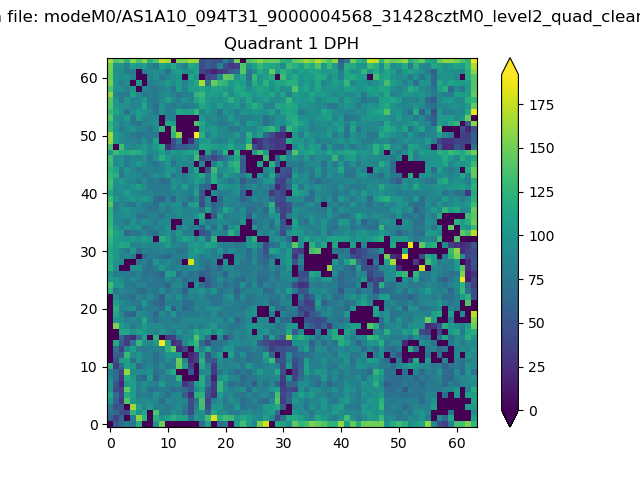
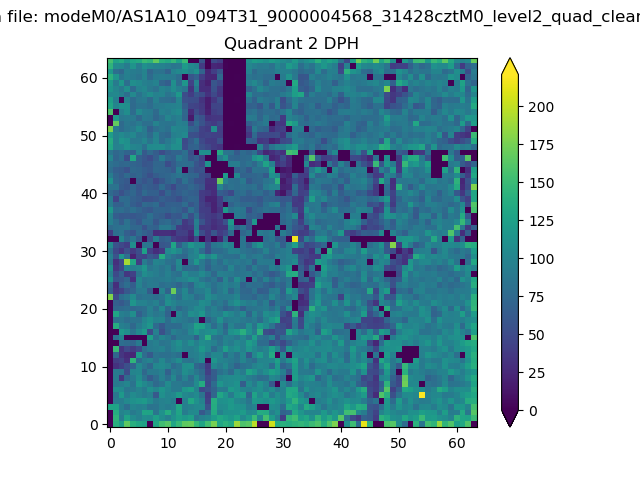
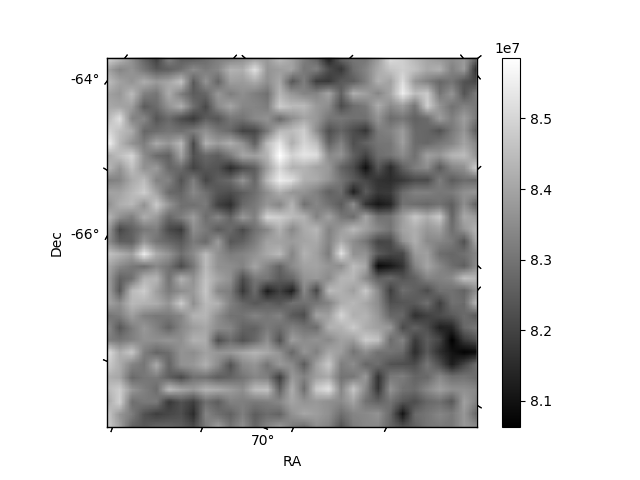
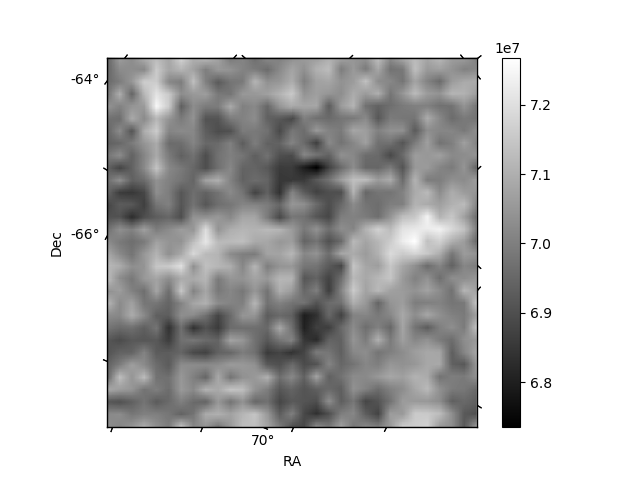
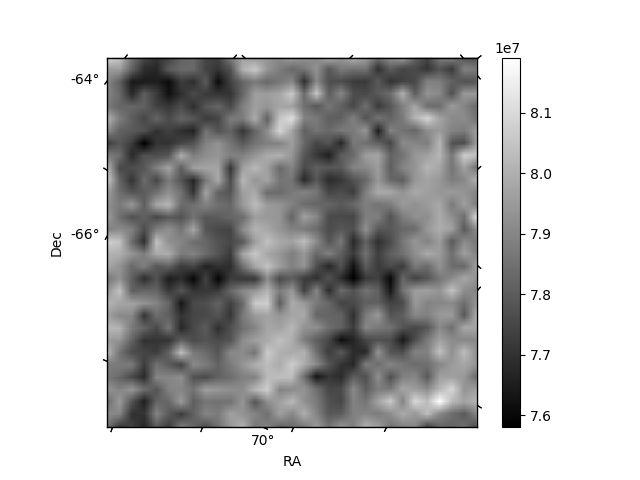
Histogram calculated using DETX and DETY for each event in the final _common_clean file
| Quadrant A | 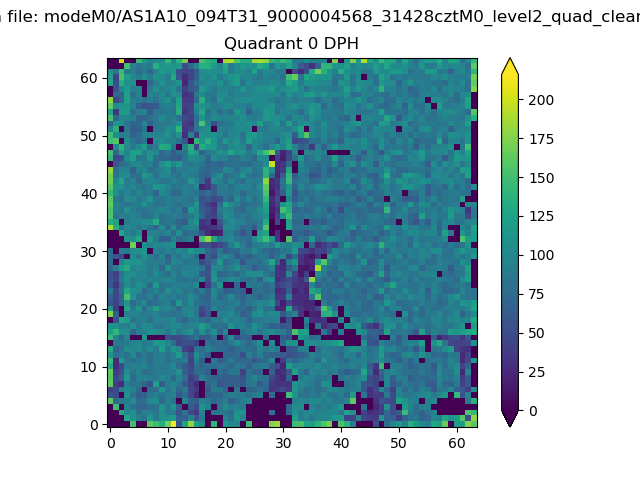 |
 |
Quadrant B |
|---|---|---|---|
| Quadrant D | 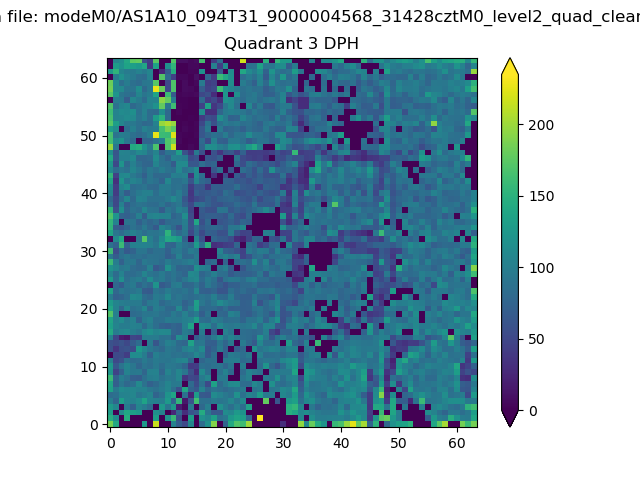 |
 |
Quadrant C |
| Plot type | Count rate plots | Images |
|---|---|---|
| Comparison with Poisson distribution Blue bars denote a histogram of data divided into 1 sec bins. Red curve is a Poisson curve with rate = median count rate of data. |
 |
 |
| Quadrant-wise count rates Data is divided into 100 sec bins |
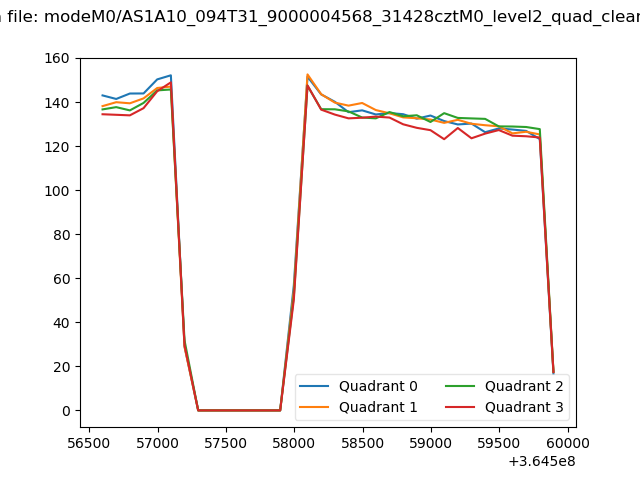 |
|
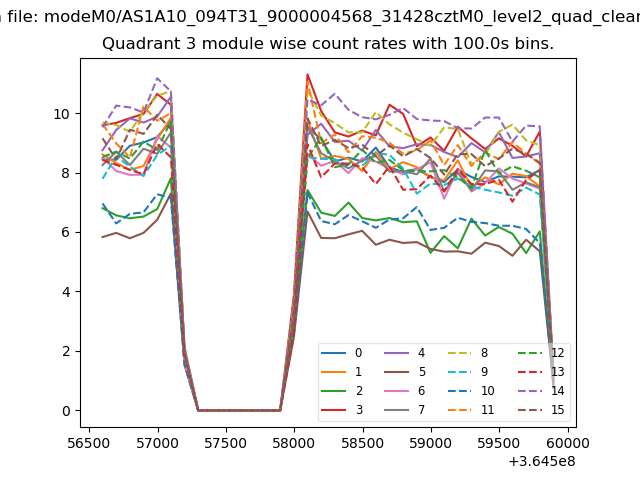
| Module-wise count rates for Quadrant A Data is divided into 100 sec bins |
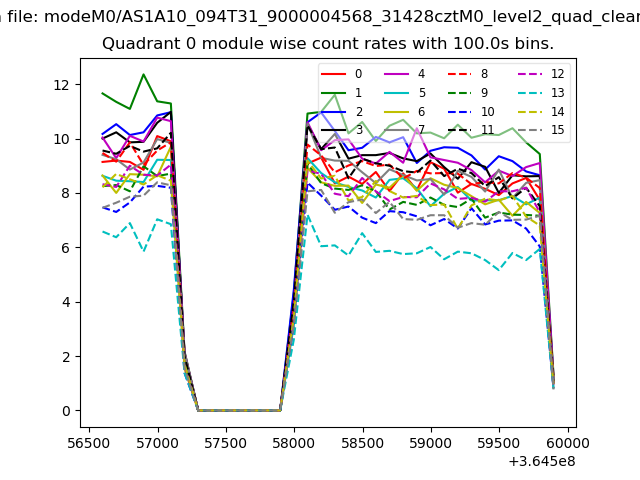 |
 |
| Module-wise count rates for Quadrant B Data is divided into 100 sec bins |
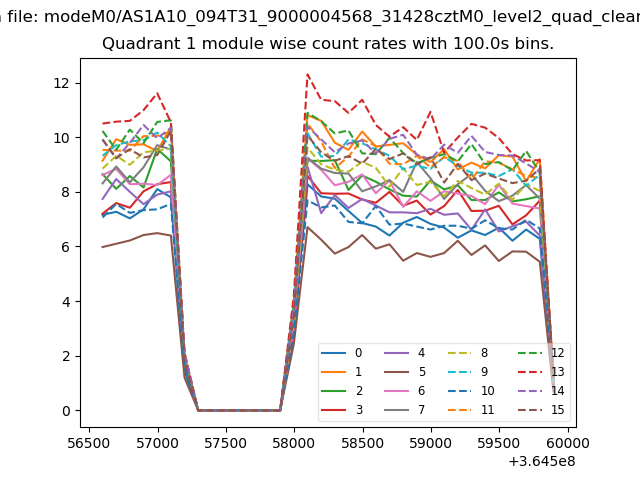 |
 |
| Module-wise count rates for Quadrant C Data is divided into 100 sec bins |
 |
 |
| Module-wise count rates for Quadrant D Data is divided into 100 sec bins |
 |
 |
| Parameter | Plot |
|---|---|
| CZT HV Monitor |  |
| D_VDD | 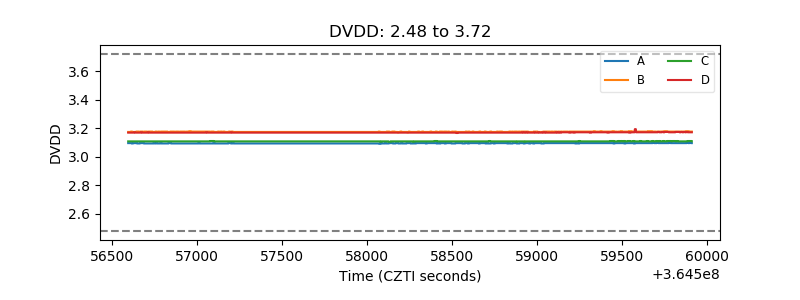 |
| Temperature 1 | 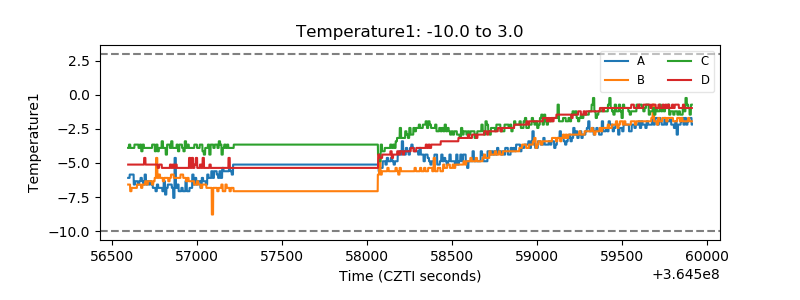 |
| Veto HV Monitor | 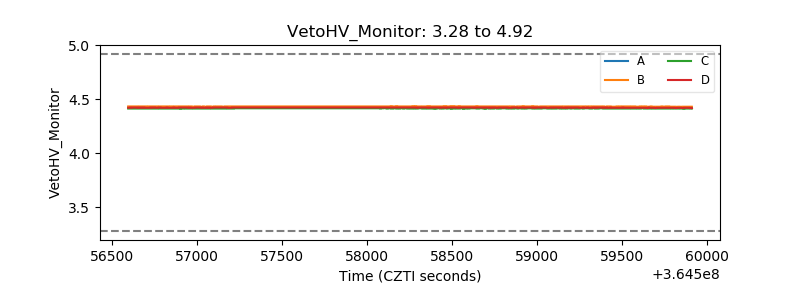 |
| Veto LLD | 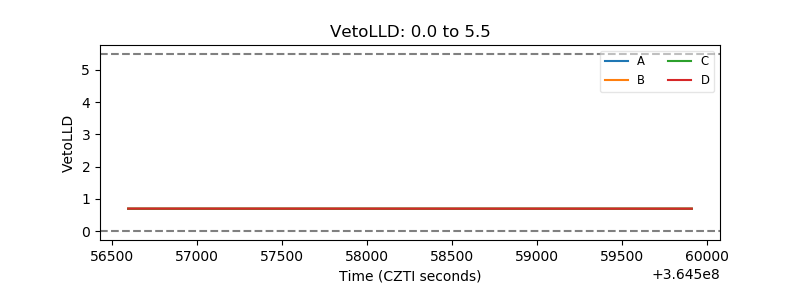 |
| Alpha Counter | 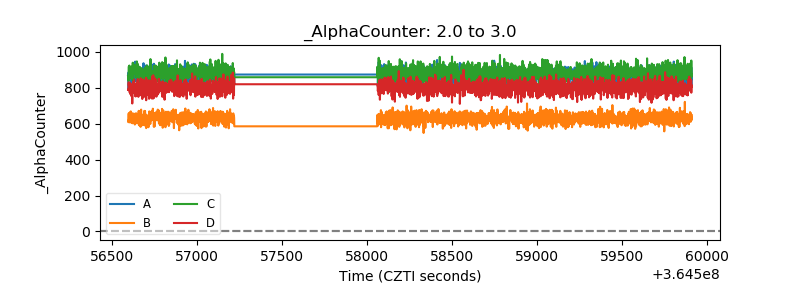 |
| _CPM_Rate | 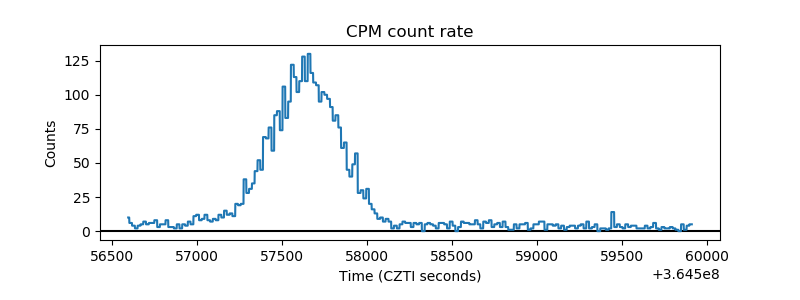 |
| CZT Counter | 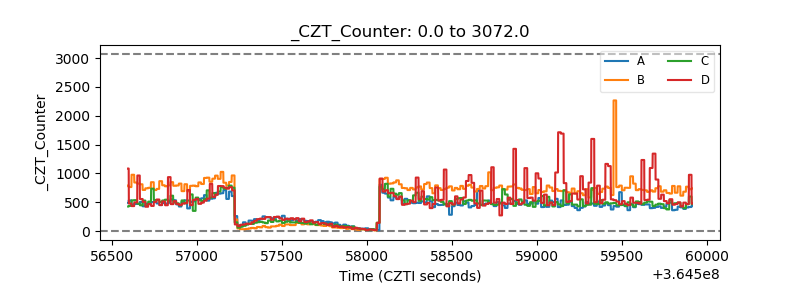 |
| +2.5 Volts monitor | 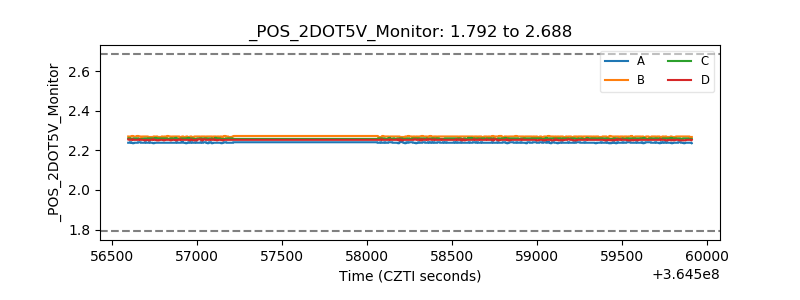 |
| +5 Volts monitor |  |
| _ROLL_ROT | 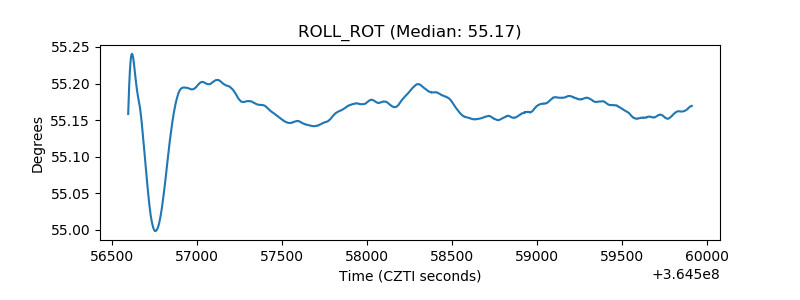 |
| _Roll_DEC | 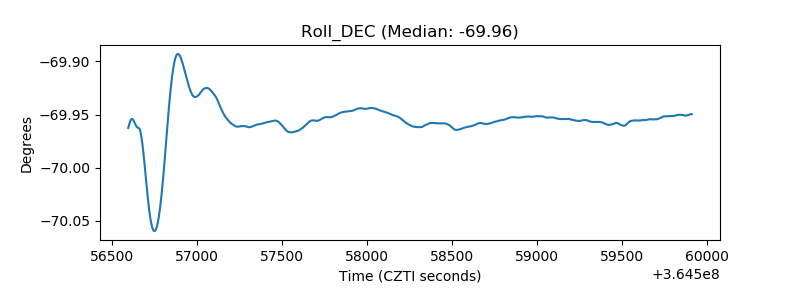 |
| _Roll_RA | 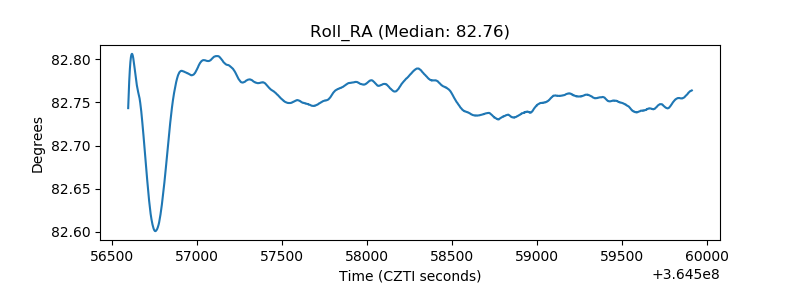 |
| Veto Counter | 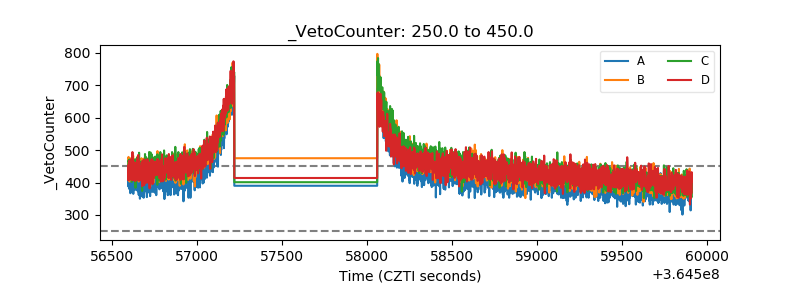 |