| Param | Original file | Final file |
|---|---|---|
| Filename | modeM0/AS1A10_094T31_9000004568_31429cztM0_level2.evt | modeM0/AS1A10_094T31_9000004568_31429cztM0_level2_quad_clean.evt |
| Size (bytes) | 308,891,520 | 76,749,120 |
| Size | 294.6 MB | 73.2 MB |
| Events in quadrant A | 1,769,159 | 517,783 |
| Events in quadrant B | 3,017,770 | 508,340 |
| Events in quadrant C | 1,879,417 | 511,809 |
| Events in quadrant D | 2,414,690 | 503,067 |
| Mode SS | |||
|---|---|---|---|
| Quadrant | BADHDUFLAG | Total packets | Discarded packets |
| A | 0 | 80 | 0 |
| B | 0 | 80 | 0 |
| C | 0 | 80 | 0 |
| D | 0 | 80 | 0 |
| Mode M0 | |||
|---|---|---|---|
| Quadrant | BADHDUFLAG | Total packets | Discarded packets |
| A | 0 | 8042 | 0 |
| B | 0 | 12372 | 0 |
| C | 0 | 8175 | 0 |
| D | 0 | 9864 | 0 |
| Quadrant | Total seconds | Saturated seconds | Saturation percentage |
|---|---|---|---|
| A | 4017 | 2 | 0.049788% |
| B | 4018 | 46 | 1.144848% |
| C | 4018 | 41 | 1.020408% |
| D | 4018 | 44 | 1.095072% |
Noise dominated data is calculated using 1-second bins in cleaned event files. If a bin has >2000 counts, and if more than 50% of those come from <1% of pixels, then it is considered to be noise-dominated and hence unusable.
| Quadrant | # 1 sec bins | Bins with >0 counts | Bins with >2000 counts | High rate bins dominated by noise | Noise dominated (total time) | Noise dominated (detector-on time) | Marked lightcurve |
|---|---|---|---|---|---|---|---|
| A | 4017 | 4017 | 0 | 0 | 0.00% | 0.00% | 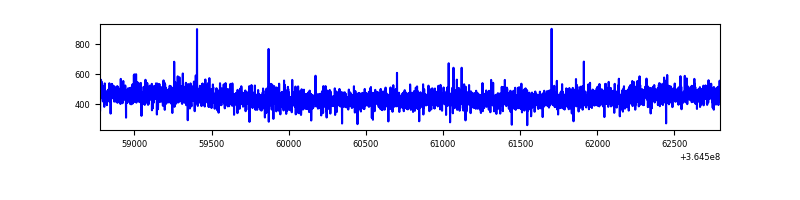 |
| B | 4018 | 4018 | 28 | 28 | 0.70% | 0.70% | 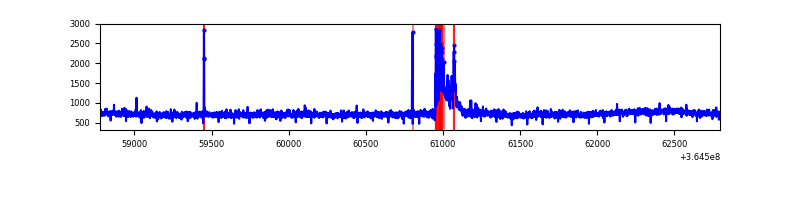 |
| C | 4018 | 4018 | 0 | 0 | 0.00% | 0.00% | 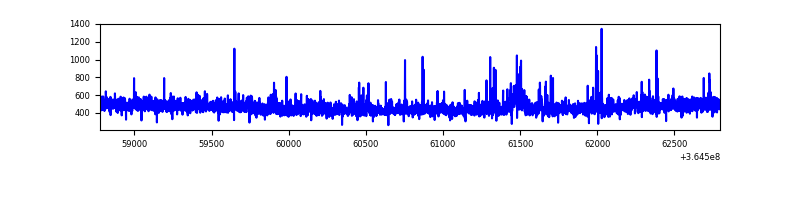 |
| D | 4018 | 4018 | 46 | 46 | 1.14% | 1.14% | 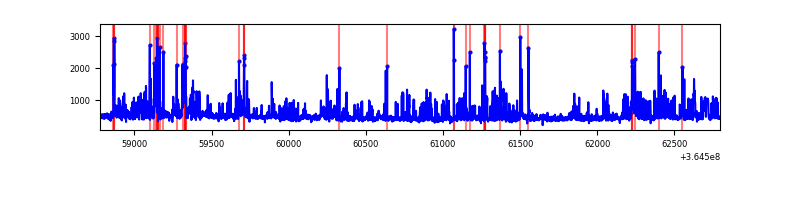 |
Top three noisy pixels from each quadrant. If the there are fewer than three noisy pixels in the level2.evt file, extra rows are filled as -1
| Pixel properties | Quadrant properties | ||||||
|---|---|---|---|---|---|---|---|
| Quadrant | DetID | PixID | Counts | Sigma | Mean | Median | Sigma |
| A | 13 | 254 | 8434 | 85.79 | 458 | 449 | 93.1 |
| A | 3 | 137 | 4529 | 43.84 | 458 | 449 | 93.1 |
| A | 0 | 226 | 3984 | 37.98 | 458 | 449 | 93.1 |
| B | 6 | 159 | 1076216 | 12332.88 | 449 | 436 | 87.2 |
| B | 12 | 1 | 124442 | 1421.62 | 449 | 436 | 87.2 |
| B | 0 | 190 | 24401 | 274.74 | 449 | 436 | 87.2 |
| C | 14 | 238 | 89099 | 858.8 | 437 | 440 | 103.2 |
| C | 3 | 233 | 45318 | 434.71 | 437 | 440 | 103.2 |
| C | 14 | 254 | 24970 | 237.61 | 437 | 440 | 103.2 |
| D | 8 | 195 | 342920 | 3224.94 | 442 | 430 | 106.2 |
| D | 12 | 218 | 162548 | 1526.53 | 442 | 430 | 106.2 |
| D | 10 | 203 | 44423 | 414.25 | 442 | 430 | 106.2 |
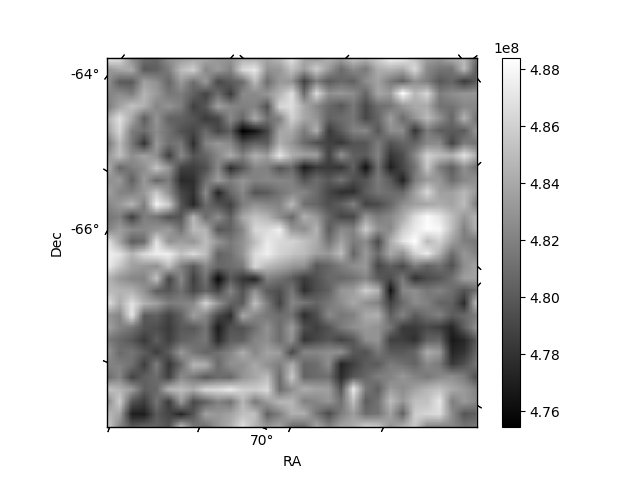
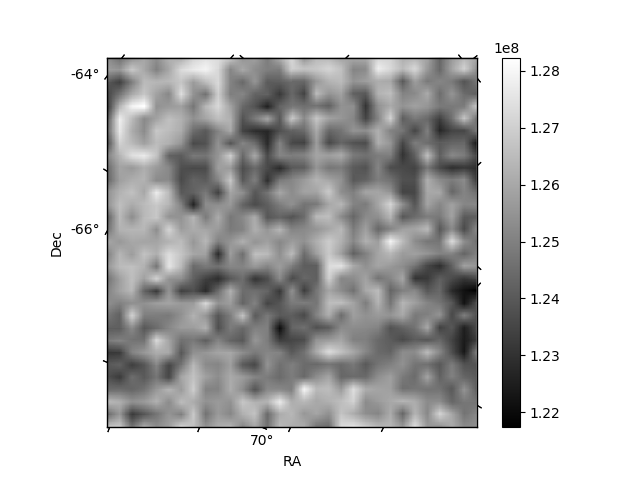
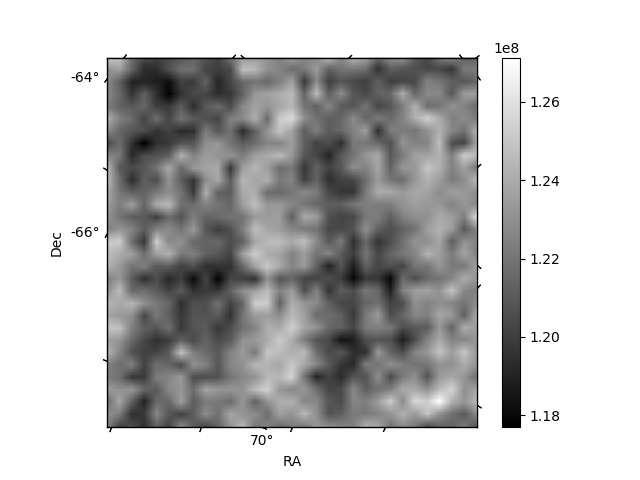
Histogram calculated using DETX and DETY for each event in the final _common_clean file
| Quadrant A | 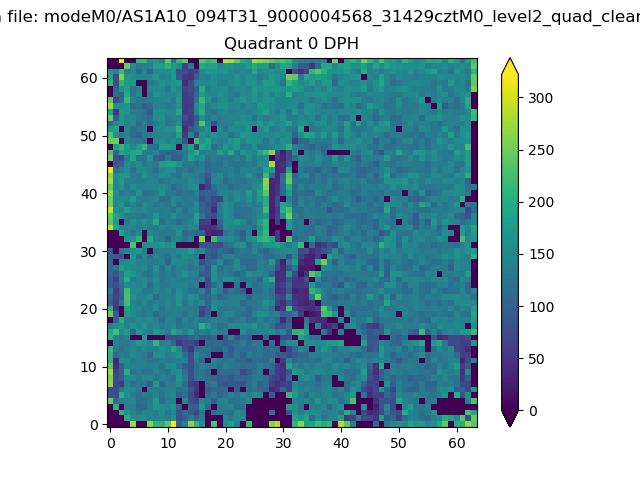 |
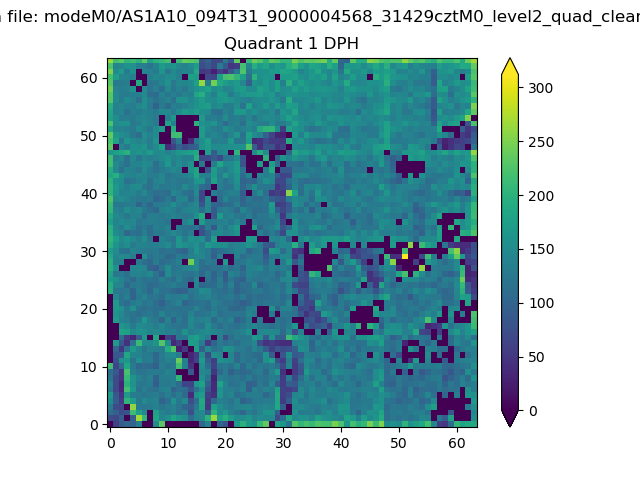 |
Quadrant B |
|---|---|---|---|
| Quadrant D |  |
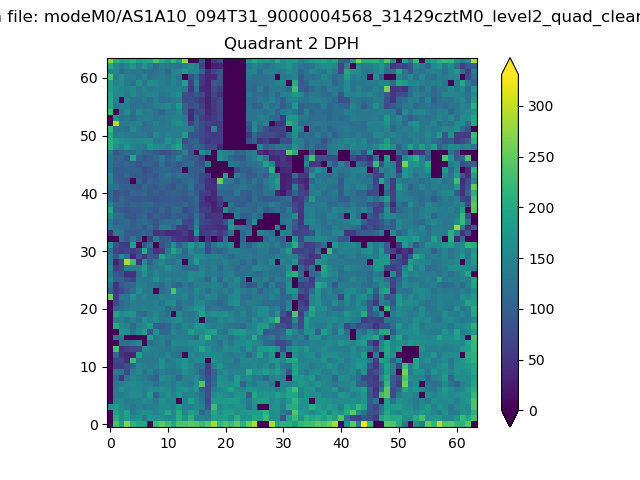 |
Quadrant C |
| Plot type | Count rate plots | Images |
|---|---|---|
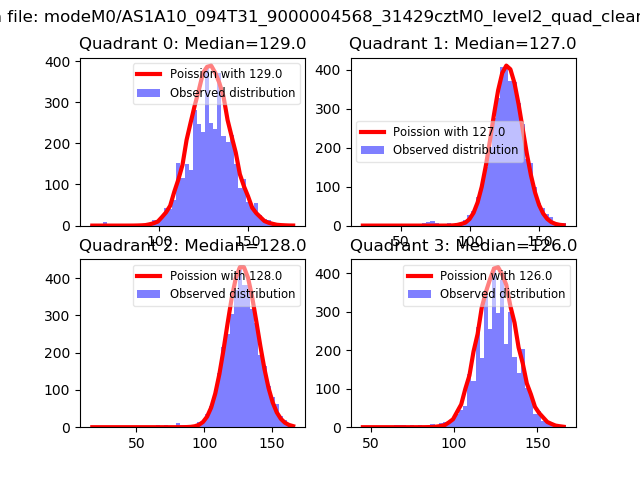
| Comparison with Poisson distribution Blue bars denote a histogram of data divided into 1 sec bins. Red curve is a Poisson curve with rate = median count rate of data. |
 |
 |
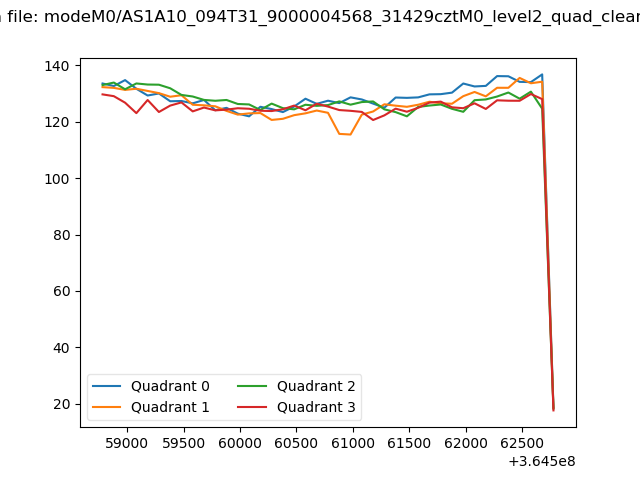
| Quadrant-wise count rates Data is divided into 100 sec bins |
 |
|
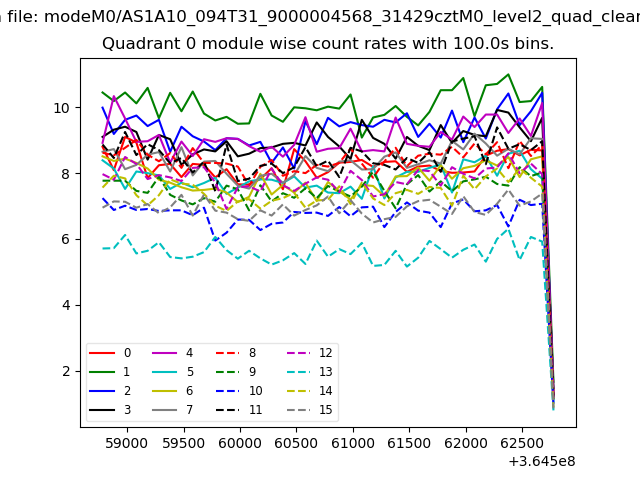
| Module-wise count rates for Quadrant A Data is divided into 100 sec bins |
 |
 |
| Module-wise count rates for Quadrant B Data is divided into 100 sec bins |
 |
 |
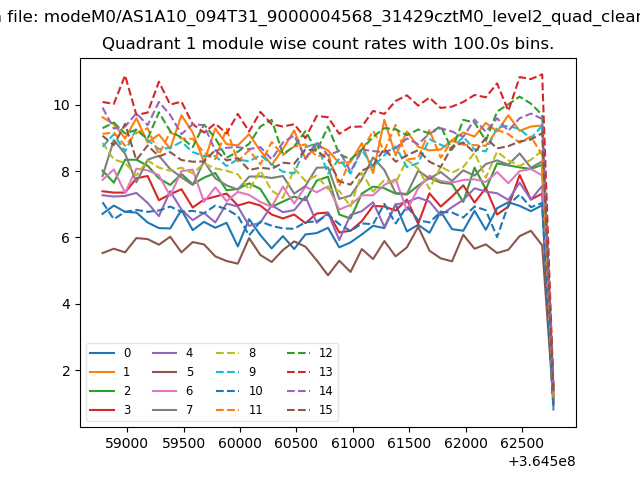
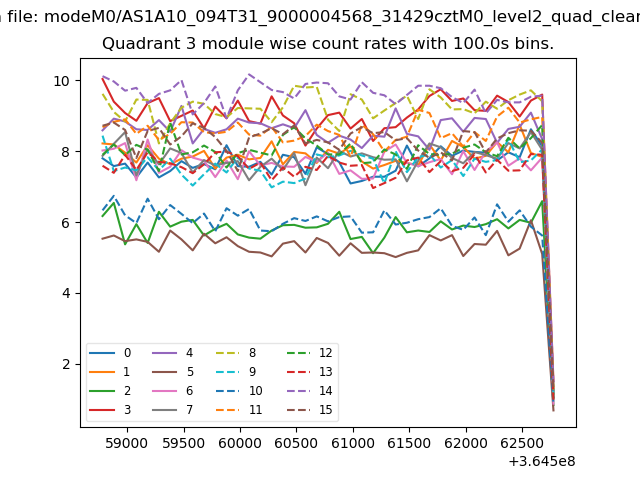
| Module-wise count rates for Quadrant C Data is divided into 100 sec bins |
 |
 |
| Module-wise count rates for Quadrant D Data is divided into 100 sec bins |
 |
 |
| Parameter | Plot |
|---|---|
| CZT HV Monitor | 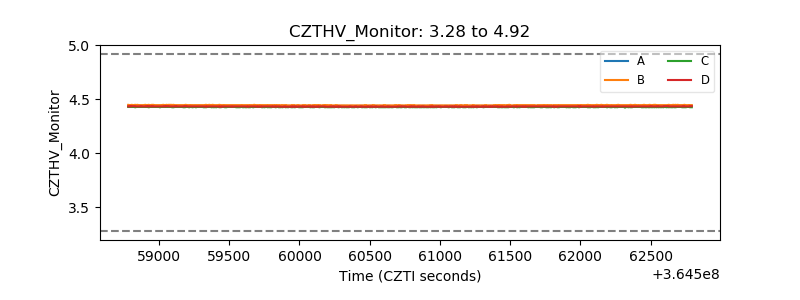 |
| D_VDD | 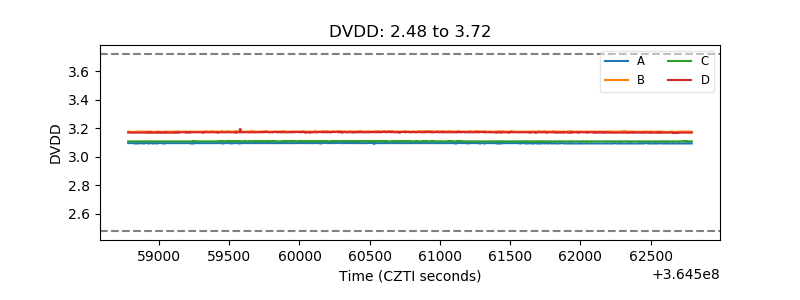 |
| Temperature 1 | 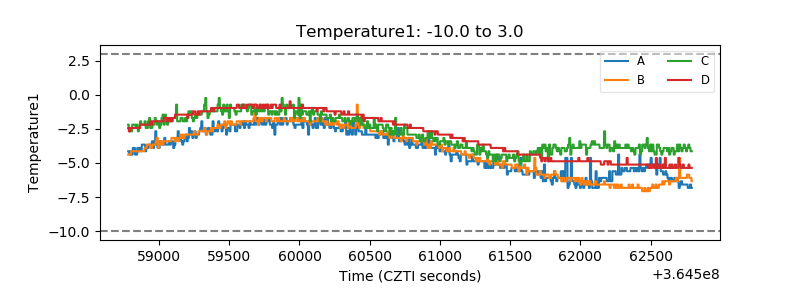 |
| Veto HV Monitor |  |
| Veto LLD | 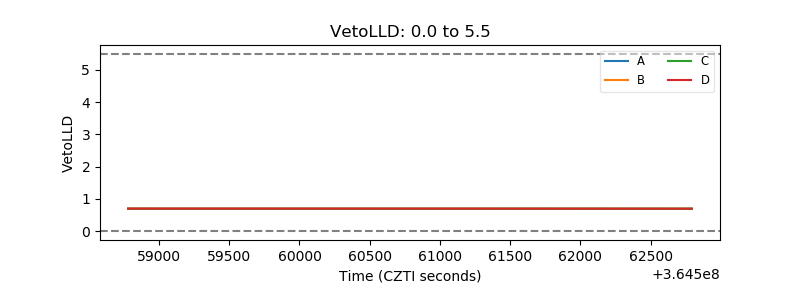 |
| Alpha Counter | 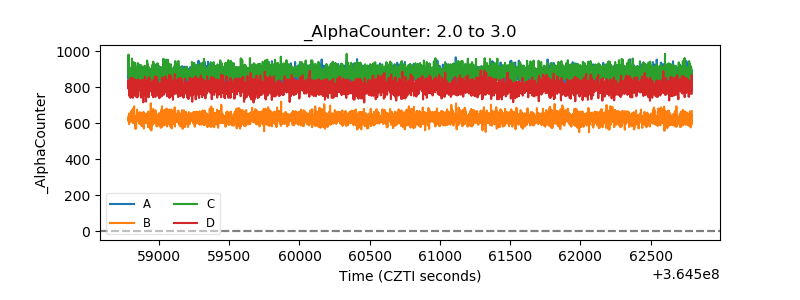 |
| _CPM_Rate | 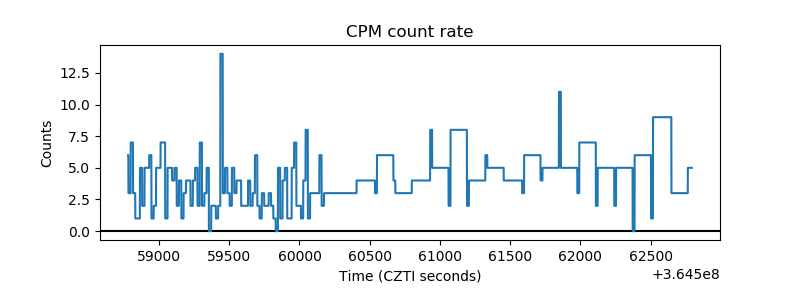 |
| CZT Counter | 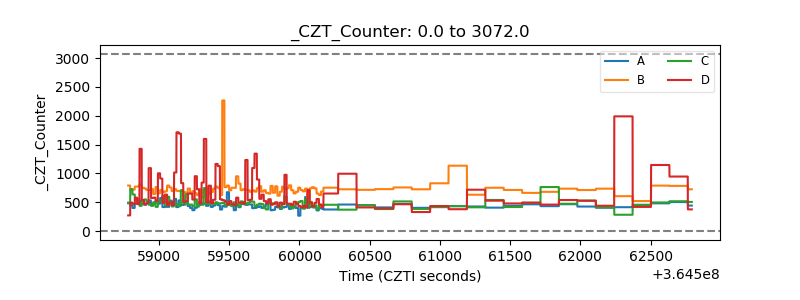 |
| +2.5 Volts monitor |  |
| +5 Volts monitor |  |
| _ROLL_ROT | 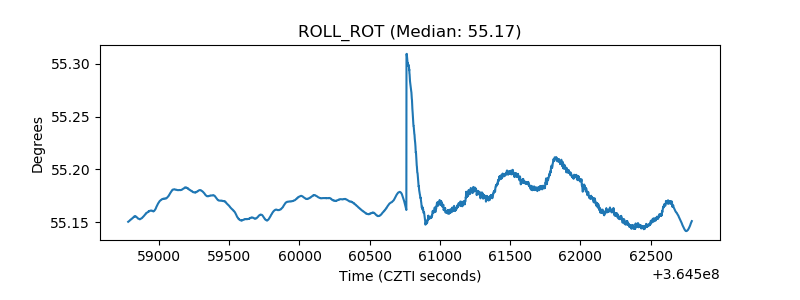 |
| _Roll_DEC | 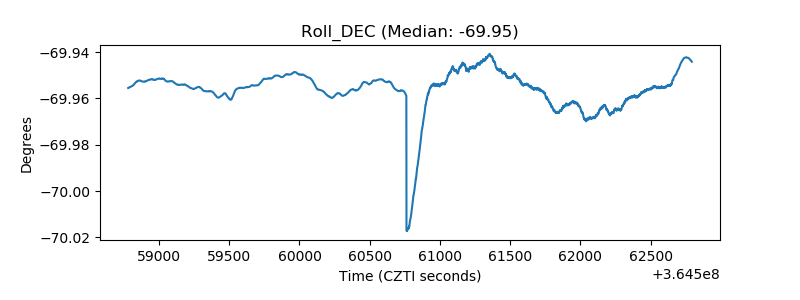 |
| _Roll_RA | 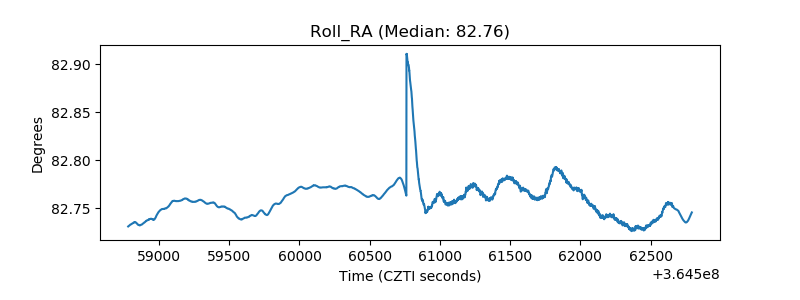 |
| Veto Counter | 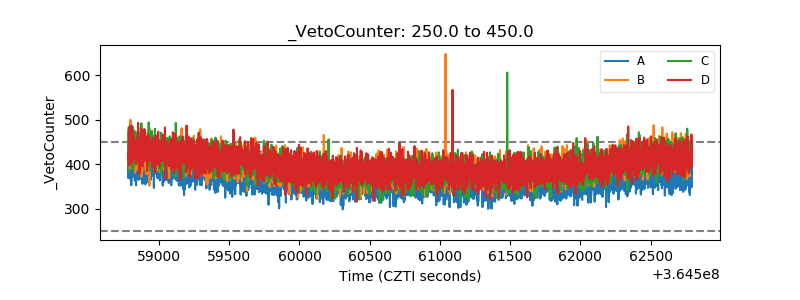 |