| Param | Original file | Final file |
|---|---|---|
| Filename | modeM0/AS1A10_094T32_9000004570cztM0_level2.fits | modeM0/AS1A10_094T32_9000004570cztM0_level2_quad_clean.evt |
| Size (bytes) | 49,069,440 | 67,536,000 |
| Size | 46.8 MB | 64.4 MB |
| Events in quadrant A | 299,210 | 444,848 |
| Events in quadrant B | 277,956 | 429,316 |
| Events in quadrant C | 289,764 | 421,950 |
| Events in quadrant D | 255,124 | 384,838 |
| Mode M0 | |||
|---|---|---|---|
| Quadrant | BADHDUFLAG | Total packets | Discarded packets |
| A | 0 | 10676 | 0 |
| B | 0 | 16663 | 0 |
| C | 0 | 10949 | 0 |
| D | 0 | 13419 | 0 |
| Mode SS | |||
|---|---|---|---|
| Quadrant | BADHDUFLAG | Total packets | Discarded packets |
| A | 0 | 108 | 0 |
| B | 0 | 108 | 0 |
| C | 0 | 108 | 0 |
| D | 0 | 108 | 0 |
| Mode M9 | |||
|---|---|---|---|
| Quadrant | BADHDUFLAG | Total packets | Discarded packets |
| A | 0 | 3 | 0 |
| B | 0 | 3 | 0 |
| C | 0 | 3 | 0 |
| D | 0 | 3 | 0 |
| Quadrant | Total seconds | Saturated seconds | Saturation percentage |
|---|---|---|---|
| A | 5185 | 167 | 3.220829% |
| B | 5185 | 298 | 5.747348% |
| C | 5185 | 332 | 6.403086% |
| D | 5185 | 309 | 5.959499% |
Noise dominated data is calculated using 1-second bins in cleaned event files. If a bin has >2000 counts, and if more than 50% of those come from <1% of pixels, then it is considered to be noise-dominated and hence unusable.
| Quadrant | # 1 sec bins | Bins with >0 counts | Bins with >2000 counts | High rate bins dominated by noise | Noise dominated (total time) | Noise dominated (detector-on time) | Marked lightcurve |
|---|---|---|---|---|---|---|---|
| A | 5540 | 5184 | 0 | 0 | 0.00% | 0.00% | 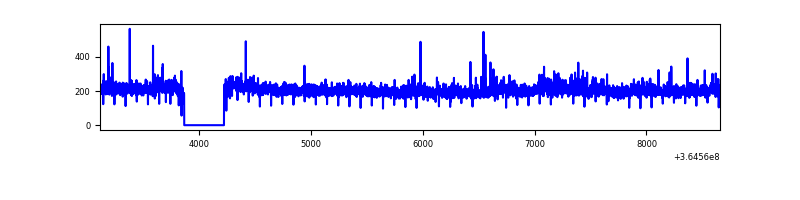 |
| B | 5540 | 5184 | 0 | 0 | 0.00% | 0.00% | 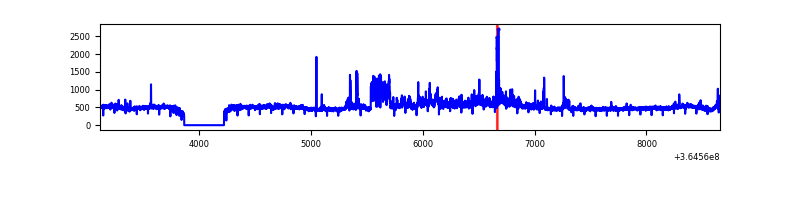 |
| C | 5540 | 5184 | 0 | 0 | 0.00% | 0.00% | 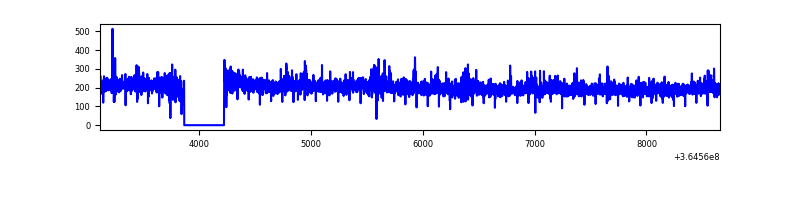 |
| D | 5540 | 5180 | 0 | 0 | 0.00% | 0.00% | 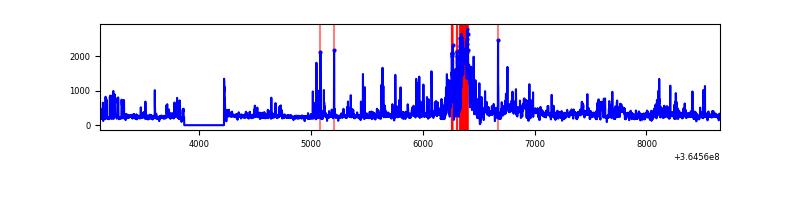 |
Top three noisy pixels from each quadrant. If the there are fewer than three noisy pixels in the level2.evt file, extra rows are filled as -1
| Pixel properties | Quadrant properties | ||||||
|---|---|---|---|---|---|---|---|
| Quadrant | DetID | PixID | Counts | Sigma | Mean | Median | Sigma |
| A | 0 | 29 | 289 | 10.31 | 78 | 73 | 20.9 |
| A | 0 | 30 | 245 | 8.21 | 78 | 73 | 20.9 |
| A | 7 | 110 | 243 | 8.12 | 78 | 73 | 20.9 |
| B | 2 | 9 | 209 | 8.17 | 73 | 70 | 17.0 |
| B | 3 | 17 | 199 | 7.59 | 73 | 70 | 17.0 |
| B | 14 | 254 | 193 | 7.23 | 73 | 70 | 17.0 |
| C | 1 | 81 | 246 | 8.26 | 76 | 72 | 21.1 |
| C | 2 | 191 | 227 | 7.36 | 76 | 72 | 21.1 |
| C | 1 | 80 | 215 | 6.79 | 76 | 72 | 21.1 |
| D | 15 | 47 | 210 | 6.71 | 72 | 66 | 21.5 |
| D | 6 | 62 | 191 | 5.82 | 72 | 66 | 21.5 |
| D | 15 | 63 | 188 | 5.68 | 72 | 66 | 21.5 |
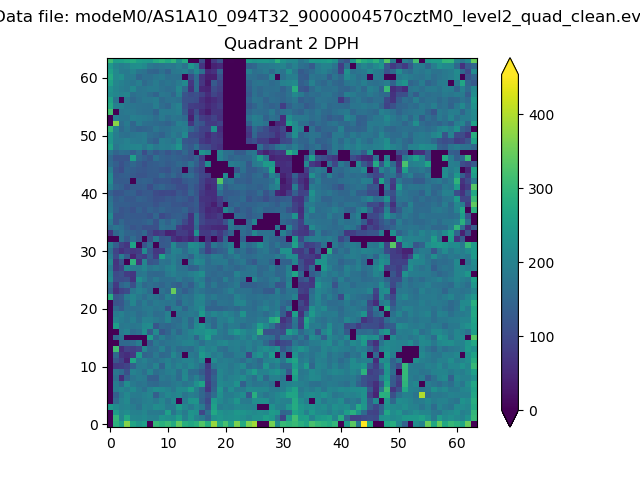
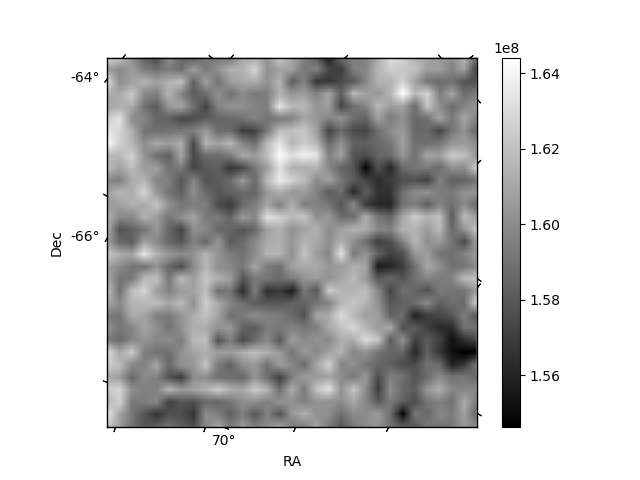
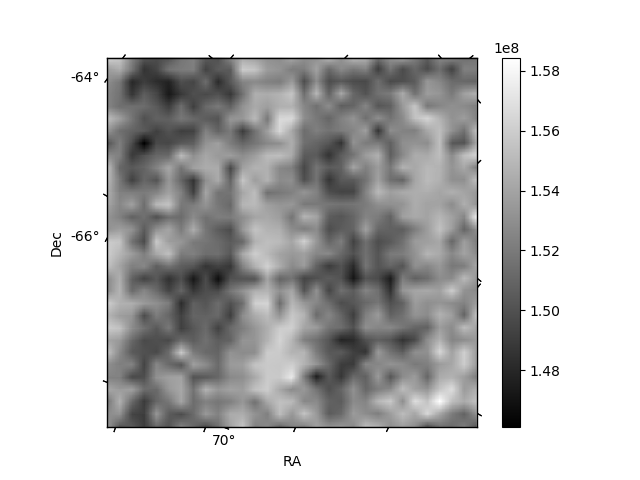
Histogram calculated using DETX and DETY for each event in the final _common_clean file
| Quadrant A | 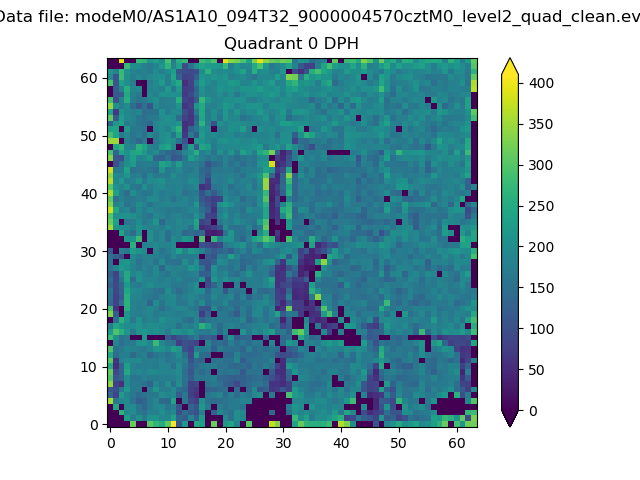 |
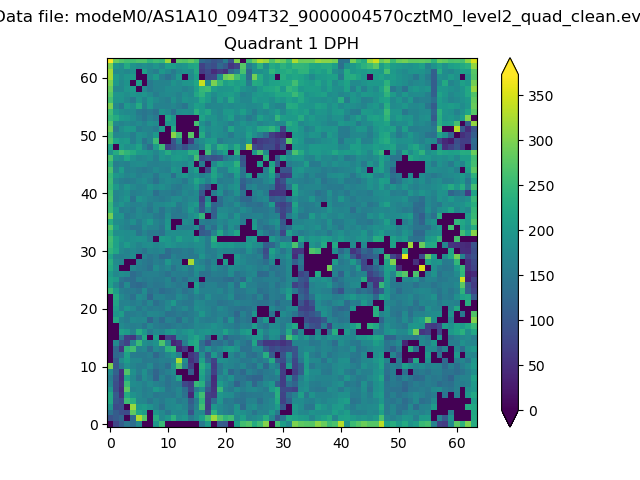 |
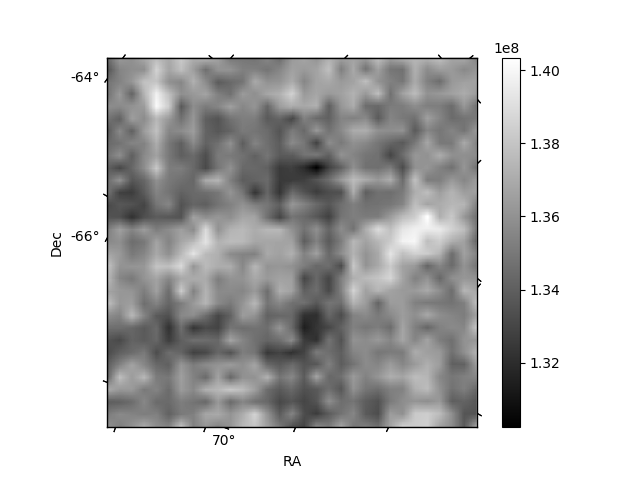
Quadrant B |
|---|---|---|---|
| Quadrant D | 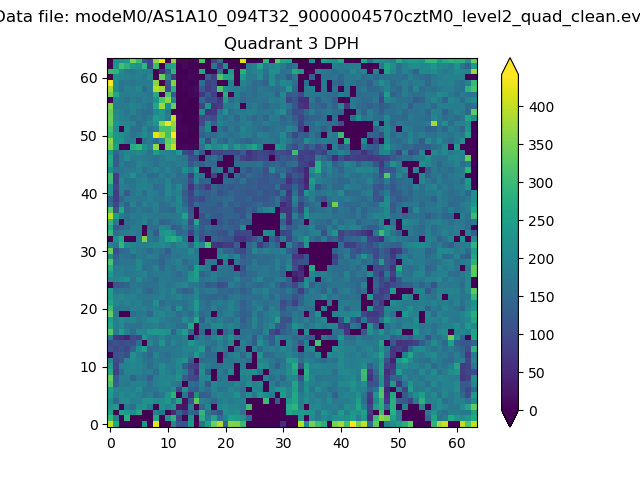 |
 |
Quadrant C |
| Plot type | Count rate plots | Images |
|---|---|---|
| Comparison with Poisson distribution Blue bars denote a histogram of data divided into 1 sec bins. Red curve is a Poisson curve with rate = median count rate of data. |
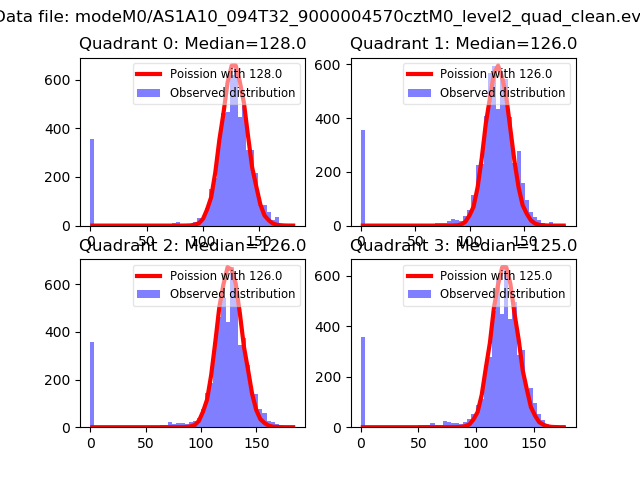 |
 |
| Quadrant-wise count rates Data is divided into 100 sec bins |
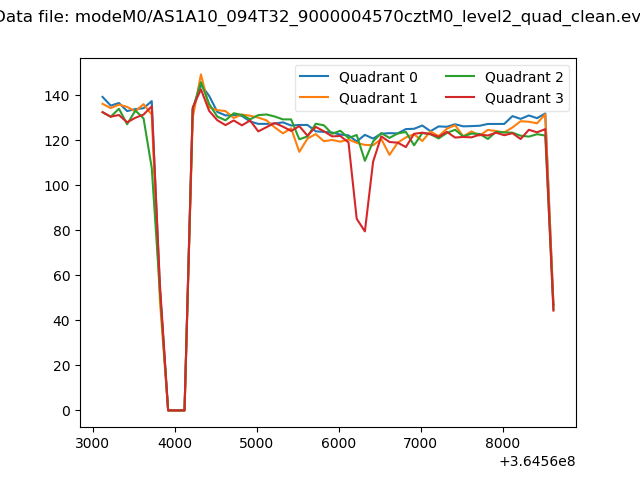 |
|
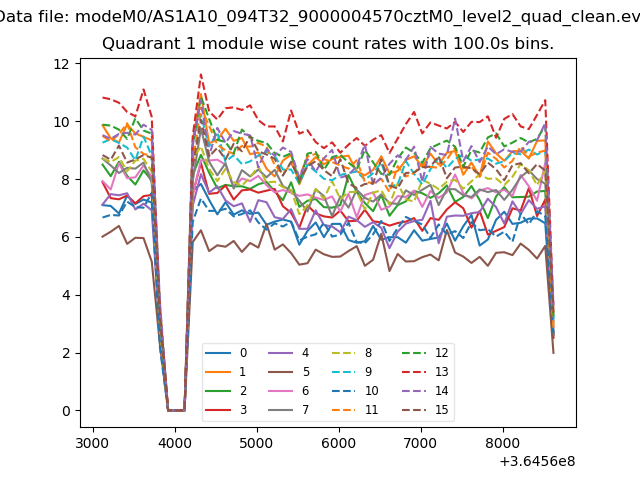
| Module-wise count rates for Quadrant A Data is divided into 100 sec bins |
 |
 |
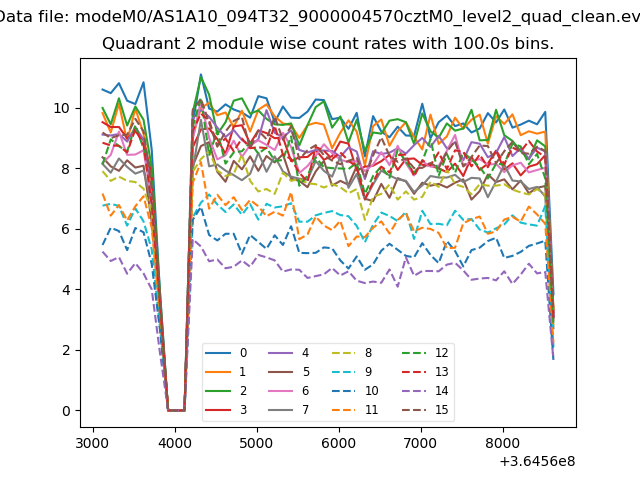
| Module-wise count rates for Quadrant B Data is divided into 100 sec bins |
 |
 |
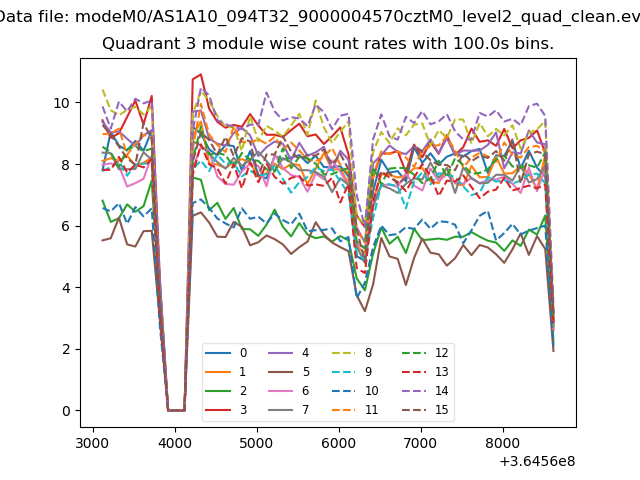
| Module-wise count rates for Quadrant C Data is divided into 100 sec bins |
 |
 |
| Module-wise count rates for Quadrant D Data is divided into 100 sec bins |
 |
 |
| Parameter | Plot |
|---|---|
| CZT HV Monitor | 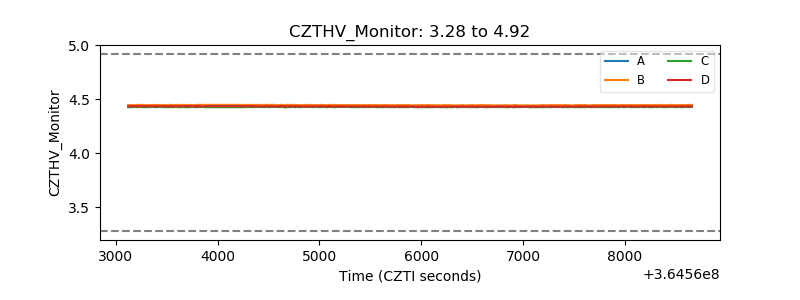 |
| D_VDD | 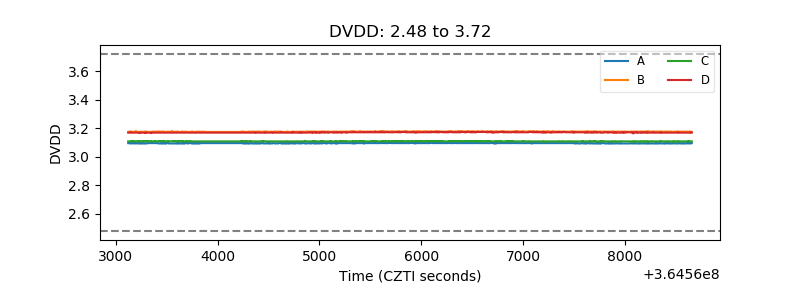 |
| Temperature 1 | 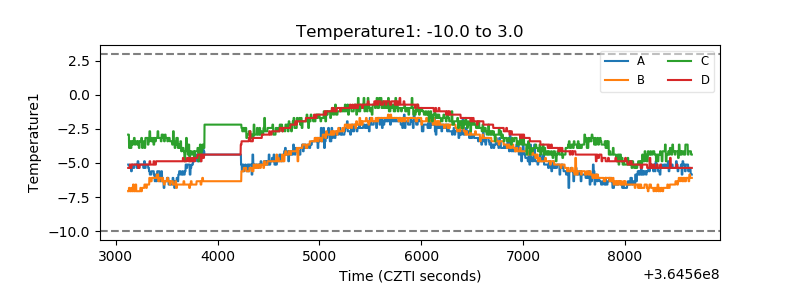 |
| Veto HV Monitor | 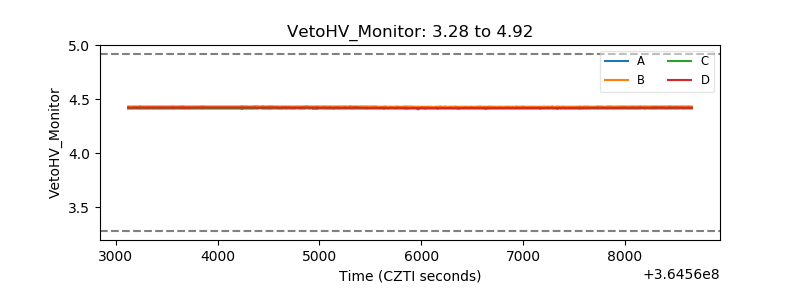 |
| Veto LLD | 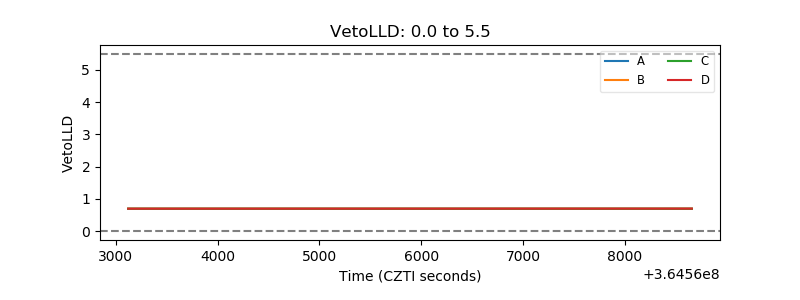 |
| Alpha Counter | 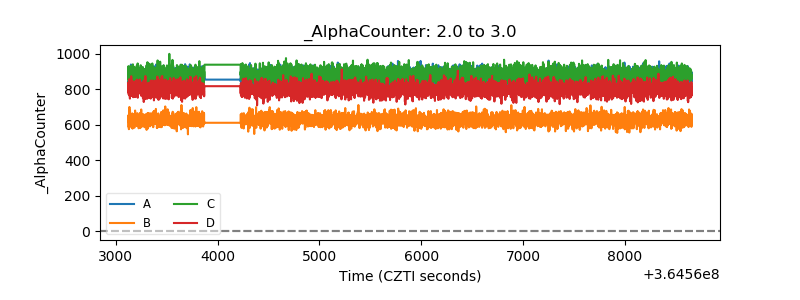 |
| _CPM_Rate | 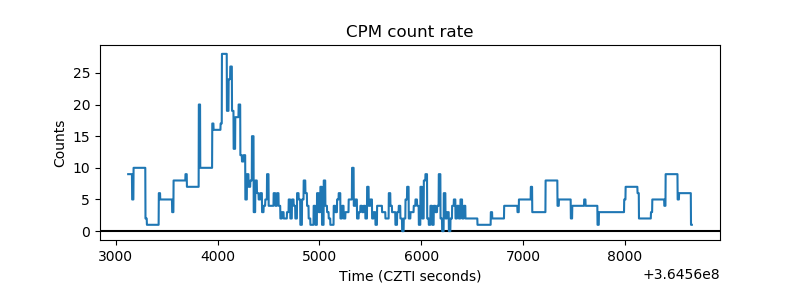 |
| CZT Counter | 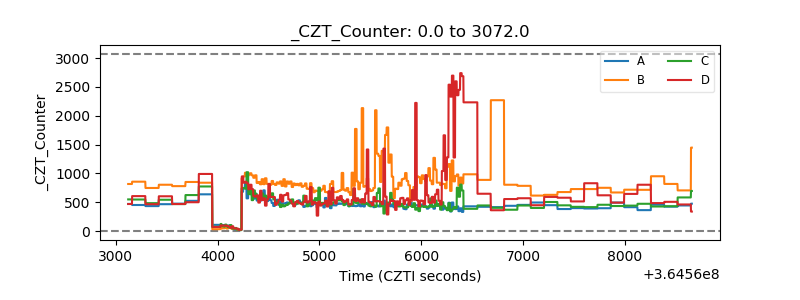 |
| +2.5 Volts monitor | 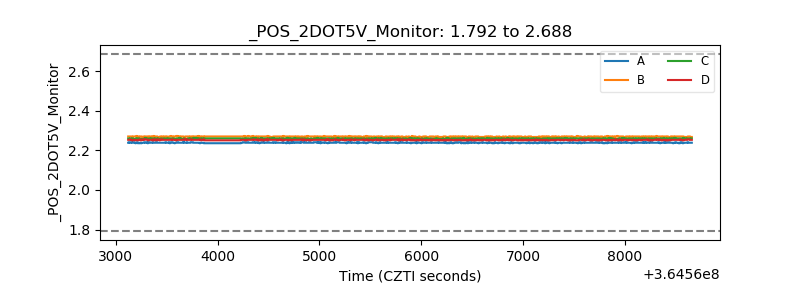 |
| +5 Volts monitor | 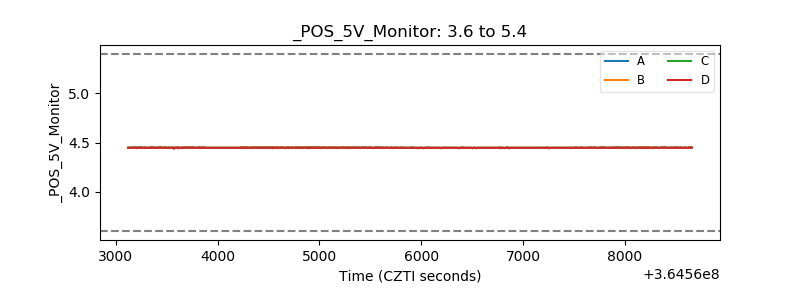 |
| _ROLL_ROT | 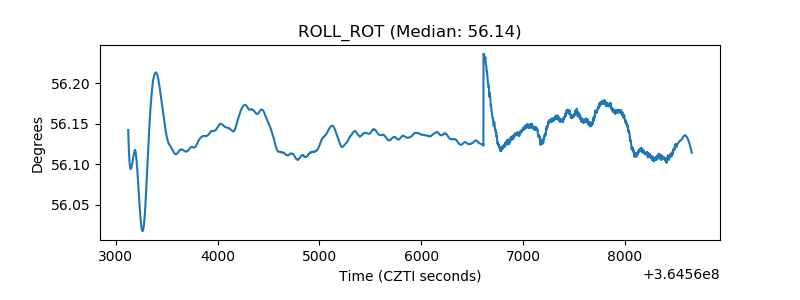 |
| _Roll_DEC | 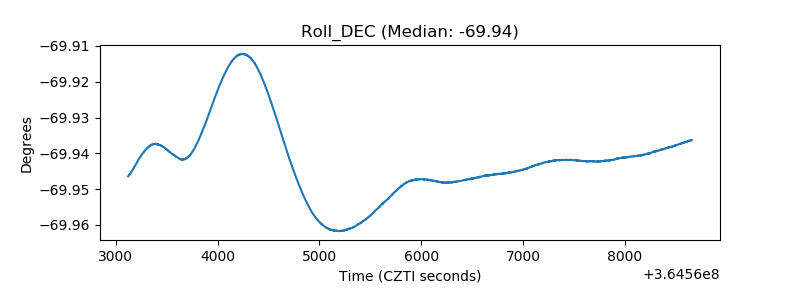 |
| _Roll_RA | 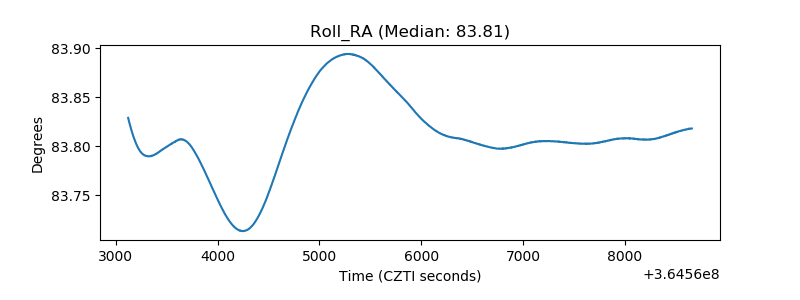 |
| Veto Counter | 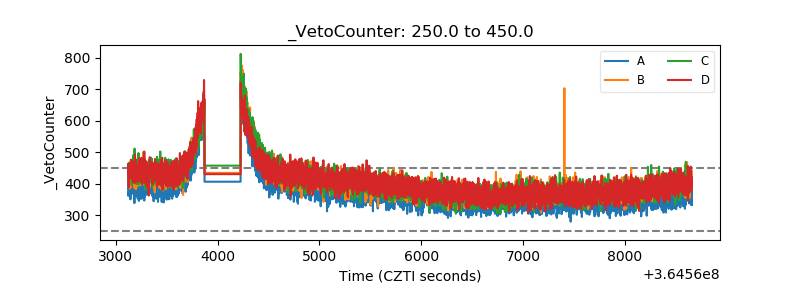 |