| Param | Original file | Final file |
|---|---|---|
| Filename | modeM0/AS1A10_094T32_9000004570_31429cztM0_level2.evt | modeM0/AS1A10_094T32_9000004570_31429cztM0_level2_quad_clean.evt |
| Size (bytes) | 216,501,120 | 50,117,760 |
| Size | 206.5 MB | 47.8 MB |
| Events in quadrant A | 1,274,655 | 337,315 |
| Events in quadrant B | 2,198,093 | 332,501 |
| Events in quadrant C | 1,362,592 | 331,837 |
| Events in quadrant D | 1,544,416 | 330,974 |
| Mode M0 | |||
|---|---|---|---|
| Quadrant | BADHDUFLAG | Total packets | Discarded packets |
| A | 0 | 5440 | 1 |
| B | 0 | 8315 | 1 |
| C | 0 | 5613 | 1 |
| D | 0 | 6162 | 1 |
| Mode SS | |||
|---|---|---|---|
| Quadrant | BADHDUFLAG | Total packets | Discarded packets |
| A | 0 | 54 | 0 |
| B | 0 | 54 | 0 |
| C | 0 | 54 | 0 |
| D | 0 | 54 | 0 |
| Mode M9 | |||
|---|---|---|---|
| Quadrant | BADHDUFLAG | Total packets | Discarded packets |
| A | 0 | 3 | 0 |
| B | 0 | 3 | 0 |
| C | 0 | 3 | 0 |
| D | 0 | 3 | 0 |
| Quadrant | Total seconds | Saturated seconds | Saturation percentage |
|---|---|---|---|
| A | 2572 | 165 | 6.415241% |
| B | 2572 | 277 | 10.769829% |
| C | 2572 | 276 | 10.730949% |
| D | 2572 | 156 | 6.065319% |
Noise dominated data is calculated using 1-second bins in cleaned event files. If a bin has >2000 counts, and if more than 50% of those come from <1% of pixels, then it is considered to be noise-dominated and hence unusable.
| Quadrant | # 1 sec bins | Bins with >0 counts | Bins with >2000 counts | High rate bins dominated by noise | Noise dominated (total time) | Noise dominated (detector-on time) | Marked lightcurve |
|---|---|---|---|---|---|---|---|
| A | 2927 | 2572 | 0 | 0 | 0.00% | 0.00% |  |
| B | 2927 | 2572 | 29 | 29 | 0.99% | 1.13% |  |
| C | 2927 | 2572 | 0 | 0 | 0.00% | 0.00% | 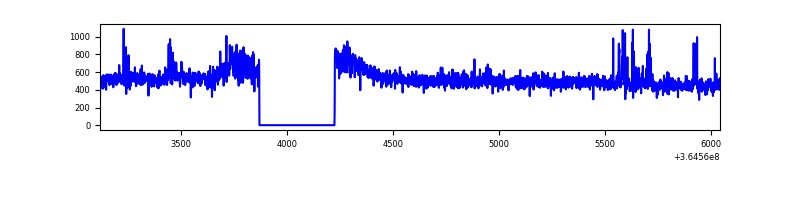 |
| D | 2927 | 2572 | 16 | 16 | 0.55% | 0.62% | 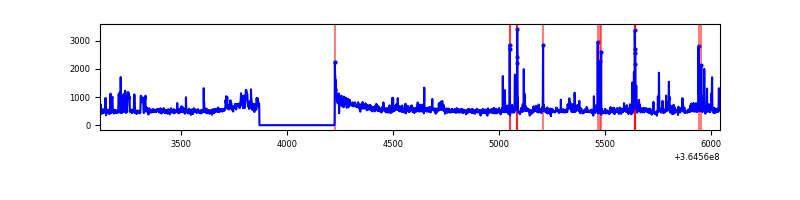 |
Top three noisy pixels from each quadrant. If the there are fewer than three noisy pixels in the level2.evt file, extra rows are filled as -1
| Pixel properties | Quadrant properties | ||||||
|---|---|---|---|---|---|---|---|
| Quadrant | DetID | PixID | Counts | Sigma | Mean | Median | Sigma |
| A | 13 | 254 | 5272 | 73.77 | 328 | 320 | 67.1 |
| A | 12 | 16 | 5015 | 69.95 | 328 | 320 | 67.1 |
| A | 3 | 137 | 3449 | 46.62 | 328 | 320 | 67.1 |
| B | 6 | 159 | 686183 | 10915.12 | 317 | 307 | 62.8 |
| B | 12 | 1 | 218050 | 3465.19 | 317 | 307 | 62.8 |
| B | 4 | 80 | 28694 | 451.75 | 317 | 307 | 62.8 |
| C | 14 | 238 | 76008 | 1015.38 | 315 | 315 | 74.5 |
| C | 14 | 254 | 34959 | 464.73 | 315 | 315 | 74.5 |
| C | 3 | 233 | 14120 | 185.19 | 315 | 315 | 74.5 |
| D | 8 | 195 | 141054 | 1784.68 | 326 | 315 | 78.9 |
| D | 12 | 218 | 78170 | 987.26 | 326 | 315 | 78.9 |
| D | 2 | 250 | 28134 | 352.77 | 326 | 315 | 78.9 |
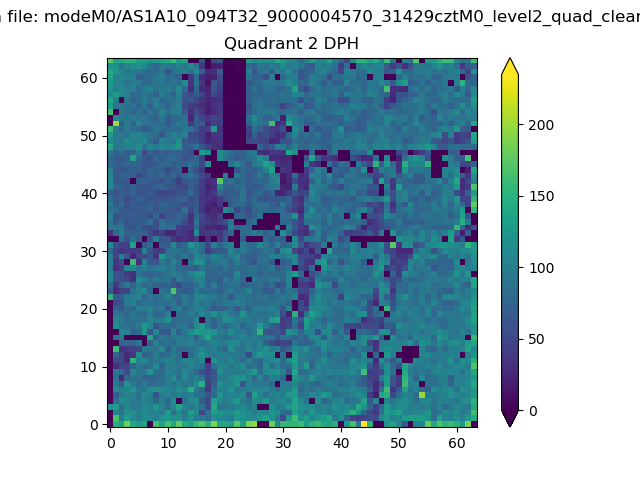
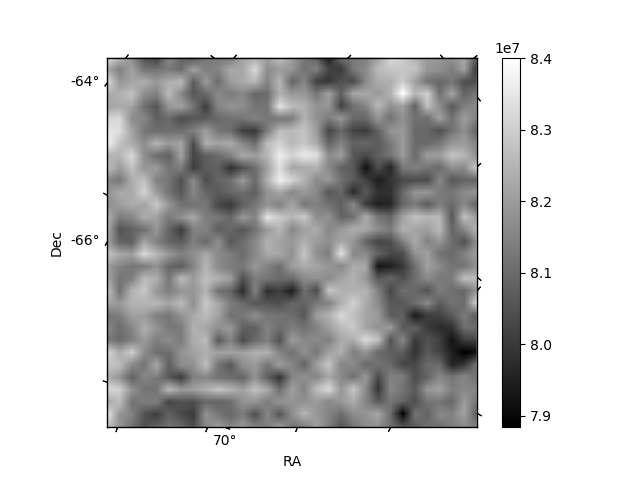
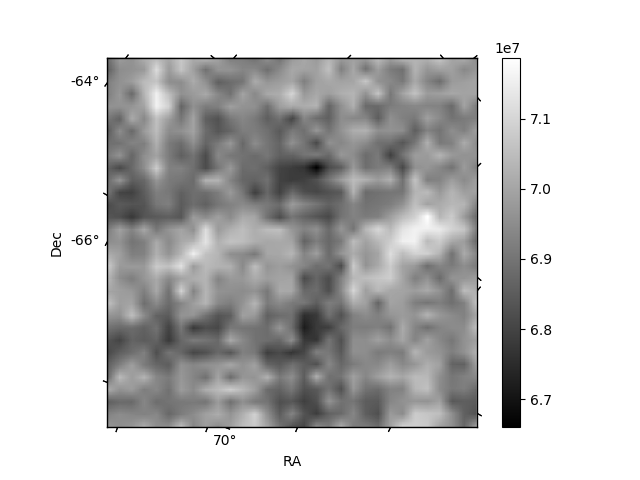
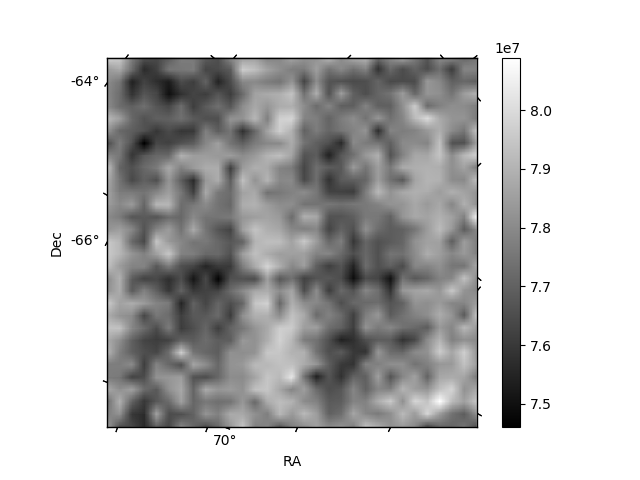
Histogram calculated using DETX and DETY for each event in the final _common_clean file
| Quadrant A | 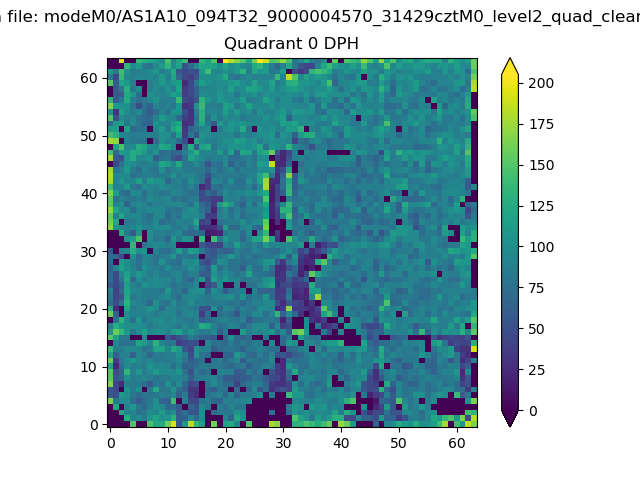 |
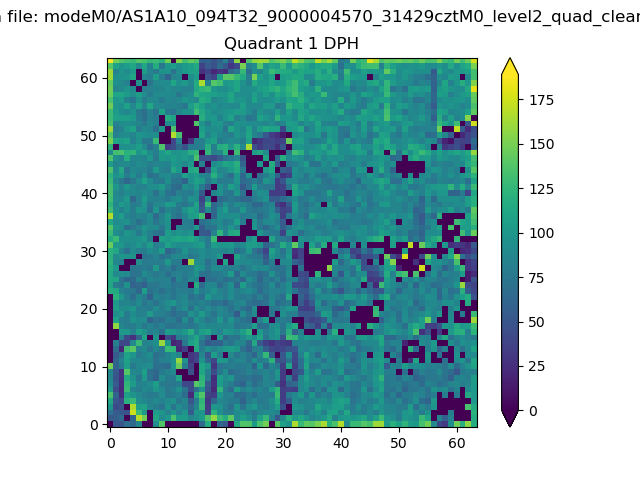 |
Quadrant B |
|---|---|---|---|
| Quadrant D | 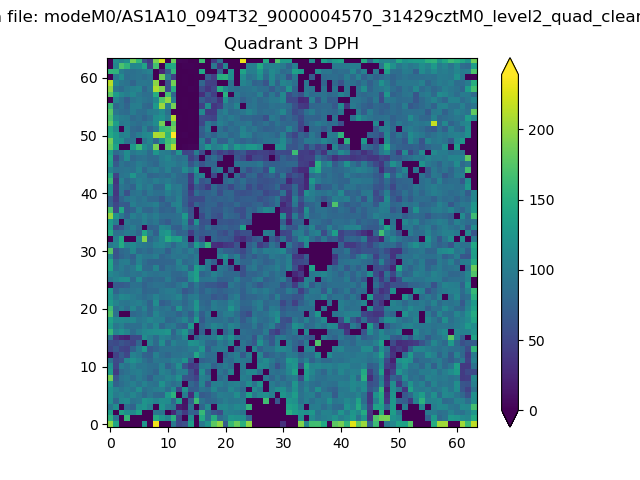 |
 |
Quadrant C |
| Plot type | Count rate plots | Images |
|---|---|---|
| Comparison with Poisson distribution Blue bars denote a histogram of data divided into 1 sec bins. Red curve is a Poisson curve with rate = median count rate of data. |
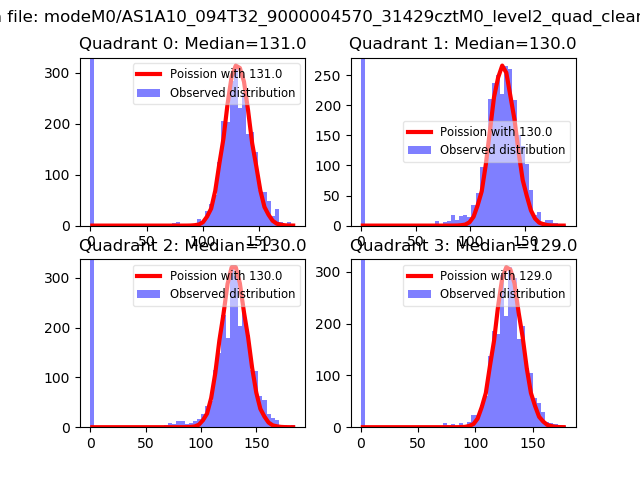 |
 |
| Quadrant-wise count rates Data is divided into 100 sec bins |
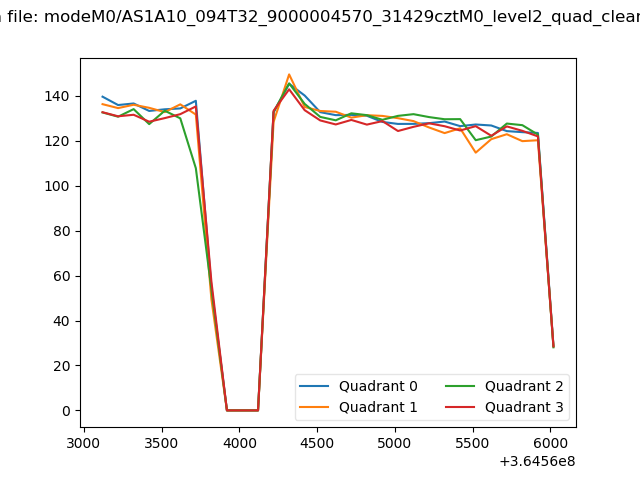 |
|
| Module-wise count rates for Quadrant A Data is divided into 100 sec bins |
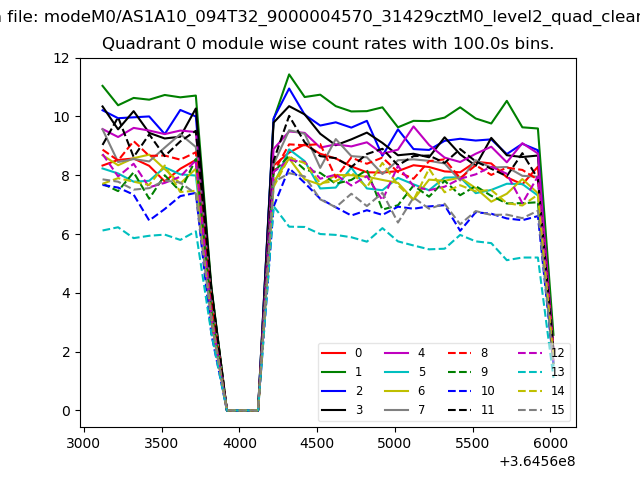 |
 |
| Module-wise count rates for Quadrant B Data is divided into 100 sec bins |
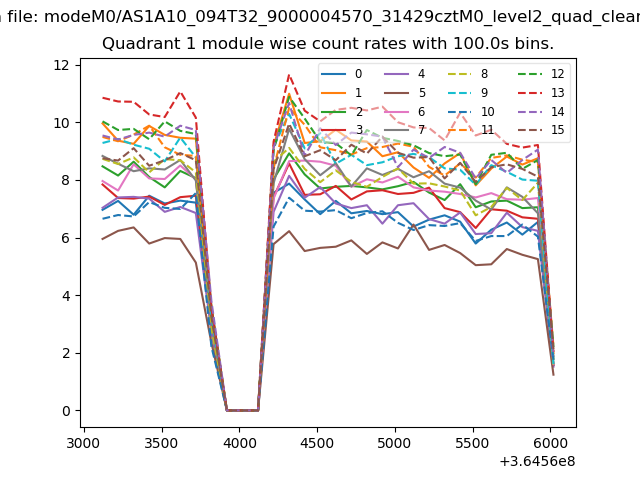 |
 |
| Module-wise count rates for Quadrant C Data is divided into 100 sec bins |
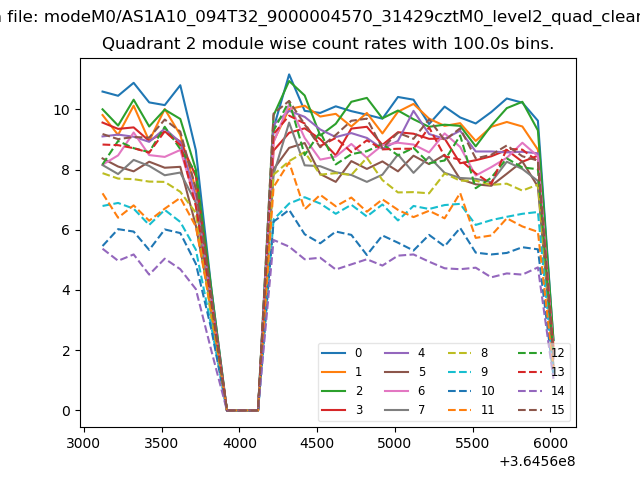 |
 |
| Module-wise count rates for Quadrant D Data is divided into 100 sec bins |
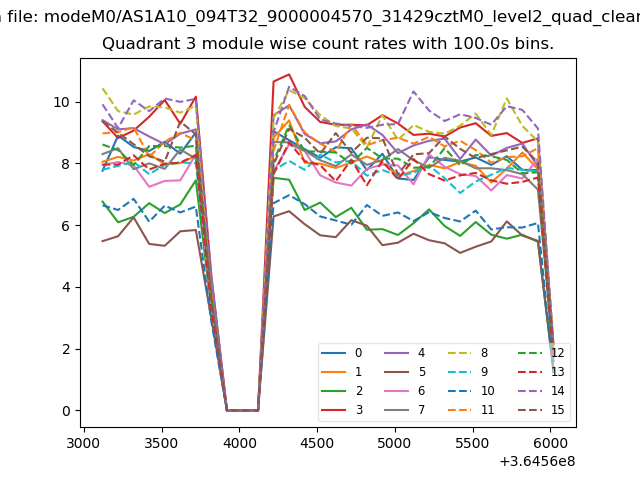 |
 |
| Parameter | Plot |
|---|---|
| CZT HV Monitor |  |
| D_VDD |  |
| Temperature 1 | 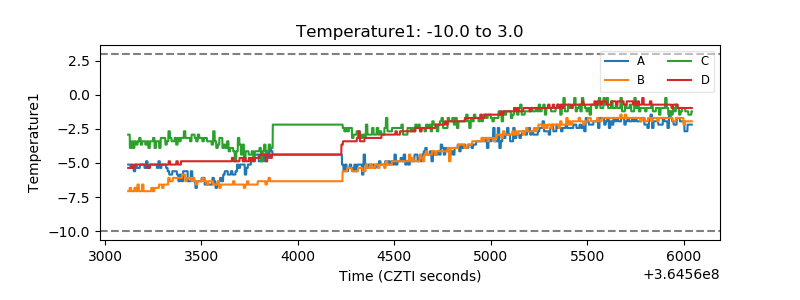 |
| Veto HV Monitor | 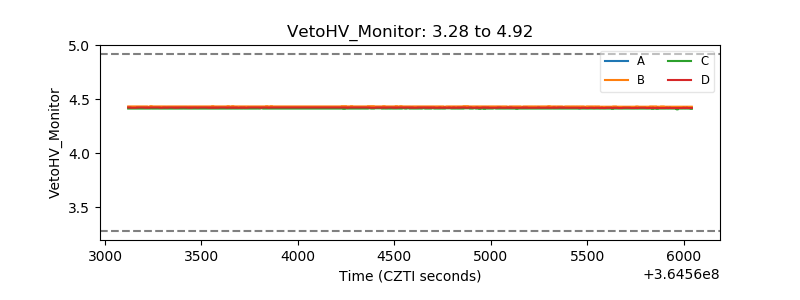 |
| Veto LLD | 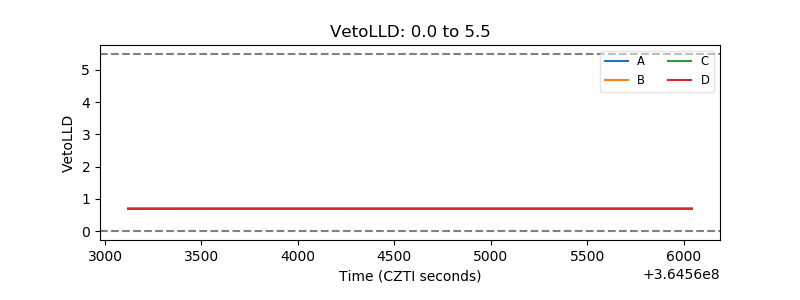 |
| Alpha Counter | 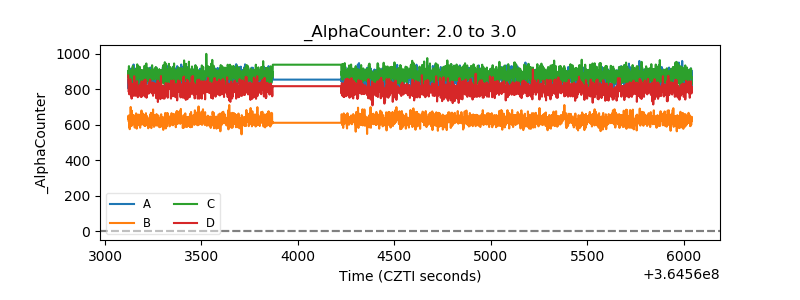 |
| _CPM_Rate | 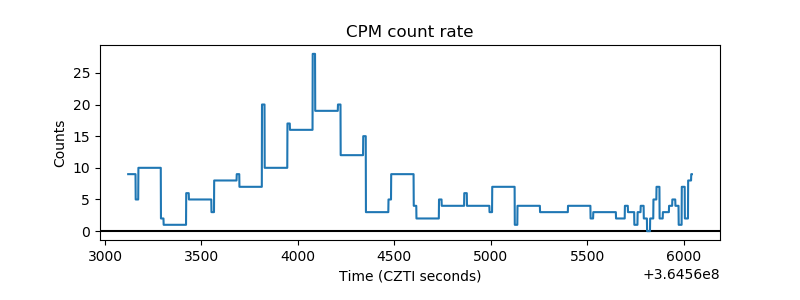 |
| CZT Counter | 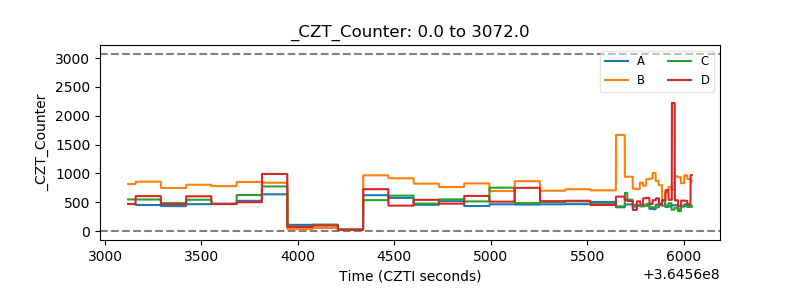 |
| +2.5 Volts monitor |  |
| +5 Volts monitor |  |
| _ROLL_ROT | 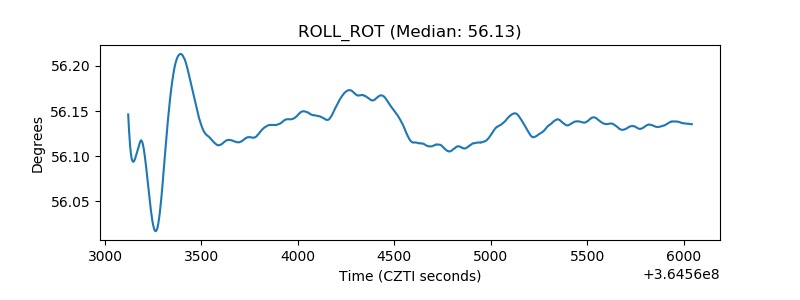 |
| _Roll_DEC | 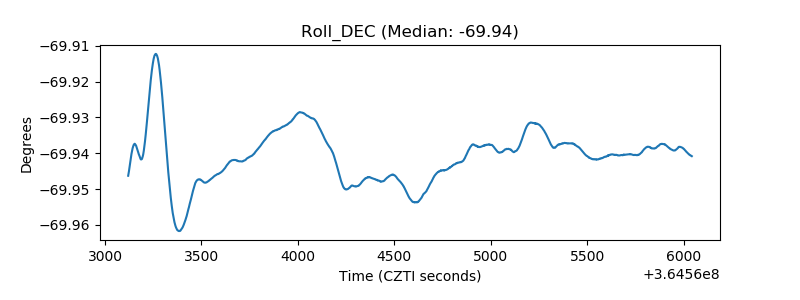 |
| _Roll_RA | 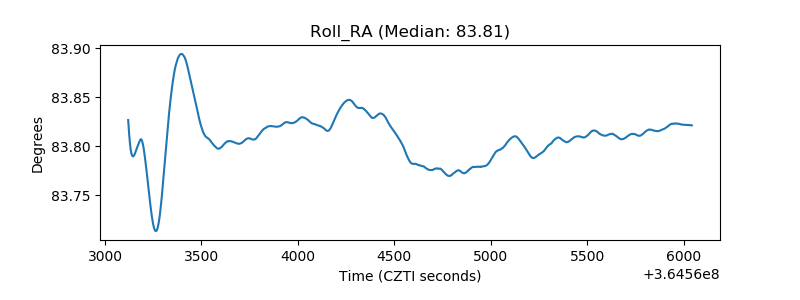 |
| Veto Counter | 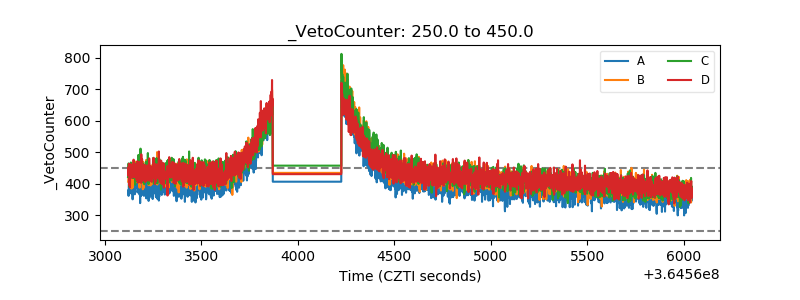 |