| Param | Original file | Final file |
|---|---|---|
| Filename | modeM0/AS1A10_094T32_9000004570_31430cztM0_level2.evt | modeM0/AS1A10_094T32_9000004570_31430cztM0_level2_quad_clean.evt |
| Size (bytes) | 330,508,800 | 75,312,000 |
| Size | 315.2 MB | 71.8 MB |
| Events in quadrant A | 1,787,983 | 509,408 |
| Events in quadrant B | 3,386,439 | 498,877 |
| Events in quadrant C | 1,871,758 | 499,925 |
| Events in quadrant D | 2,688,305 | 487,749 |
| Mode M0 | |||
|---|---|---|---|
| Quadrant | BADHDUFLAG | Total packets | Discarded packets |
| A | 0 | 8080 | 0 |
| B | 0 | 13110 | 0 |
| C | 0 | 8258 | 0 |
| D | 0 | 10546 | 0 |
| Mode SS | |||
|---|---|---|---|
| Quadrant | BADHDUFLAG | Total packets | Discarded packets |
| A | 0 | 82 | 0 |
| B | 0 | 82 | 0 |
| C | 0 | 82 | 0 |
| D | 0 | 82 | 0 |
| Quadrant | Total seconds | Saturated seconds | Saturation percentage |
|---|---|---|---|
| A | 4031 | 3 | 0.074423% |
| B | 4032 | 64 | 1.587302% |
| C | 4032 | 86 | 2.132937% |
| D | 4032 | 170 | 4.216270% |
Noise dominated data is calculated using 1-second bins in cleaned event files. If a bin has >2000 counts, and if more than 50% of those come from <1% of pixels, then it is considered to be noise-dominated and hence unusable.
| Quadrant | # 1 sec bins | Bins with >0 counts | Bins with >2000 counts | High rate bins dominated by noise | Noise dominated (total time) | Noise dominated (detector-on time) | Marked lightcurve |
|---|---|---|---|---|---|---|---|
| A | 4031 | 4031 | 0 | 0 | 0.00% | 0.00% |  |
| B | 4032 | 4032 | 37 | 37 | 0.92% | 0.92% | 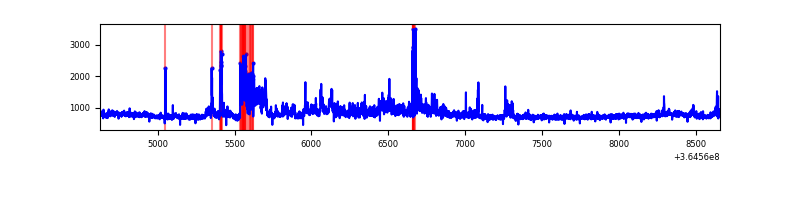 |
| C | 4032 | 4032 | 0 | 0 | 0.00% | 0.00% | 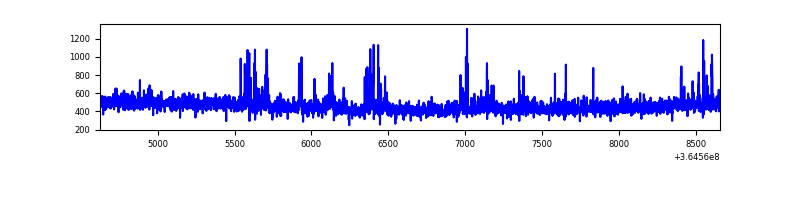 |
| D | 4032 | 4032 | 156 | 156 | 3.87% | 3.87% | 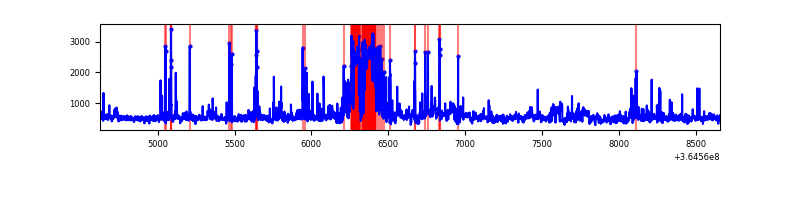 |
Top three noisy pixels from each quadrant. If the there are fewer than three noisy pixels in the level2.evt file, extra rows are filled as -1
| Pixel properties | Quadrant properties | ||||||
|---|---|---|---|---|---|---|---|
| Quadrant | DetID | PixID | Counts | Sigma | Mean | Median | Sigma |
| A | 12 | 16 | 24313 | 260.9 | 455 | 447 | 91.5 |
| A | 13 | 254 | 8630 | 89.46 | 455 | 447 | 91.5 |
| A | 12 | 194 | 6970 | 71.31 | 455 | 447 | 91.5 |
| B | 6 | 159 | 1089087 | 12680.54 | 445 | 433 | 85.9 |
| B | 12 | 1 | 424832 | 4943.36 | 445 | 433 | 85.9 |
| B | 4 | 80 | 58345 | 674.55 | 445 | 433 | 85.9 |
| C | 14 | 238 | 109320 | 1078.21 | 432 | 434 | 101.0 |
| C | 14 | 254 | 52768 | 518.22 | 432 | 434 | 101.0 |
| C | 3 | 233 | 14531 | 139.59 | 432 | 434 | 101.0 |
| D | 8 | 195 | 410286 | 3857.77 | 434 | 423 | 106.2 |
| D | 13 | 249 | 294112 | 2764.3 | 434 | 423 | 106.2 |
| D | 12 | 218 | 115801 | 1085.98 | 434 | 423 | 106.2 |
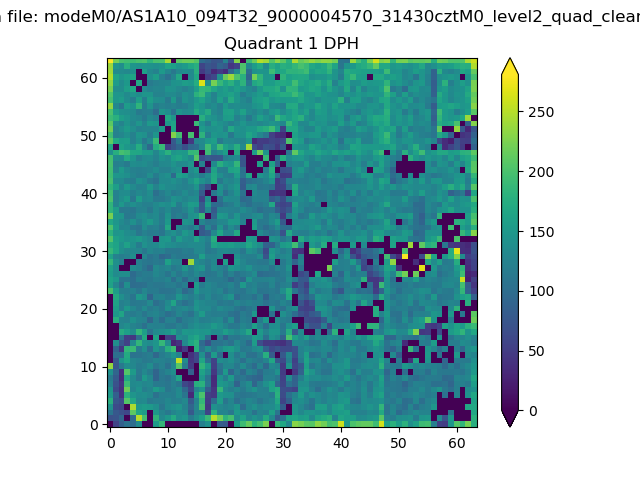
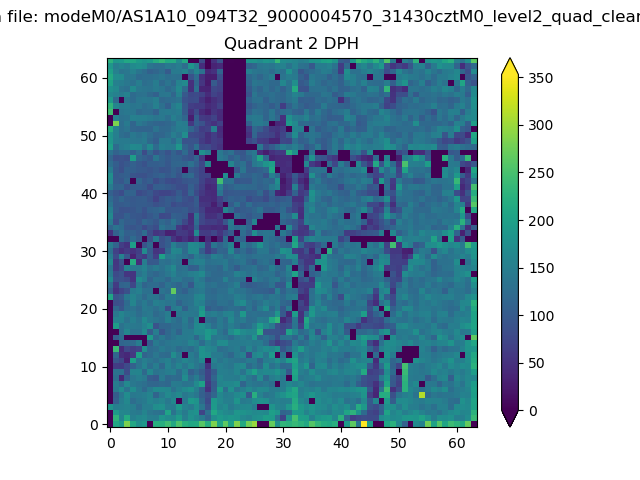
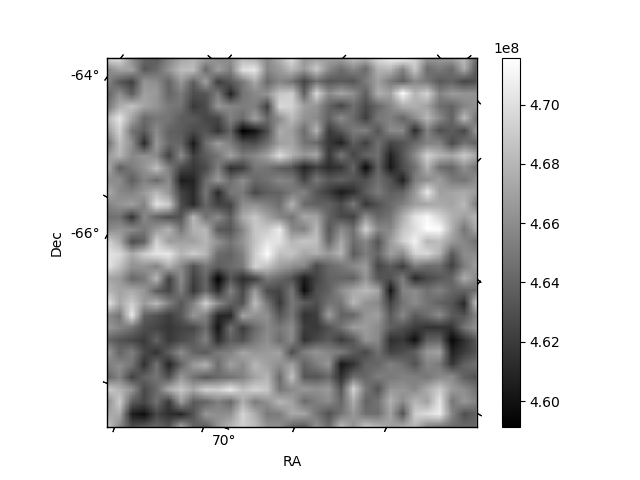
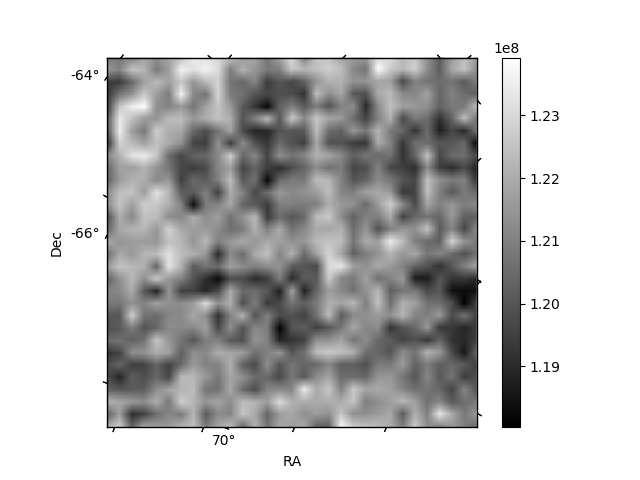
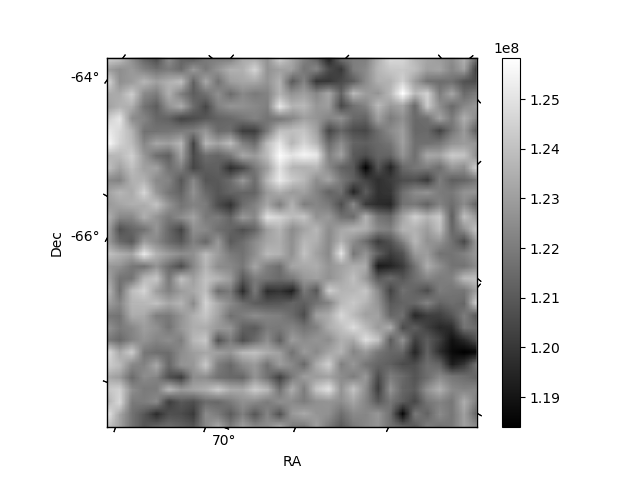
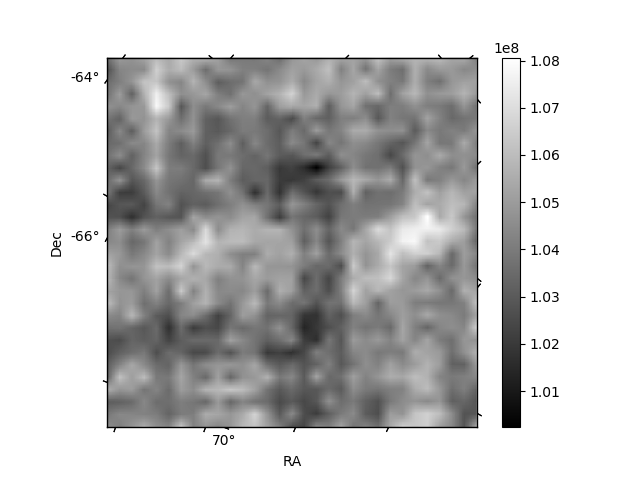
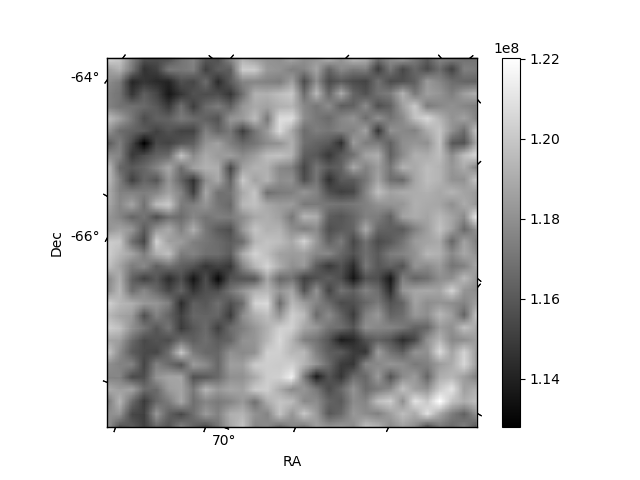
Histogram calculated using DETX and DETY for each event in the final _common_clean file
| Quadrant A | 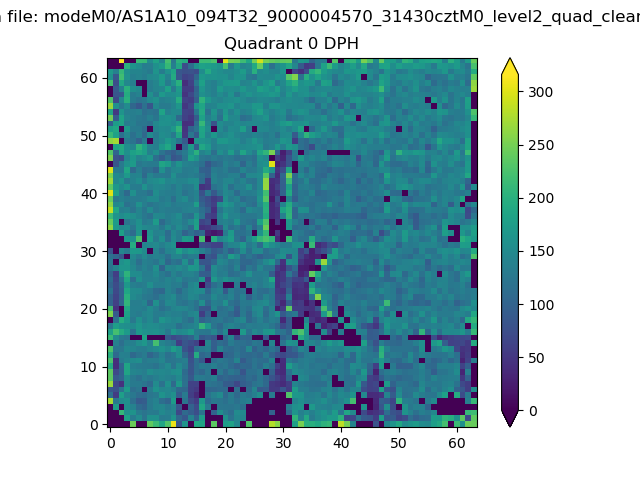 |
 |
Quadrant B |
|---|---|---|---|
| Quadrant D | 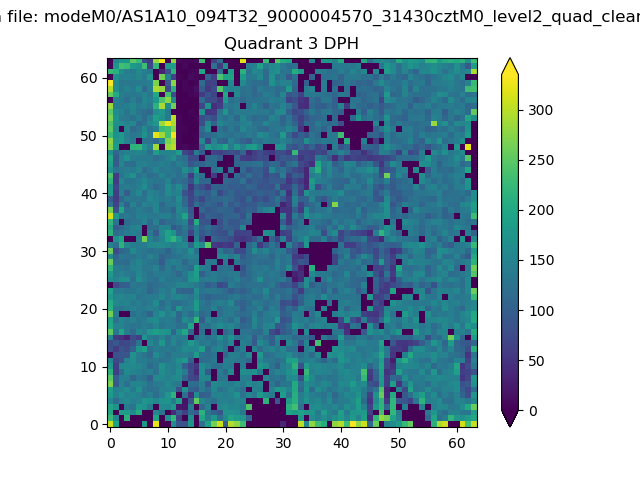 |
 |
Quadrant C |
| Plot type | Count rate plots | Images |
|---|---|---|
| Comparison with Poisson distribution Blue bars denote a histogram of data divided into 1 sec bins. Red curve is a Poisson curve with rate = median count rate of data. |
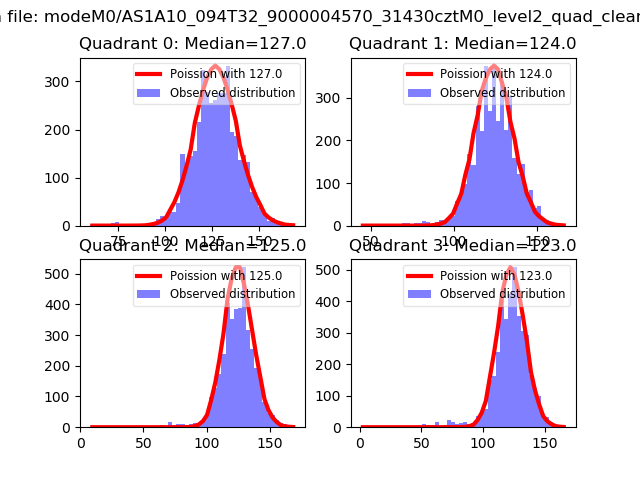 |
 |
| Quadrant-wise count rates Data is divided into 100 sec bins |
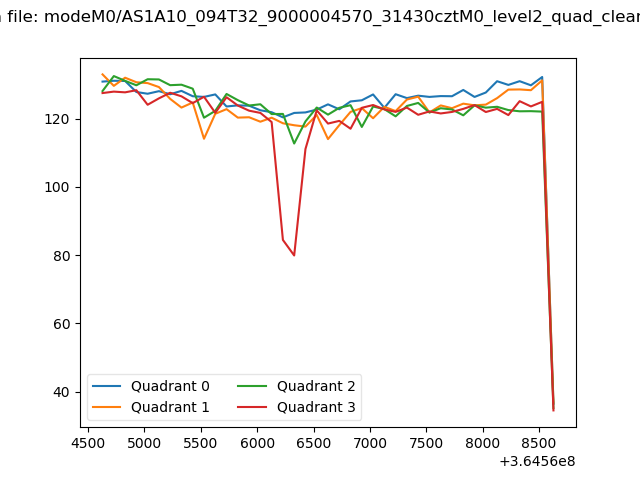 |
|
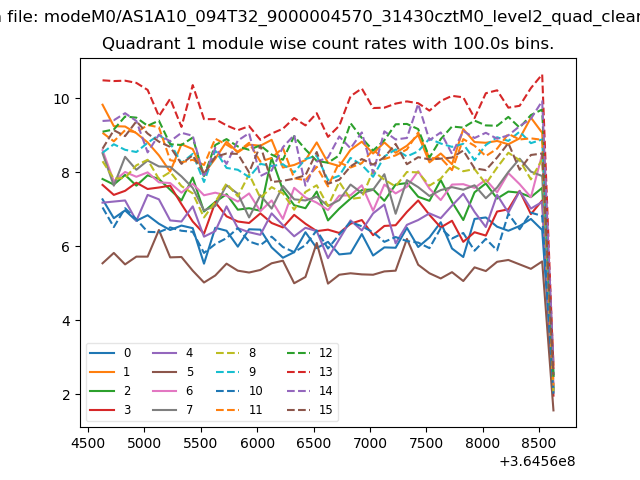
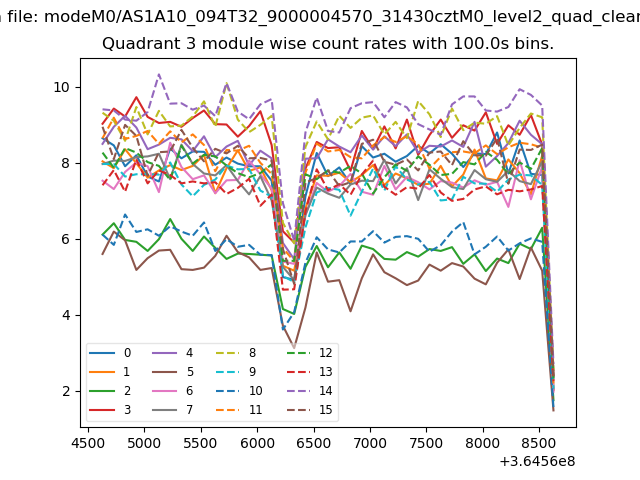
| Module-wise count rates for Quadrant A Data is divided into 100 sec bins |
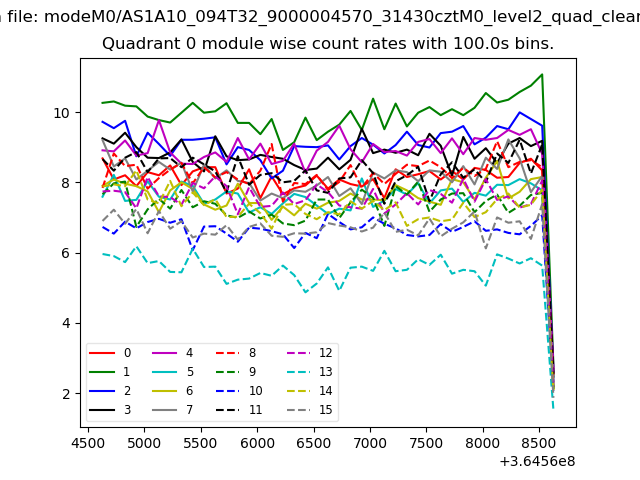 |
 |
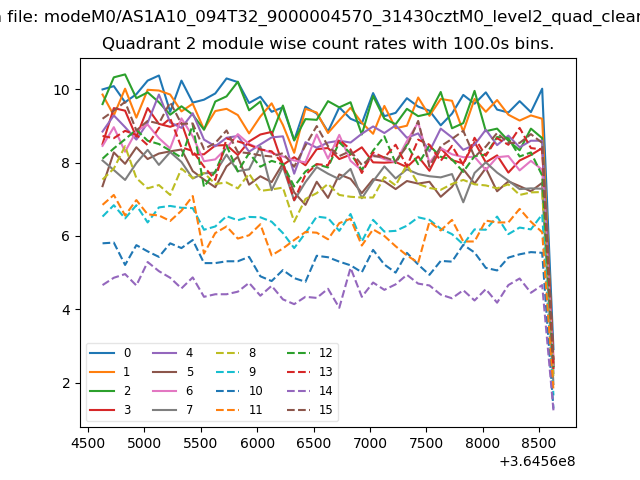
| Module-wise count rates for Quadrant B Data is divided into 100 sec bins |
 |
 |
| Module-wise count rates for Quadrant C Data is divided into 100 sec bins |
 |
 |
| Module-wise count rates for Quadrant D Data is divided into 100 sec bins |
 |
 |
| Parameter | Plot |
|---|---|
| CZT HV Monitor | 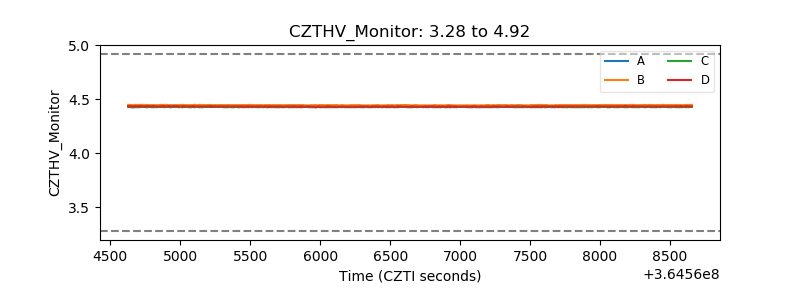 |
| D_VDD | 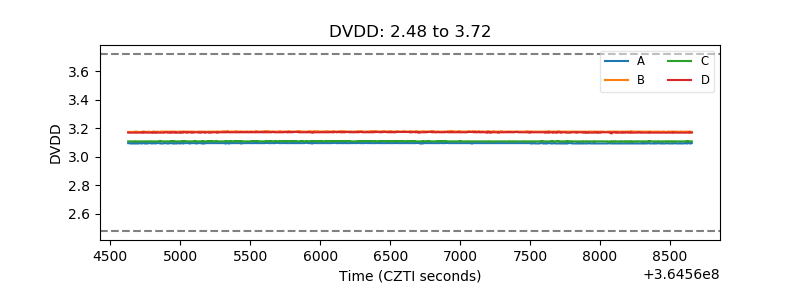 |
| Temperature 1 | 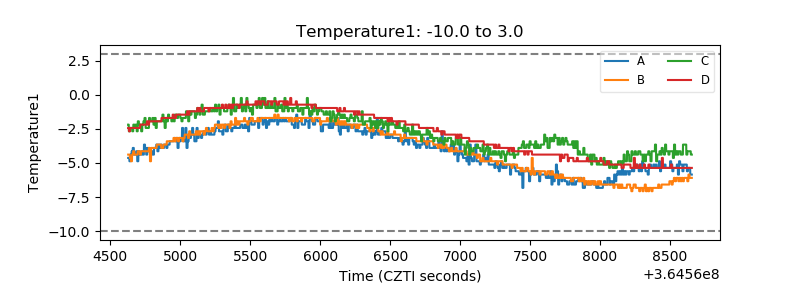 |
| Veto HV Monitor |  |
| Veto LLD | 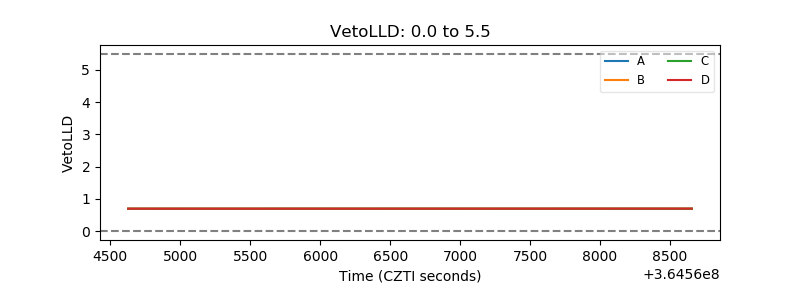 |
| Alpha Counter | 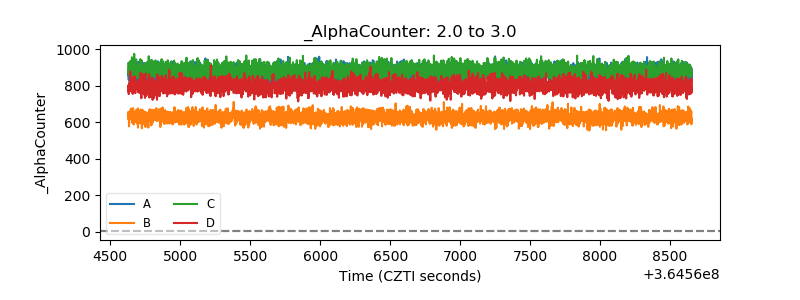 |
| _CPM_Rate | 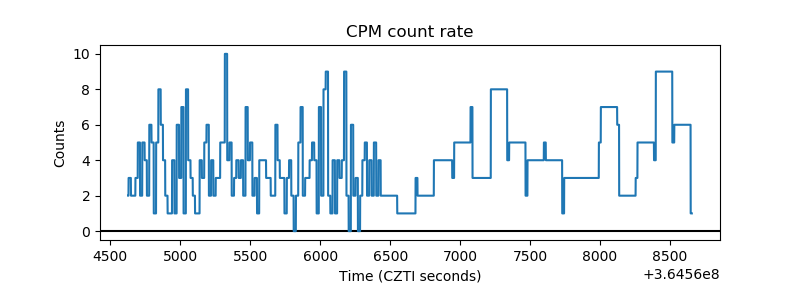 |
| CZT Counter | 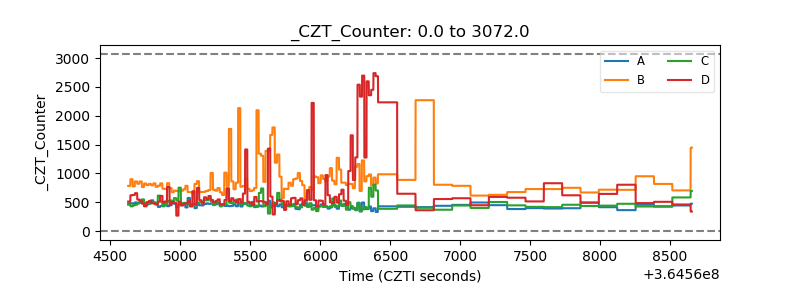 |
| +2.5 Volts monitor |  |
| +5 Volts monitor |  |
| _ROLL_ROT | 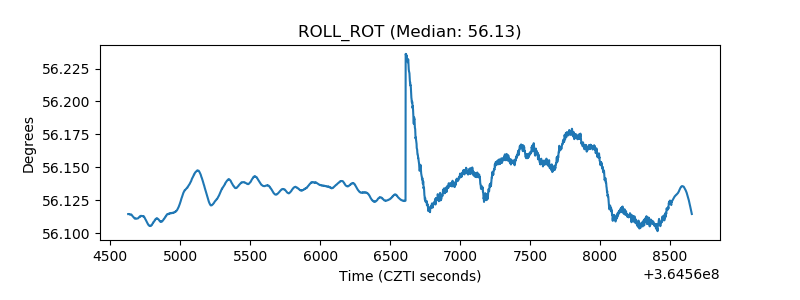 |
| _Roll_DEC | 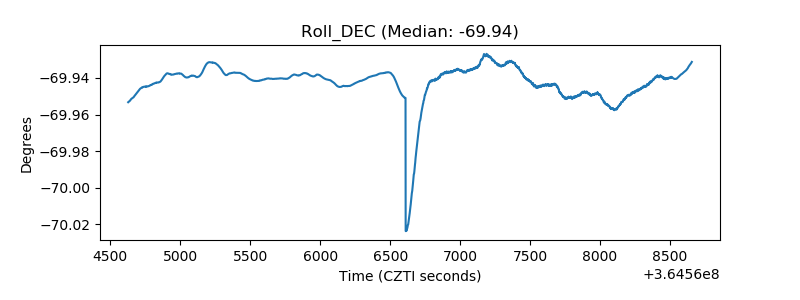 |
| _Roll_RA | 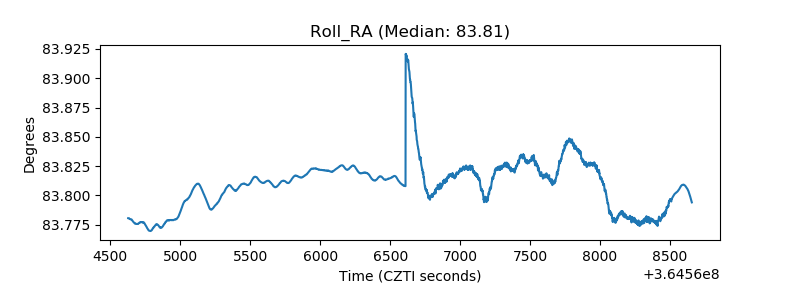 |
| Veto Counter | 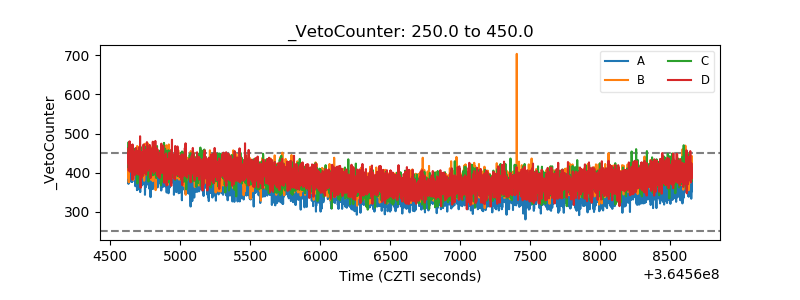 |