| Param | Original file | Final file |
|---|---|---|
| Filename | modeM0/AS1A10_094T33_9000004572cztM0_level2.fits | modeM0/AS1A10_094T33_9000004572cztM0_level2_quad_clean.evt |
| Size (bytes) | 51,500,160 | 65,249,280 |
| Size | 49.1 MB | 62.2 MB |
| Events in quadrant A | 321,138 | 442,386 |
| Events in quadrant B | 265,994 | 325,921 |
| Events in quadrant C | 309,434 | 427,904 |
| Events in quadrant D | 276,594 | 393,421 |
| Mode SS | |||
|---|---|---|---|
| Quadrant | BADHDUFLAG | Total packets | Discarded packets |
| A | 0 | 110 | 0 |
| B | 0 | 110 | 0 |
| C | 0 | 110 | 0 |
| D | 0 | 110 | 0 |
| Mode M0 | |||
|---|---|---|---|
| Quadrant | BADHDUFLAG | Total packets | Discarded packets |
| A | 0 | 11517 | 0 |
| B | 0 | 25052 | 0 |
| C | 0 | 11680 | 0 |
| D | 0 | 13603 | 0 |
| Quadrant | Total seconds | Saturated seconds | Saturation percentage |
|---|---|---|---|
| A | 5510 | 252 | 4.573503% |
| B | 5510 | 1847 | 33.520871% |
| C | 5510 | 318 | 5.771325% |
| D | 5510 | 243 | 4.410163% |
Noise dominated data is calculated using 1-second bins in cleaned event files. If a bin has >2000 counts, and if more than 50% of those come from <1% of pixels, then it is considered to be noise-dominated and hence unusable.
| Quadrant | # 1 sec bins | Bins with >0 counts | Bins with >2000 counts | High rate bins dominated by noise | Noise dominated (total time) | Noise dominated (detector-on time) | Marked lightcurve |
|---|---|---|---|---|---|---|---|
| A | 5540 | 5509 | 0 | 0 | 0.00% | 0.00% | 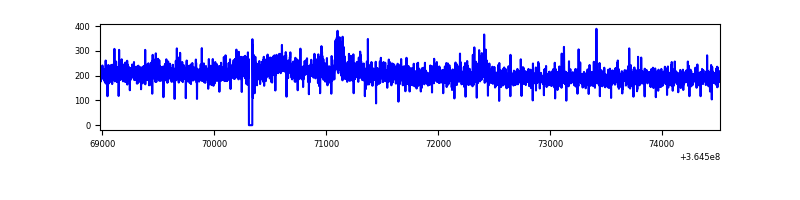 |
| B | 5540 | 5504 | 0 | 0 | 0.00% | 0.00% |  |
| C | 5540 | 5509 | 0 | 0 | 0.00% | 0.00% | 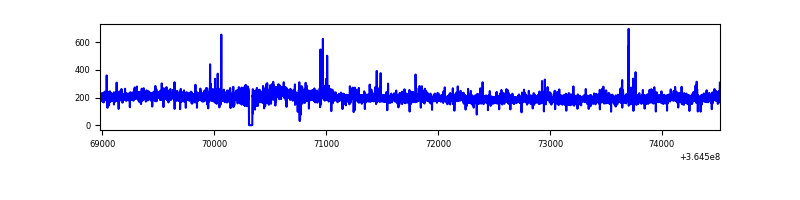 |
| D | 5540 | 5510 | 0 | 0 | 0.00% | 0.00% | 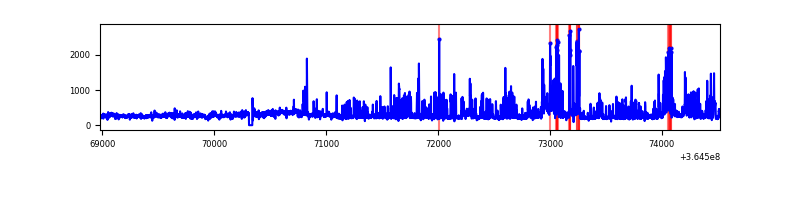 |
Top three noisy pixels from each quadrant. If the there are fewer than three noisy pixels in the level2.evt file, extra rows are filled as -1
| Pixel properties | Quadrant properties | ||||||
|---|---|---|---|---|---|---|---|
| Quadrant | DetID | PixID | Counts | Sigma | Mean | Median | Sigma |
| A | 0 | 29 | 312 | 10.48 | 83 | 78 | 22.3 |
| A | 9 | 19 | 259 | 8.1 | 83 | 78 | 22.3 |
| A | 7 | 110 | 250 | 7.7 | 83 | 78 | 22.3 |
| B | 2 | 9 | 227 | 10.04 | 70 | 67 | 15.9 |
| B | 5 | 128 | 196 | 8.09 | 70 | 67 | 15.9 |
| B | 4 | 227 | 173 | 6.65 | 70 | 67 | 15.9 |
| C | 9 | 233 | 226 | 6.64 | 82 | 77 | 22.5 |
| C | 3 | 126 | 217 | 6.23 | 82 | 77 | 22.5 |
| C | 3 | 235 | 214 | 6.1 | 82 | 77 | 22.5 |
| D | 4 | 246 | 224 | 6.72 | 78 | 71 | 22.8 |
| D | 14 | 254 | 208 | 6.02 | 78 | 71 | 22.8 |
| D | 15 | 47 | 203 | 5.8 | 78 | 71 | 22.8 |
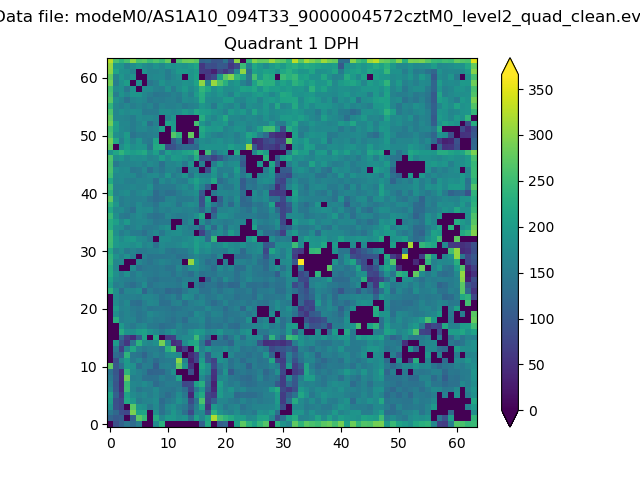
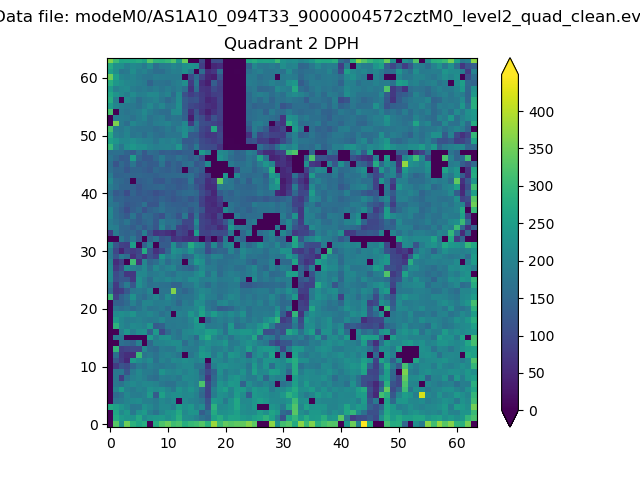
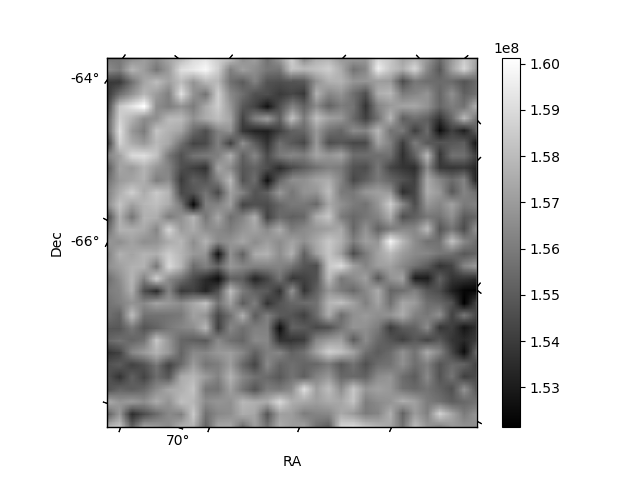
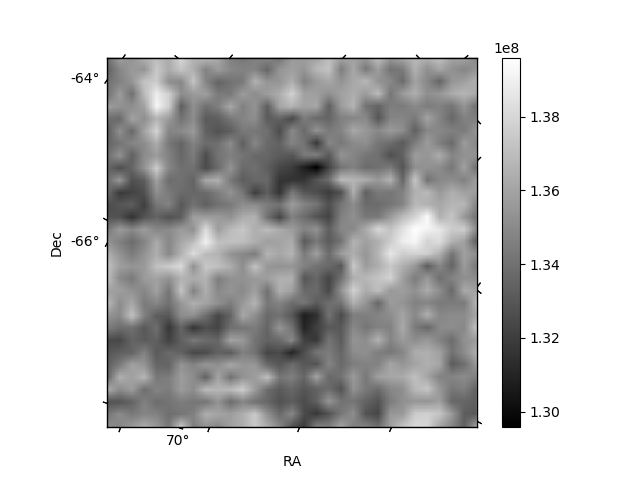
Histogram calculated using DETX and DETY for each event in the final _common_clean file
| Quadrant A | 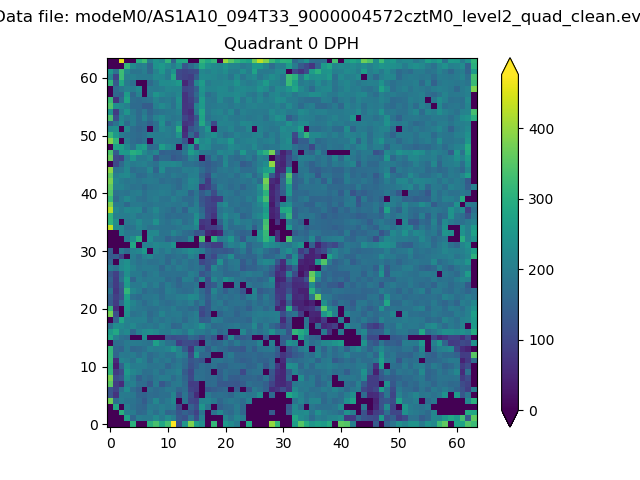 |
 |
Quadrant B |
|---|---|---|---|
| Quadrant D | 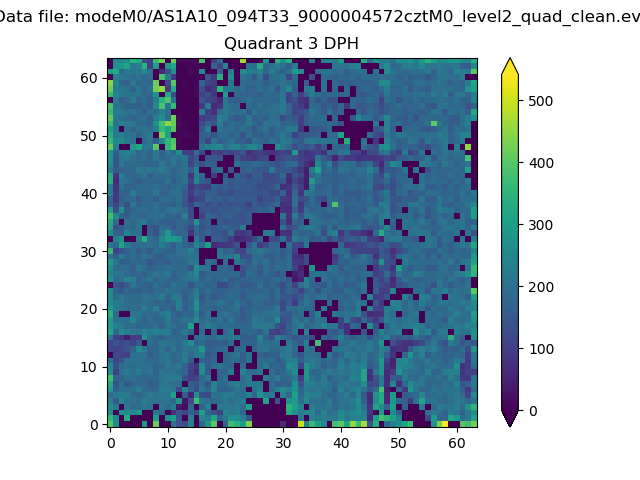 |
 |
Quadrant C |
| Plot type | Count rate plots | Images |
|---|---|---|
| Comparison with Poisson distribution Blue bars denote a histogram of data divided into 1 sec bins. Red curve is a Poisson curve with rate = median count rate of data. |
 |
 |
| Quadrant-wise count rates Data is divided into 100 sec bins |
 |
|
| Module-wise count rates for Quadrant A Data is divided into 100 sec bins |
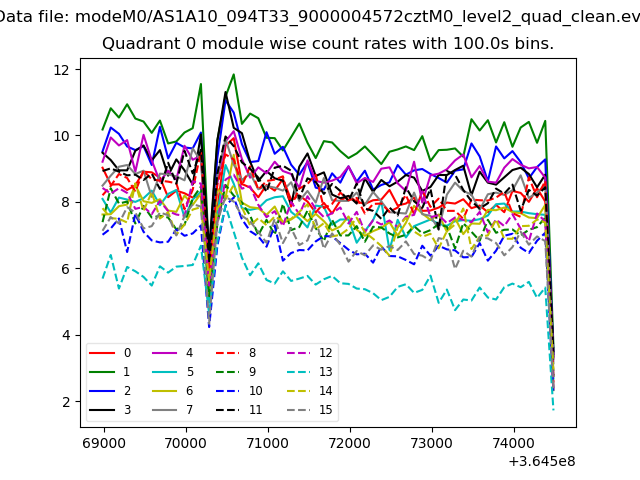 |
 |
| Module-wise count rates for Quadrant B Data is divided into 100 sec bins |
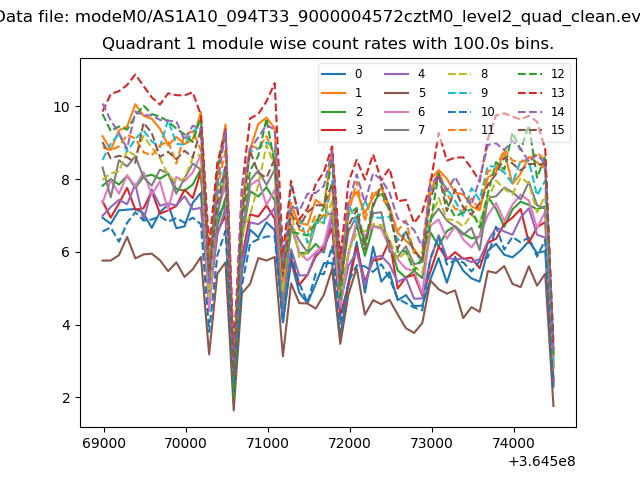 |
 |
| Module-wise count rates for Quadrant C Data is divided into 100 sec bins |
 |
 |
| Module-wise count rates for Quadrant D Data is divided into 100 sec bins |
 |
 |
| Parameter | Plot |
|---|---|
| CZT HV Monitor | 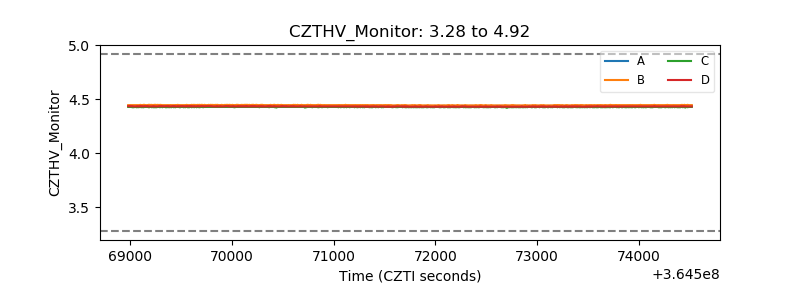 |
| D_VDD | 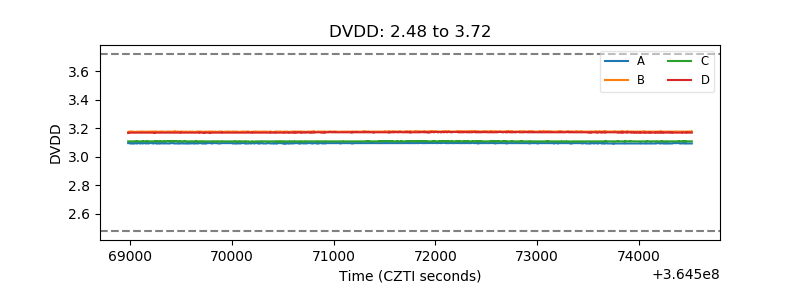 |
| Temperature 1 |  |
| Veto HV Monitor |  |
| Veto LLD |  |
| Alpha Counter |  |
| _CPM_Rate |  |
| CZT Counter | 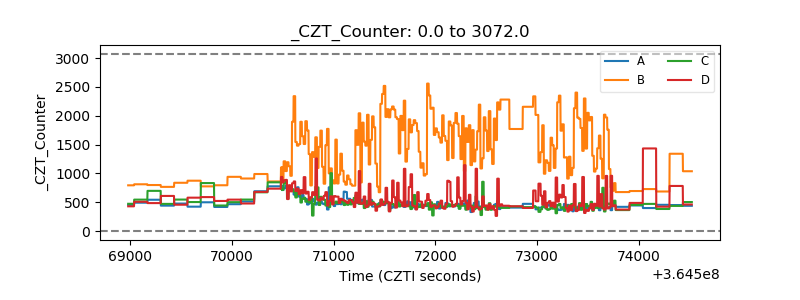 |
| +2.5 Volts monitor |  |
| +5 Volts monitor |  |
| _ROLL_ROT |  |
| _Roll_DEC |  |
| _Roll_RA | 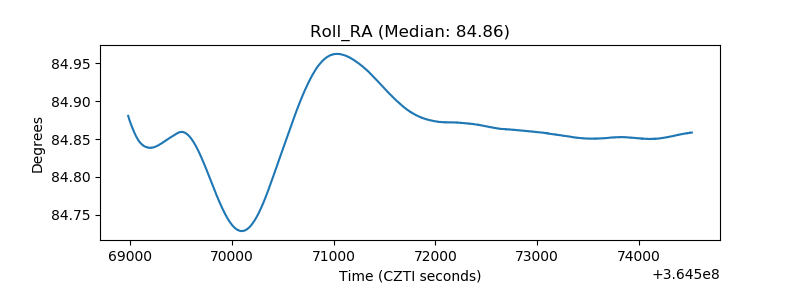 |
| Veto Counter |  |