| Param | Original file | Final file |
|---|---|---|
| Filename | modeM0/AS1A10_094T33_9000004572_31430cztM0_level2.evt | modeM0/AS1A10_094T33_9000004572_31430cztM0_level2_quad_clean.evt |
| Size (bytes) | 313,021,440 | 61,767,360 |
| Size | 298.5 MB | 58.9 MB |
| Events in quadrant A | 1,671,261 | 424,261 |
| Events in quadrant B | 3,907,965 | 375,740 |
| Events in quadrant C | 1,723,934 | 421,749 |
| Events in quadrant D | 1,954,493 | 417,244 |
| Mode SS | |||
|---|---|---|---|
| Quadrant | BADHDUFLAG | Total packets | Discarded packets |
| A | 0 | 66 | 0 |
| B | 0 | 66 | 0 |
| C | 0 | 66 | 0 |
| D | 0 | 66 | 0 |
| Mode M0 | |||
|---|---|---|---|
| Quadrant | BADHDUFLAG | Total packets | Discarded packets |
| A | 0 | 6981 | 1 |
| B | 0 | 13784 | 1 |
| C | 0 | 7095 | 1 |
| D | 0 | 7799 | 1 |
| Quadrant | Total seconds | Saturated seconds | Saturation percentage |
|---|---|---|---|
| A | 3243 | 252 | 7.770583% |
| B | 3243 | 1123 | 34.628430% |
| C | 3243 | 300 | 9.250694% |
| D | 3243 | 188 | 5.797101% |
Noise dominated data is calculated using 1-second bins in cleaned event files. If a bin has >2000 counts, and if more than 50% of those come from <1% of pixels, then it is considered to be noise-dominated and hence unusable.
| Quadrant | # 1 sec bins | Bins with >0 counts | Bins with >2000 counts | High rate bins dominated by noise | Noise dominated (total time) | Noise dominated (detector-on time) | Marked lightcurve |
|---|---|---|---|---|---|---|---|
| A | 3273 | 3244 | 0 | 0 | 0.00% | 0.00% | 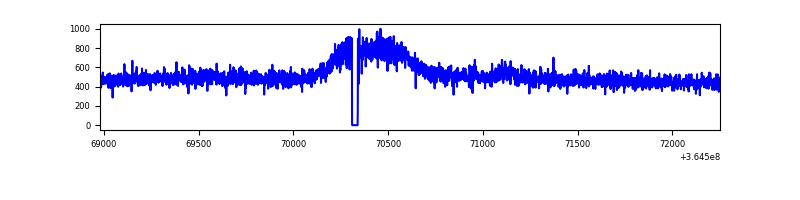 |
| B | 3273 | 3243 | 288 | 288 | 8.80% | 8.88% | 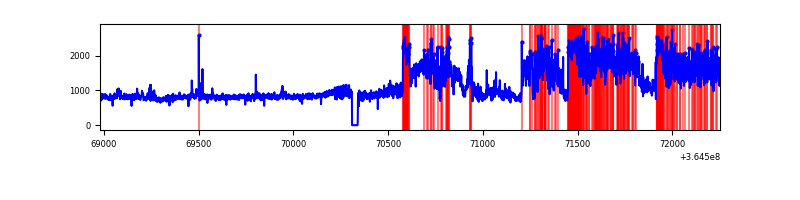 |
| C | 3273 | 3244 | 0 | 0 | 0.00% | 0.00% | 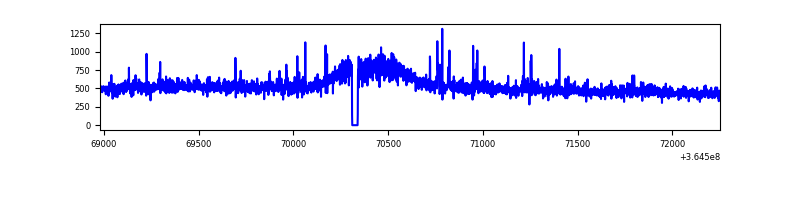 |
| D | 3273 | 3244 | 8 | 8 | 0.24% | 0.25% | 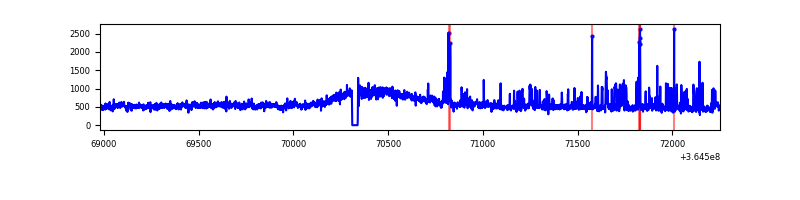 |
Top three noisy pixels from each quadrant. If the there are fewer than three noisy pixels in the level2.evt file, extra rows are filled as -1
| Pixel properties | Quadrant properties | ||||||
|---|---|---|---|---|---|---|---|
| Quadrant | DetID | PixID | Counts | Sigma | Mean | Median | Sigma |
| A | 12 | 16 | 22138 | 249.32 | 426 | 414 | 87.1 |
| A | 12 | 194 | 6624 | 71.27 | 426 | 414 | 87.1 |
| A | 13 | 254 | 5963 | 63.69 | 426 | 414 | 87.1 |
| B | 12 | 1 | 1246187 | 16889.57 | 373 | 361 | 73.8 |
| B | 6 | 159 | 819455 | 11104.4 | 373 | 361 | 73.8 |
| B | 12 | 2 | 224400 | 3037.28 | 373 | 361 | 73.8 |
| C | 14 | 238 | 79986 | 826.68 | 411 | 411 | 96.3 |
| C | 14 | 254 | 22037 | 224.67 | 411 | 411 | 96.3 |
| C | 2 | 114 | 7679 | 75.51 | 411 | 411 | 96.3 |
| D | 8 | 195 | 261787 | 2559.35 | 425 | 411 | 102.1 |
| D | 12 | 218 | 24049 | 231.46 | 425 | 411 | 102.1 |
| D | 5 | 233 | 24017 | 231.15 | 425 | 411 | 102.1 |
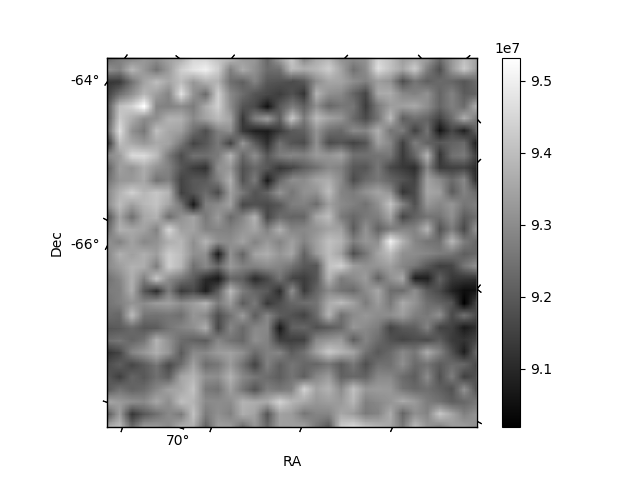
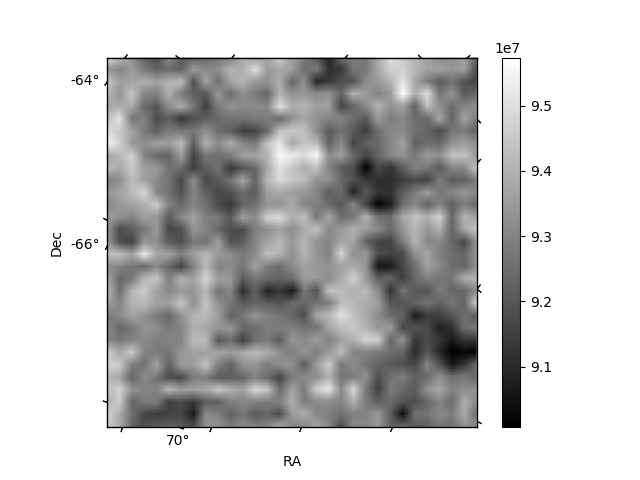
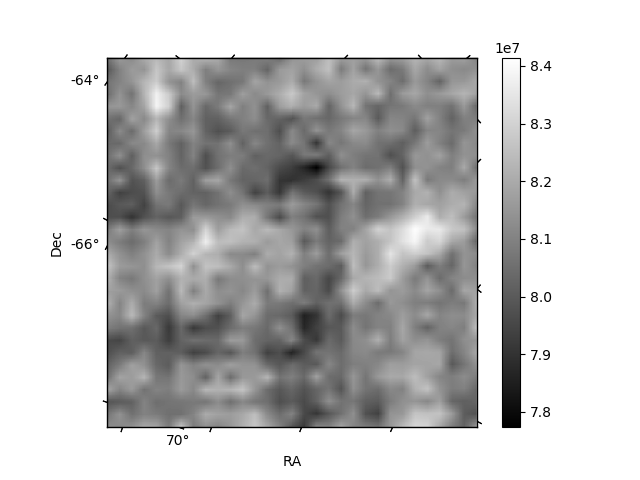
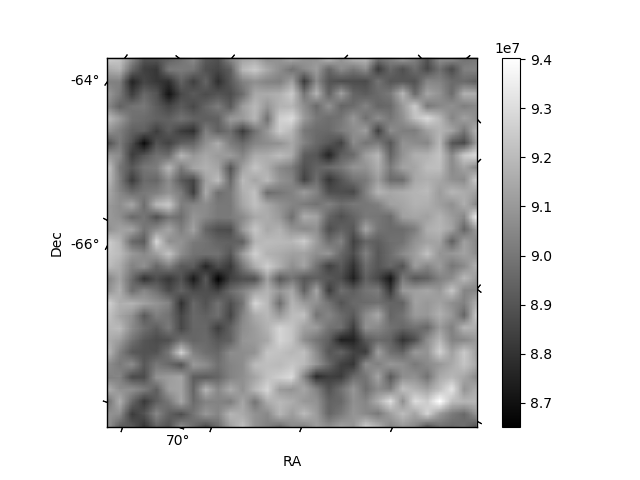
Histogram calculated using DETX and DETY for each event in the final _common_clean file
| Quadrant A |  |
 |
Quadrant B |
|---|---|---|---|
| Quadrant D |  |
 |
Quadrant C |
| Plot type | Count rate plots | Images |
|---|---|---|
| Comparison with Poisson distribution Blue bars denote a histogram of data divided into 1 sec bins. Red curve is a Poisson curve with rate = median count rate of data. |
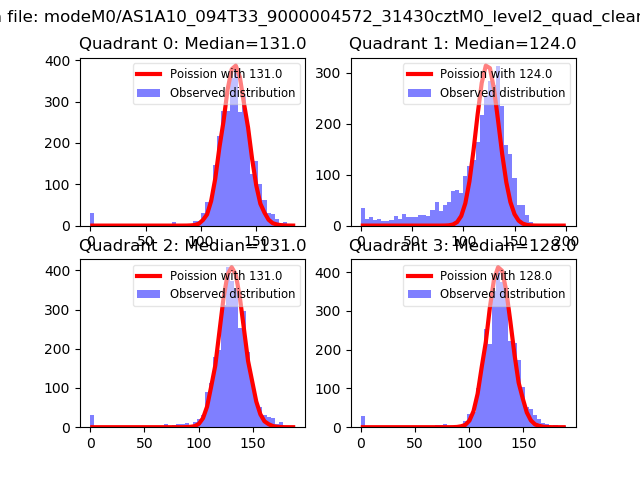 |
 |
| Quadrant-wise count rates Data is divided into 100 sec bins |
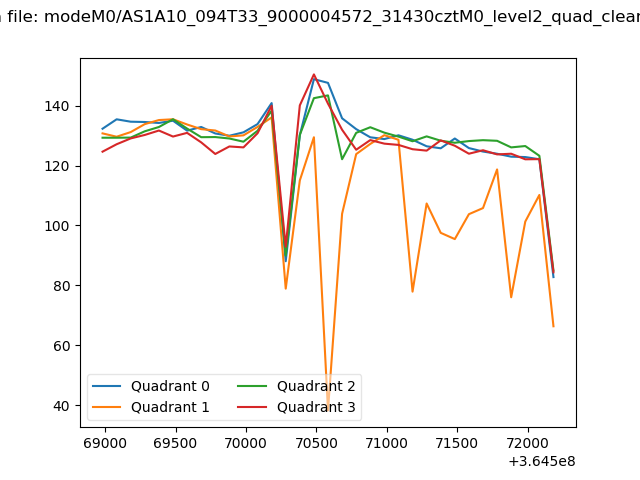 |
|
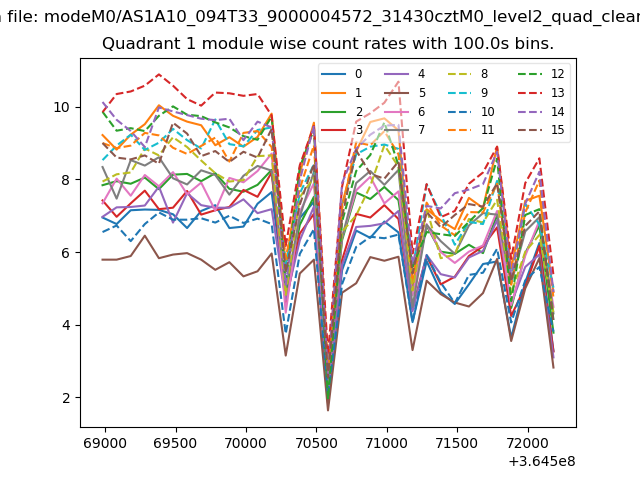
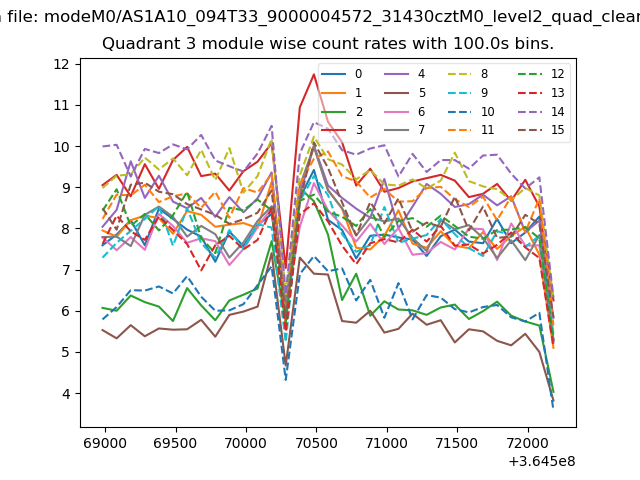
| Module-wise count rates for Quadrant A Data is divided into 100 sec bins |
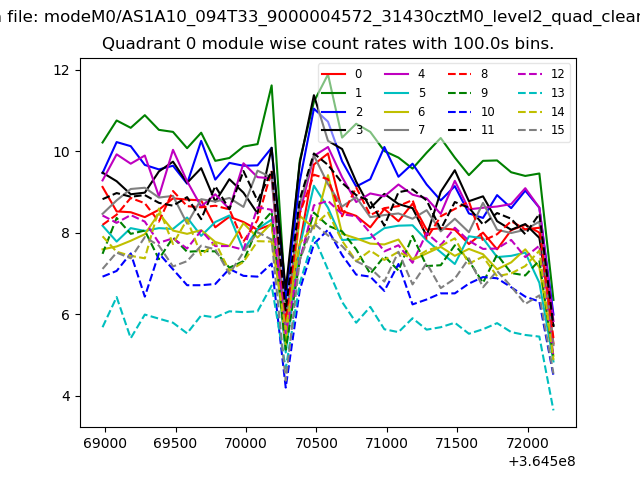 |
 |
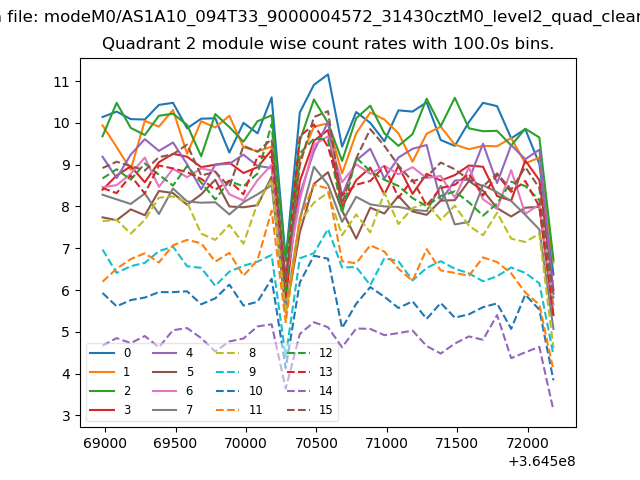
| Module-wise count rates for Quadrant B Data is divided into 100 sec bins |
 |
 |
| Module-wise count rates for Quadrant C Data is divided into 100 sec bins |
 |
 |
| Module-wise count rates for Quadrant D Data is divided into 100 sec bins |
 |
 |
| Parameter | Plot |
|---|---|
| CZT HV Monitor | 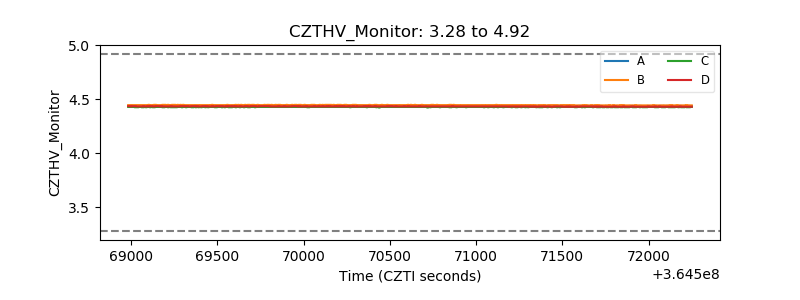 |
| D_VDD | 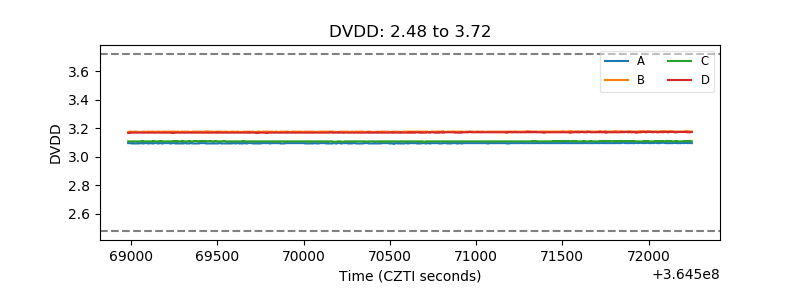 |
| Temperature 1 | 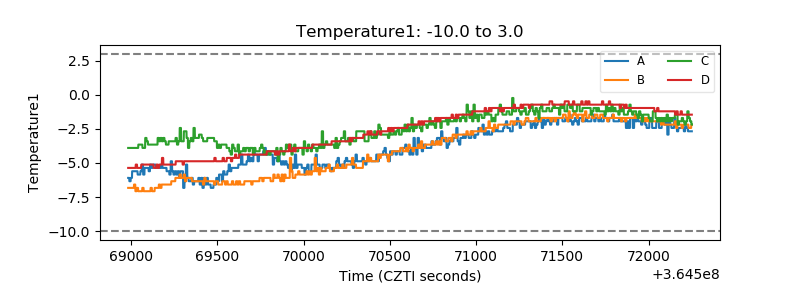 |
| Veto HV Monitor |  |
| Veto LLD | 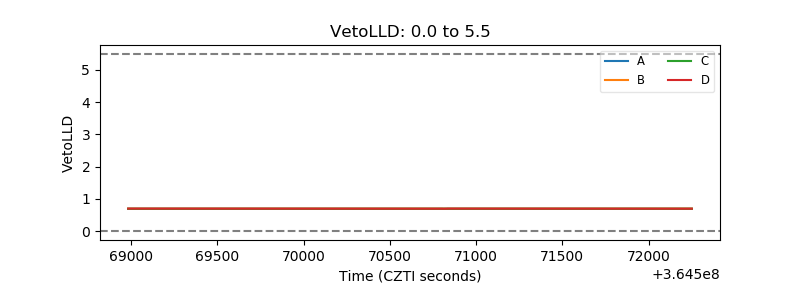 |
| Alpha Counter | 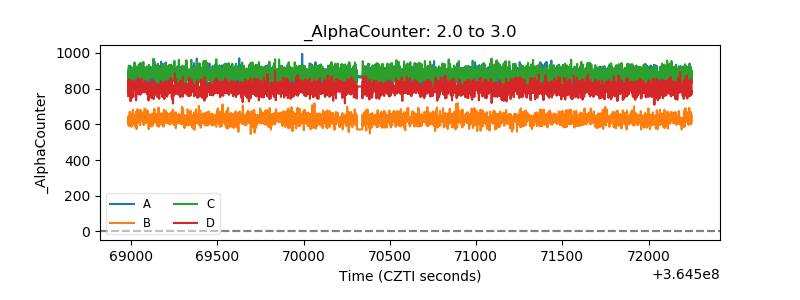 |
| _CPM_Rate | 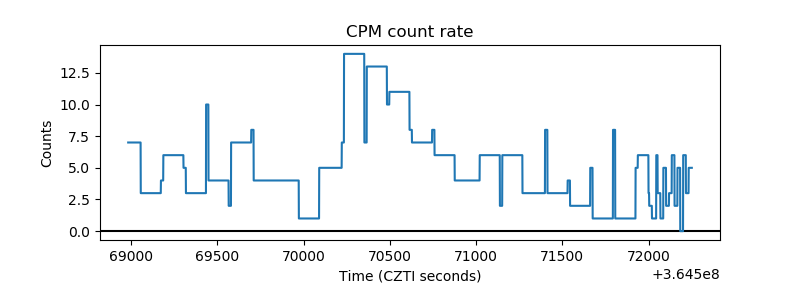 |
| CZT Counter |  |
| +2.5 Volts monitor |  |
| +5 Volts monitor | 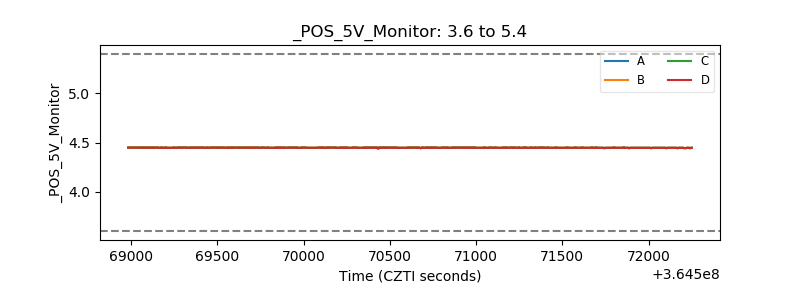 |
| _ROLL_ROT | 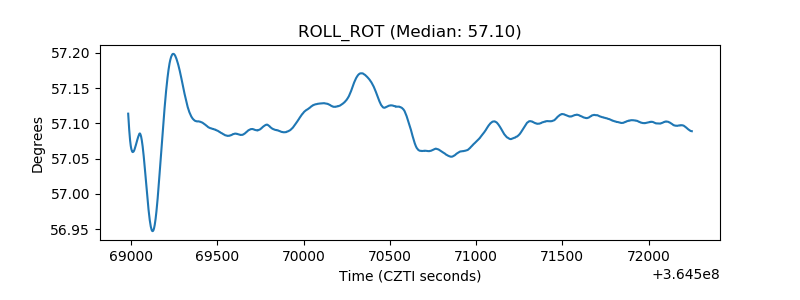 |
| _Roll_DEC |  |
| _Roll_RA | 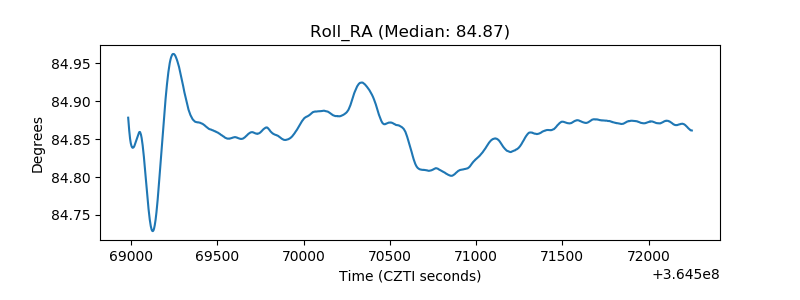 |
| Veto Counter | 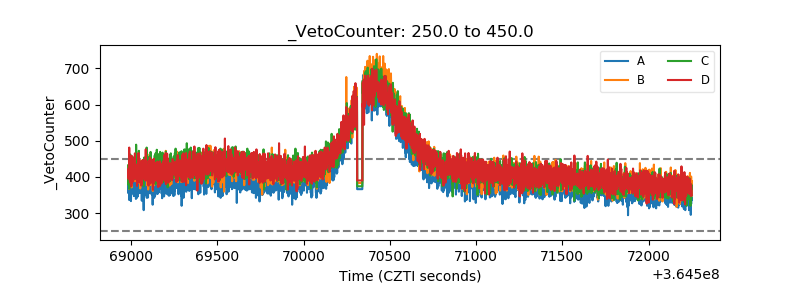 |