| Param | Original file | Final file |
|---|---|---|
| Filename | modeM0/AS1A10_094T33_9000004572_31431cztM0_level2.evt | modeM0/AS1A10_094T33_9000004572_31431cztM0_level2_quad_clean.evt |
| Size (bytes) | 345,121,920 | 61,626,240 |
| Size | 329.1 MB | 58.8 MB |
| Events in quadrant A | 1,494,464 | 425,209 |
| Events in quadrant B | 5,117,125 | 364,563 |
| Events in quadrant C | 1,524,037 | 420,107 |
| Events in quadrant D | 2,082,396 | 412,513 |
| Mode SS | |||
|---|---|---|---|
| Quadrant | BADHDUFLAG | Total packets | Discarded packets |
| A | 0 | 68 | 0 |
| B | 0 | 68 | 0 |
| C | 0 | 68 | 0 |
| D | 0 | 68 | 0 |
| Mode M0 | |||
|---|---|---|---|
| Quadrant | BADHDUFLAG | Total packets | Discarded packets |
| A | 0 | 6881 | 0 |
| B | 0 | 17642 | 0 |
| C | 0 | 6942 | 0 |
| D | 0 | 8544 | 0 |
| Quadrant | Total seconds | Saturated seconds | Saturation percentage |
|---|---|---|---|
| A | 3431 | 1 | 0.029146% |
| B | 3431 | 1303 | 37.977266% |
| C | 3431 | 26 | 0.757797% |
| D | 3431 | 60 | 1.748761% |
Noise dominated data is calculated using 1-second bins in cleaned event files. If a bin has >2000 counts, and if more than 50% of those come from <1% of pixels, then it is considered to be noise-dominated and hence unusable.
| Quadrant | # 1 sec bins | Bins with >0 counts | Bins with >2000 counts | High rate bins dominated by noise | Noise dominated (total time) | Noise dominated (detector-on time) | Marked lightcurve |
|---|---|---|---|---|---|---|---|
| A | 3431 | 3431 | 0 | 0 | 0.00% | 0.00% | 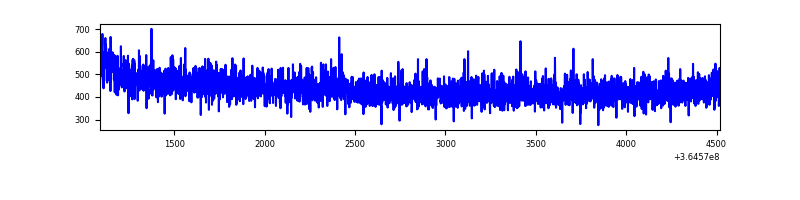 |
| B | 3431 | 3431 | 640 | 640 | 18.65% | 18.65% | 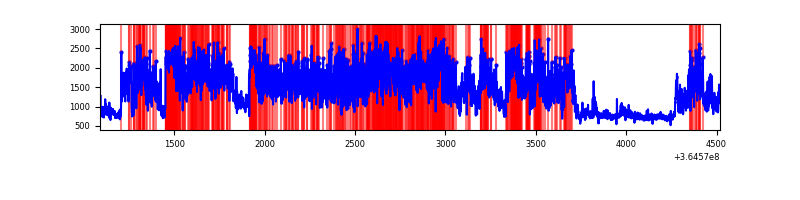 |
| C | 3431 | 3431 | 1 | 1 | 0.03% | 0.03% | 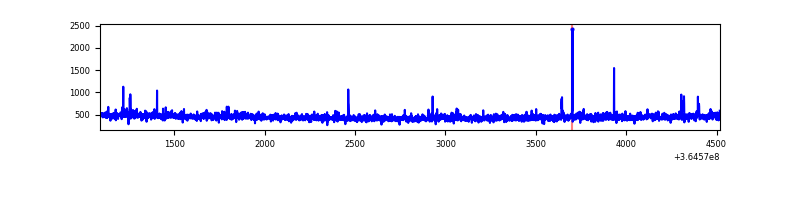 |
| D | 3431 | 3431 | 62 | 62 | 1.81% | 1.81% | 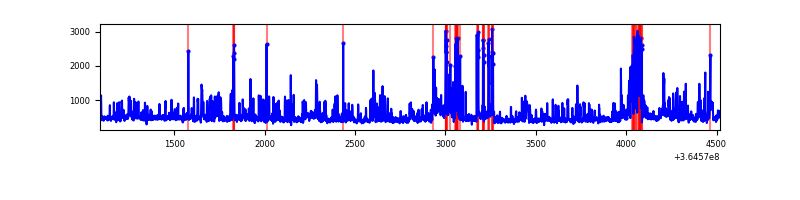 |
Top three noisy pixels from each quadrant. If the there are fewer than three noisy pixels in the level2.evt file, extra rows are filled as -1
| Pixel properties | Quadrant properties | ||||||
|---|---|---|---|---|---|---|---|
| Quadrant | DetID | PixID | Counts | Sigma | Mean | Median | Sigma |
| A | 12 | 16 | 18462 | 230.87 | 381 | 372 | 78.4 |
| A | 13 | 254 | 7230 | 87.52 | 381 | 372 | 78.4 |
| A | 12 | 194 | 5824 | 69.58 | 381 | 372 | 78.4 |
| B | 12 | 1 | 2447430 | 37313.01 | 337 | 328 | 65.6 |
| B | 6 | 159 | 836971 | 12757.0 | 337 | 328 | 65.6 |
| B | 12 | 2 | 284778 | 4337.25 | 337 | 328 | 65.6 |
| C | 14 | 238 | 69994 | 820.85 | 361 | 362 | 84.8 |
| C | 14 | 254 | 13711 | 157.36 | 361 | 362 | 84.8 |
| C | 3 | 233 | 11792 | 134.74 | 361 | 362 | 84.8 |
| D | 8 | 195 | 371576 | 3887.09 | 362 | 354 | 95.5 |
| D | 12 | 218 | 154067 | 1609.54 | 362 | 354 | 95.5 |
| D | 5 | 233 | 73312 | 763.95 | 362 | 354 | 95.5 |
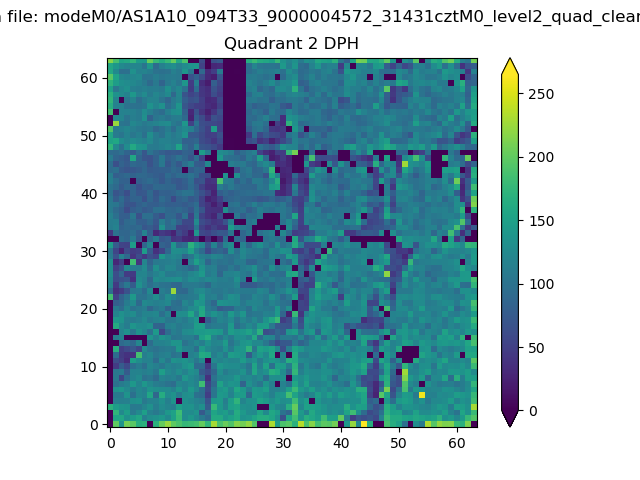
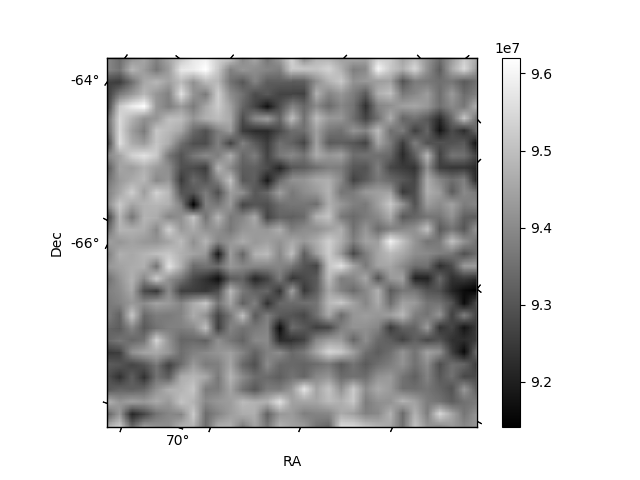
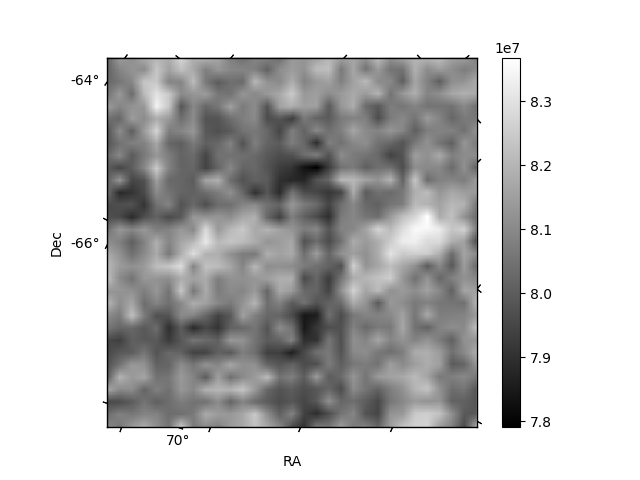
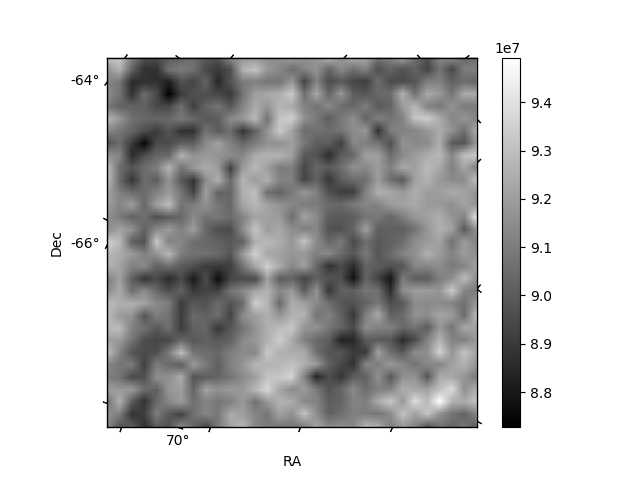
Histogram calculated using DETX and DETY for each event in the final _common_clean file
| Quadrant A | 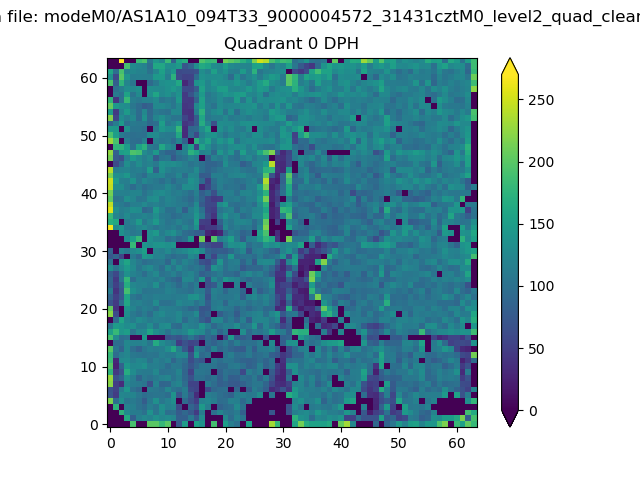 |
 |
Quadrant B |
|---|---|---|---|
| Quadrant D |  |
 |
Quadrant C |
| Plot type | Count rate plots | Images |
|---|---|---|
| Comparison with Poisson distribution Blue bars denote a histogram of data divided into 1 sec bins. Red curve is a Poisson curve with rate = median count rate of data. |
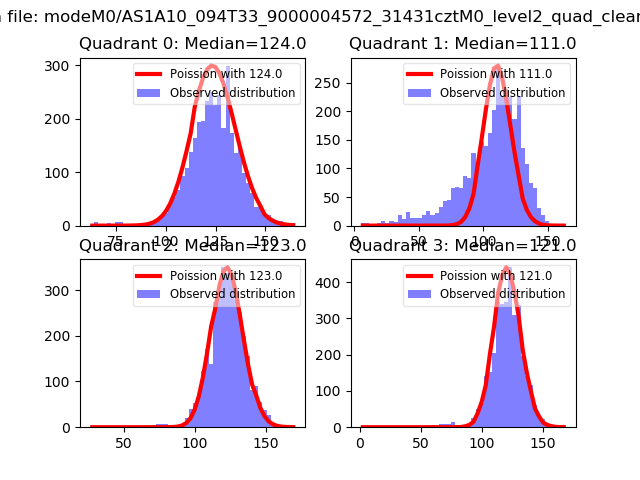 |
 |
| Quadrant-wise count rates Data is divided into 100 sec bins |
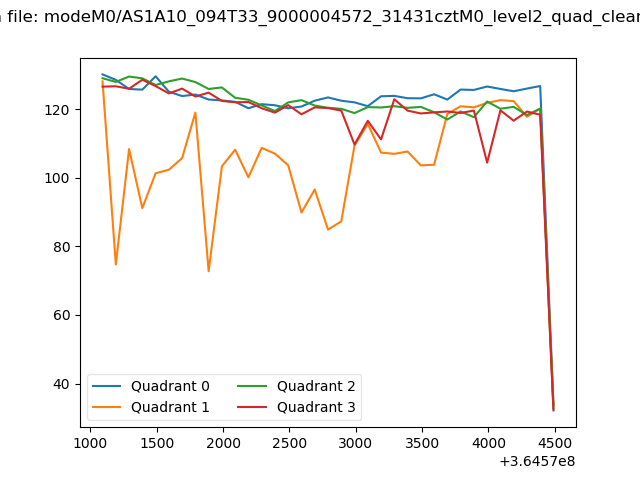 |
|
| Module-wise count rates for Quadrant A Data is divided into 100 sec bins |
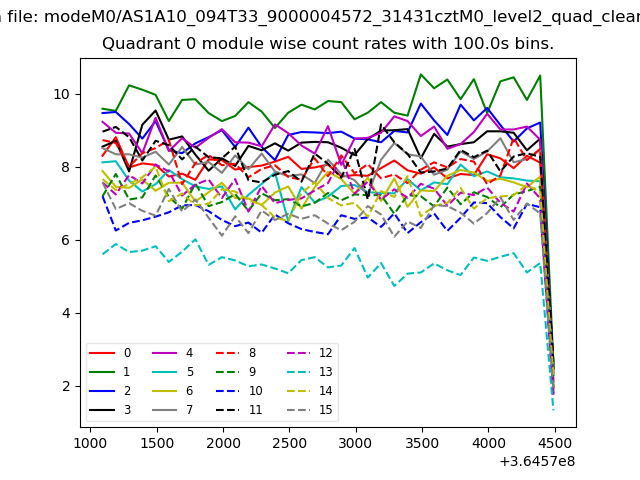 |
 |
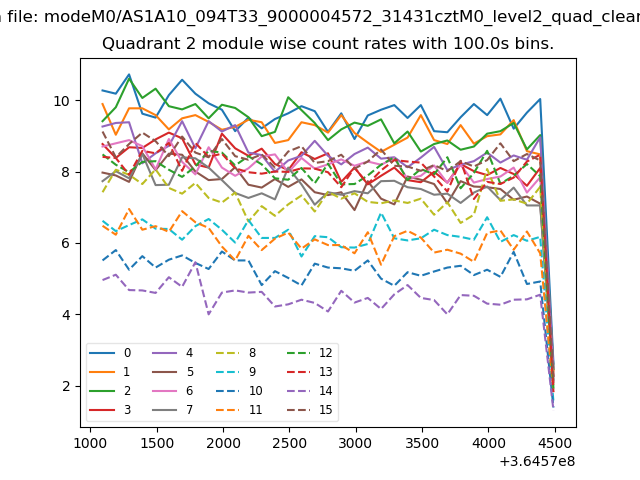
| Module-wise count rates for Quadrant B Data is divided into 100 sec bins |
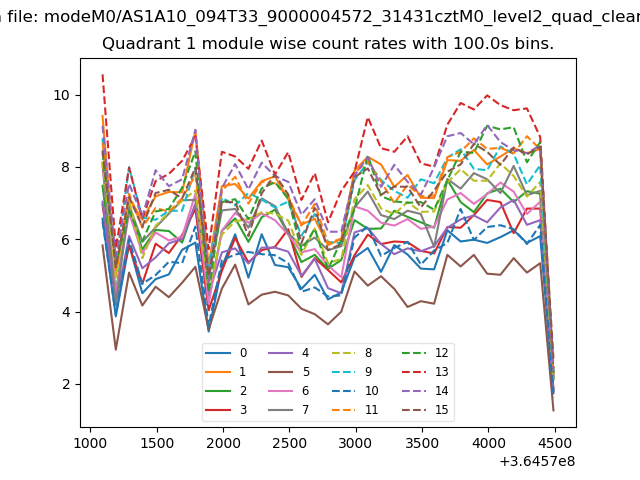 |
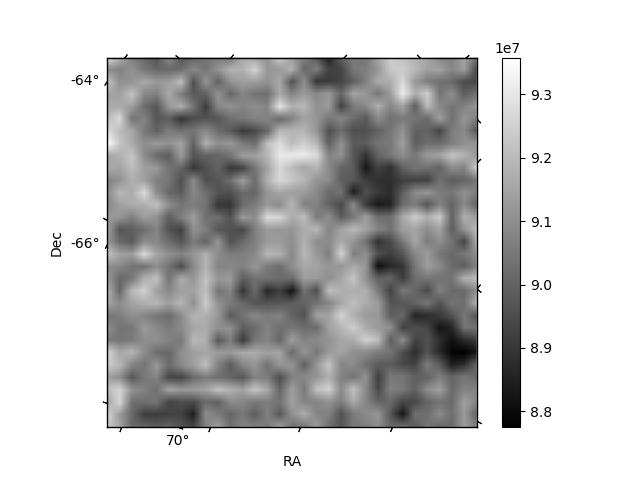 |
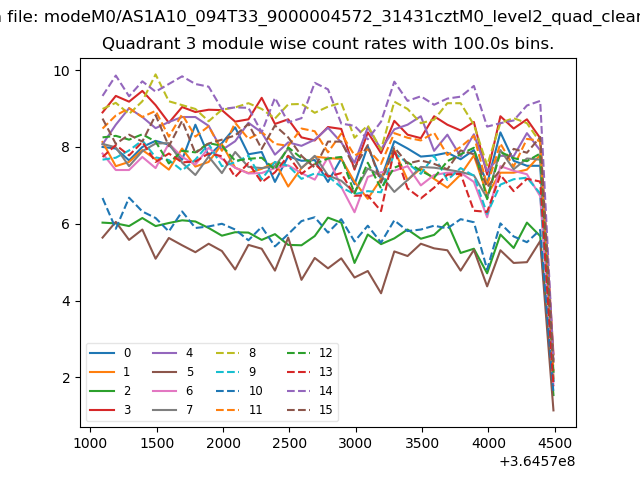
| Module-wise count rates for Quadrant C Data is divided into 100 sec bins |
 |
 |
| Module-wise count rates for Quadrant D Data is divided into 100 sec bins |
 |
 |
| Parameter | Plot |
|---|---|
| CZT HV Monitor | 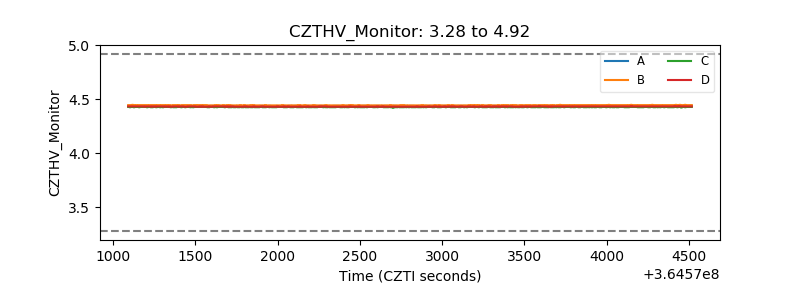 |
| D_VDD | 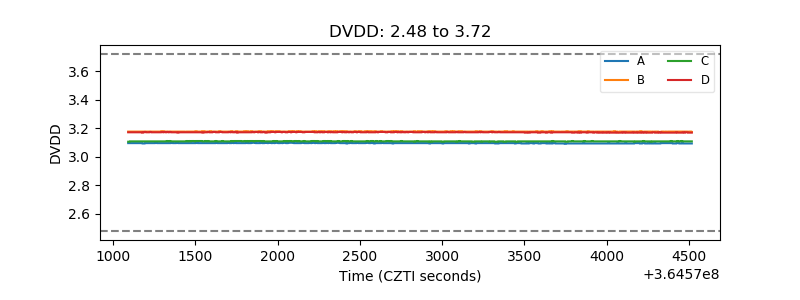 |
| Temperature 1 | 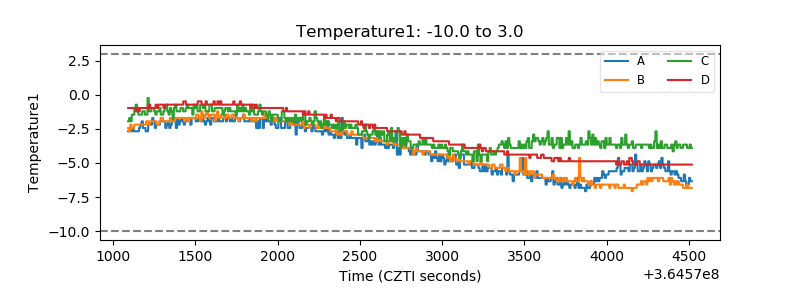 |
| Veto HV Monitor | 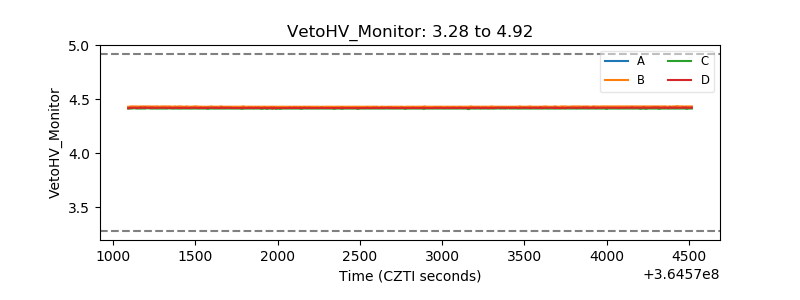 |
| Veto LLD | 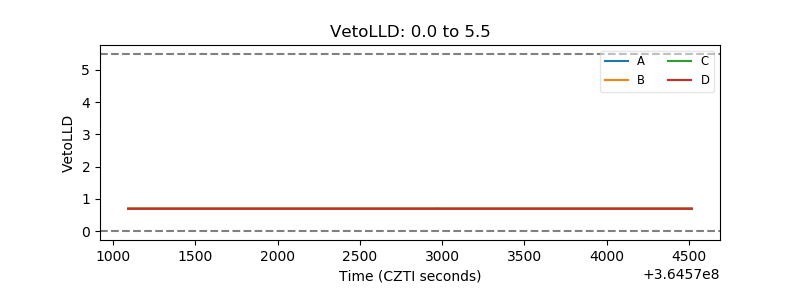 |
| Alpha Counter | 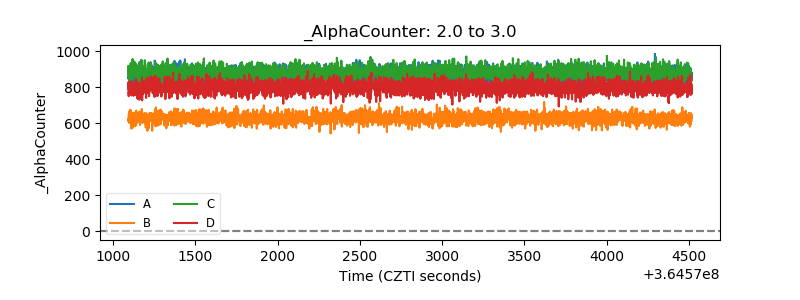 |
| _CPM_Rate | 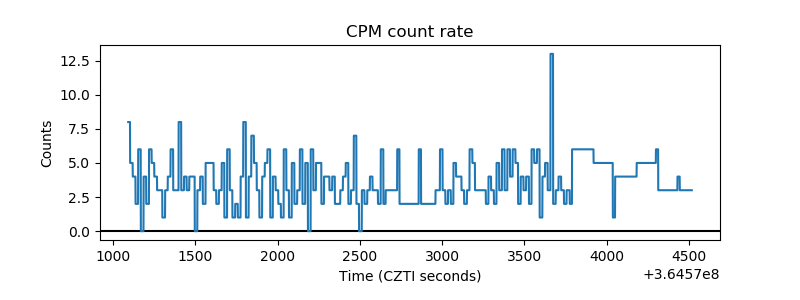 |
| CZT Counter | 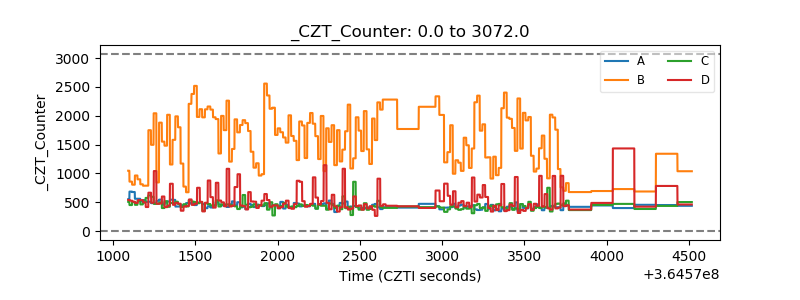 |
| +2.5 Volts monitor |  |
| +5 Volts monitor | 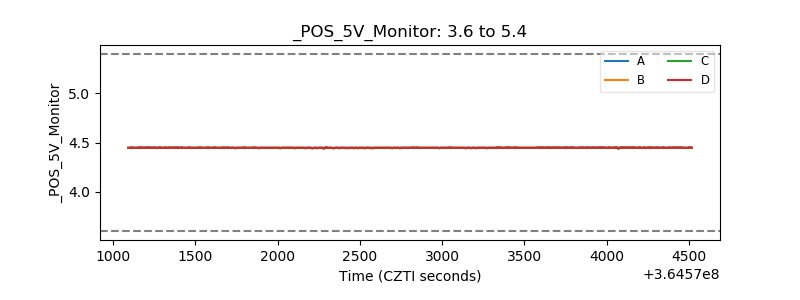 |
| _ROLL_ROT | 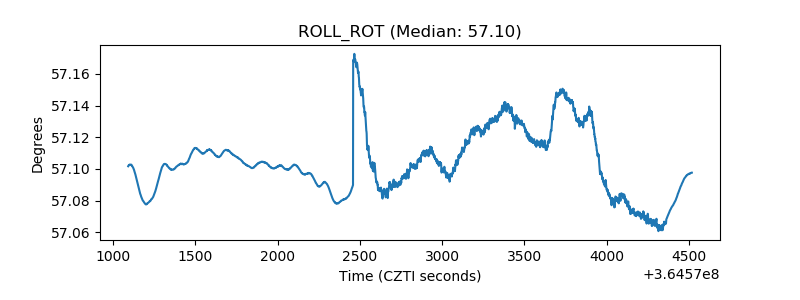 |
| _Roll_DEC | 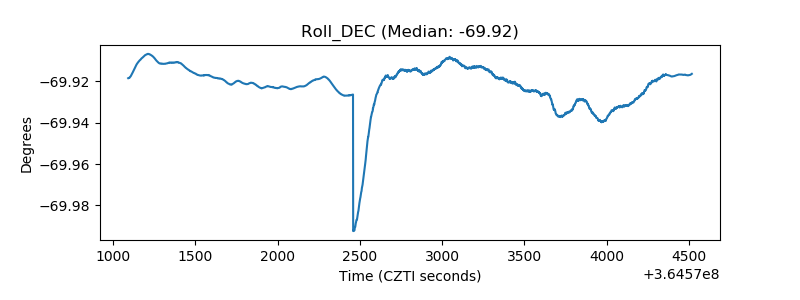 |
| _Roll_RA | 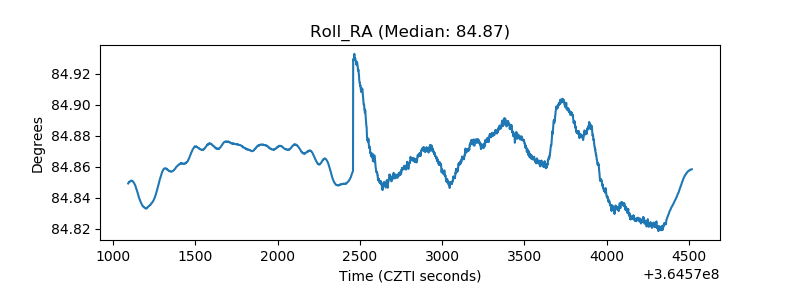 |
| Veto Counter | 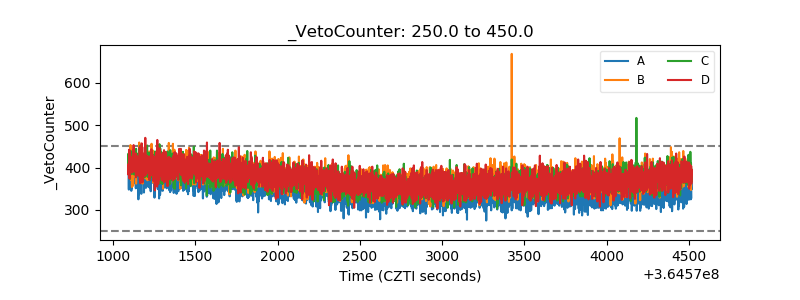 |