| Param | Original file | Final file |
|---|---|---|
| Filename | modeM0/AS1A10_094T34_9000004574cztM0_level2.fits | modeM0/AS1A10_094T34_9000004574cztM0_level2_quad_clean.evt |
| Size (bytes) | 48,850,560 | 68,184,000 |
| Size | 46.6 MB | 65.0 MB |
| Events in quadrant A | 300,390 | 450,607 |
| Events in quadrant B | 273,274 | 432,339 |
| Events in quadrant C | 285,378 | 419,189 |
| Events in quadrant D | 253,464 | 395,355 |
| Mode M0 | |||
|---|---|---|---|
| Quadrant | BADHDUFLAG | Total packets | Discarded packets |
| A | 0 | 10698 | 0 |
| B | 0 | 17803 | 0 |
| C | 0 | 11938 | 0 |
| D | 0 | 14412 | 0 |
| Mode SS | |||
|---|---|---|---|
| Quadrant | BADHDUFLAG | Total packets | Discarded packets |
| A | 0 | 108 | 0 |
| B | 0 | 108 | 0 |
| C | 0 | 108 | 0 |
| D | 0 | 108 | 0 |
| Mode M9 | |||
|---|---|---|---|
| Quadrant | BADHDUFLAG | Total packets | Discarded packets |
| A | 0 | 3 | 0 |
| B | 0 | 3 | 0 |
| C | 0 | 3 | 0 |
| D | 0 | 3 | 0 |
| Quadrant | Total seconds | Saturated seconds | Saturation percentage |
|---|---|---|---|
| A | 5232 | 58 | 1.108563% |
| B | 5232 | 287 | 5.485474% |
| C | 5232 | 327 | 6.250000% |
| D | 5232 | 227 | 4.338685% |
Noise dominated data is calculated using 1-second bins in cleaned event files. If a bin has >2000 counts, and if more than 50% of those come from <1% of pixels, then it is considered to be noise-dominated and hence unusable.
| Quadrant | # 1 sec bins | Bins with >0 counts | Bins with >2000 counts | High rate bins dominated by noise | Noise dominated (total time) | Noise dominated (detector-on time) | Marked lightcurve |
|---|---|---|---|---|---|---|---|
| A | 5542 | 5231 | 0 | 0 | 0.00% | 0.00% |  |
| B | 5542 | 5230 | 0 | 0 | 0.00% | 0.00% |  |
| C | 5542 | 5229 | 0 | 0 | 0.00% | 0.00% |  |
| D | 5542 | 5214 | 0 | 0 | 0.00% | 0.00% | 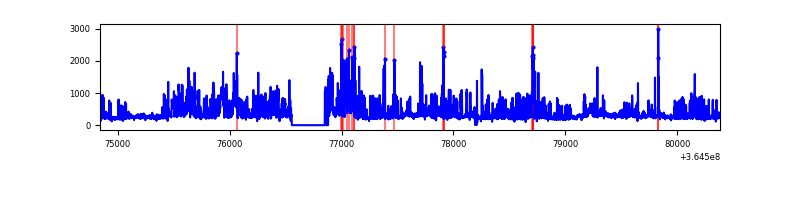 |
Top three noisy pixels from each quadrant. If the there are fewer than three noisy pixels in the level2.evt file, extra rows are filled as -1
| Pixel properties | Quadrant properties | ||||||
|---|---|---|---|---|---|---|---|
| Quadrant | DetID | PixID | Counts | Sigma | Mean | Median | Sigma |
| A | 0 | 29 | 288 | 10.15 | 78 | 74 | 21.1 |
| A | 14 | 79 | 241 | 7.92 | 78 | 74 | 21.1 |
| A | 15 | 236 | 230 | 7.4 | 78 | 74 | 21.1 |
| B | 2 | 9 | 207 | 8.22 | 72 | 69 | 16.8 |
| B | 5 | 128 | 205 | 8.1 | 72 | 69 | 16.8 |
| B | 3 | 17 | 199 | 7.74 | 72 | 69 | 16.8 |
| C | 3 | 126 | 213 | 6.74 | 75 | 71 | 21.1 |
| C | 12 | 241 | 209 | 6.55 | 75 | 71 | 21.1 |
| C | 3 | 235 | 204 | 6.31 | 75 | 71 | 21.1 |
| D | 15 | 47 | 207 | 6.71 | 72 | 66 | 21.0 |
| D | 1 | 31 | 200 | 6.38 | 72 | 66 | 21.0 |
| D | 15 | 63 | 198 | 6.28 | 72 | 66 | 21.0 |
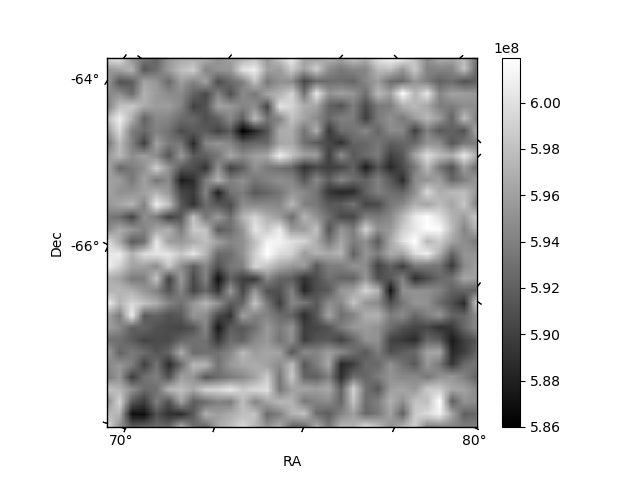
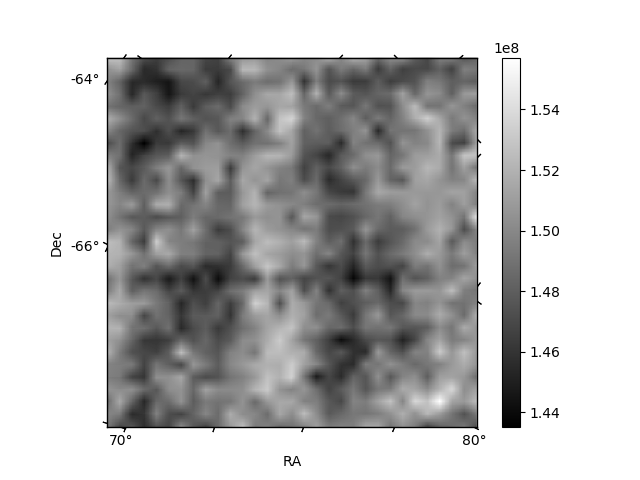
Histogram calculated using DETX and DETY for each event in the final _common_clean file
| Quadrant A | 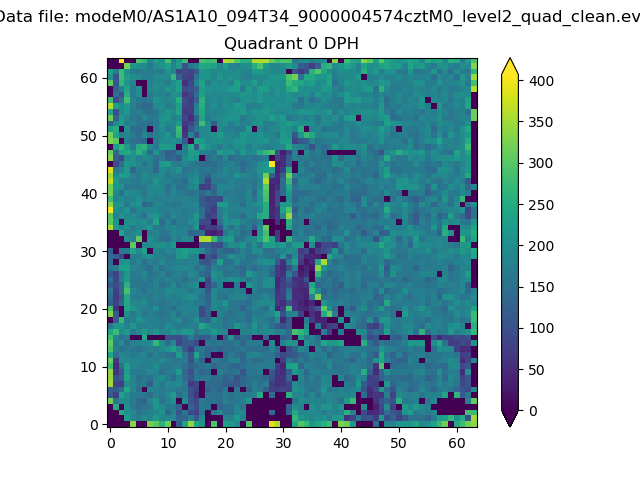 |
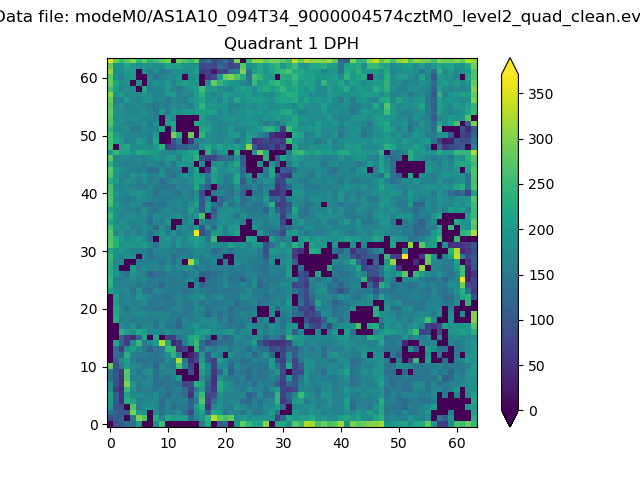 |
Quadrant B |
|---|---|---|---|
| Quadrant D | 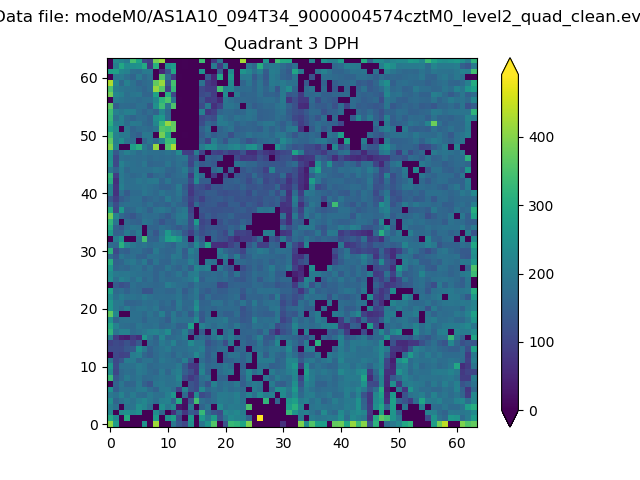 |
 |
Quadrant C |
| Plot type | Count rate plots | Images |
|---|---|---|
| Comparison with Poisson distribution Blue bars denote a histogram of data divided into 1 sec bins. Red curve is a Poisson curve with rate = median count rate of data. |
 |
 |
| Quadrant-wise count rates Data is divided into 100 sec bins |
 |
|
| Module-wise count rates for Quadrant A Data is divided into 100 sec bins |
 |
 |
| Module-wise count rates for Quadrant B Data is divided into 100 sec bins |
 |
 |
| Module-wise count rates for Quadrant C Data is divided into 100 sec bins |
 |
 |
| Module-wise count rates for Quadrant D Data is divided into 100 sec bins |
 |
 |
| Parameter | Plot |
|---|---|
| CZT HV Monitor |  |
| D_VDD |  |
| Temperature 1 | 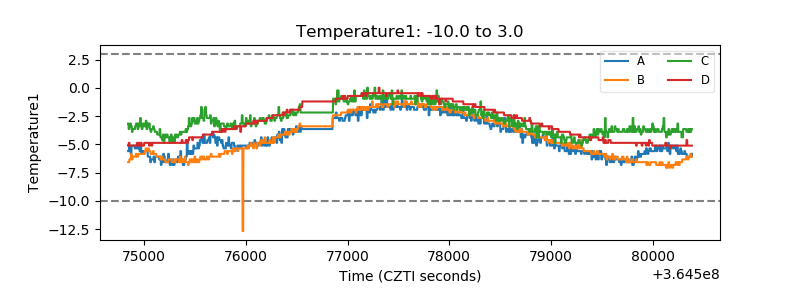 |
| Veto HV Monitor |  |
| Veto LLD | 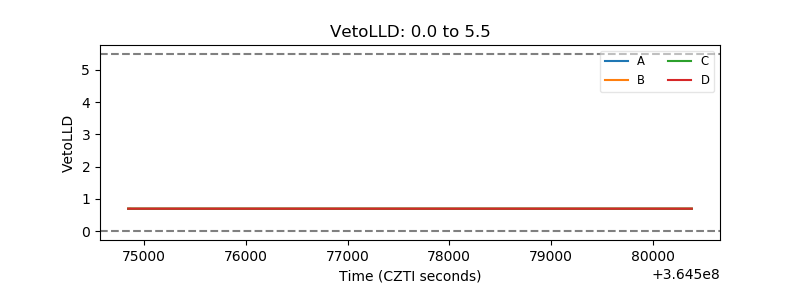 |
| Alpha Counter |  |
| _CPM_Rate | 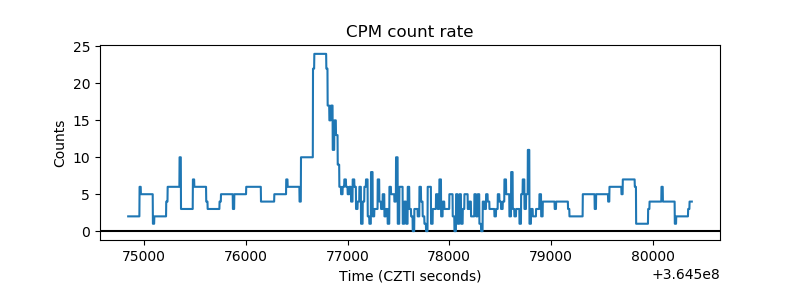 |
| CZT Counter | 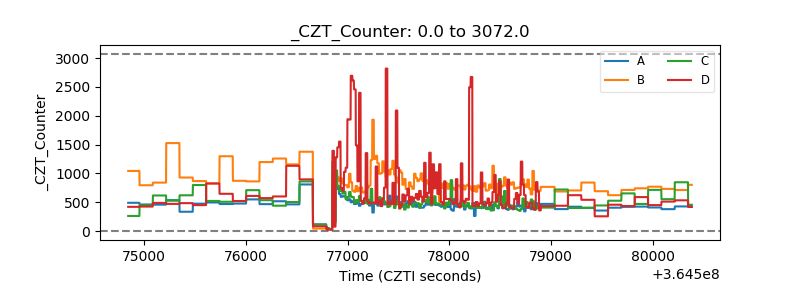 |
| +2.5 Volts monitor | 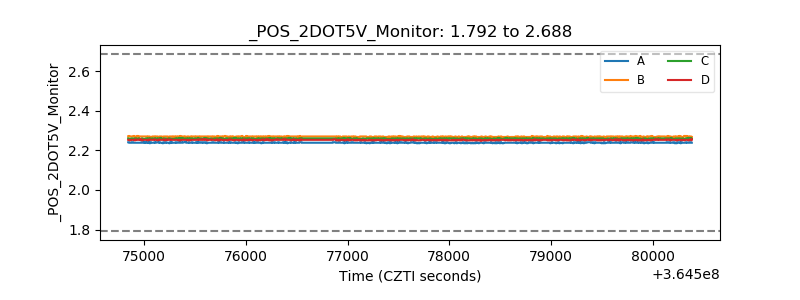 |
| +5 Volts monitor |  |
| _ROLL_ROT |  |
| _Roll_DEC |  |
| _Roll_RA | 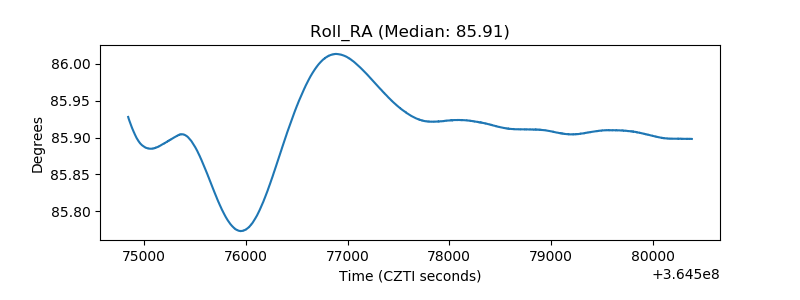 |
| Veto Counter | 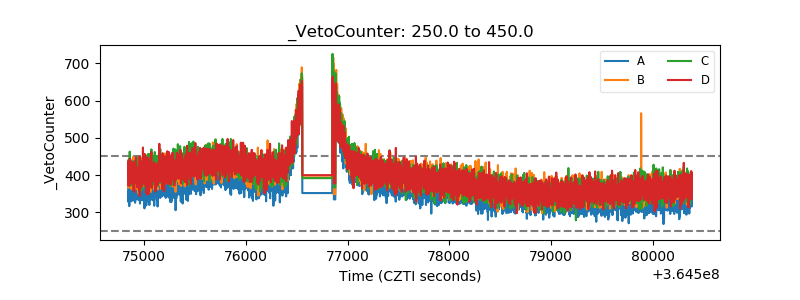 |