| Param | Original file | Final file |
|---|---|---|
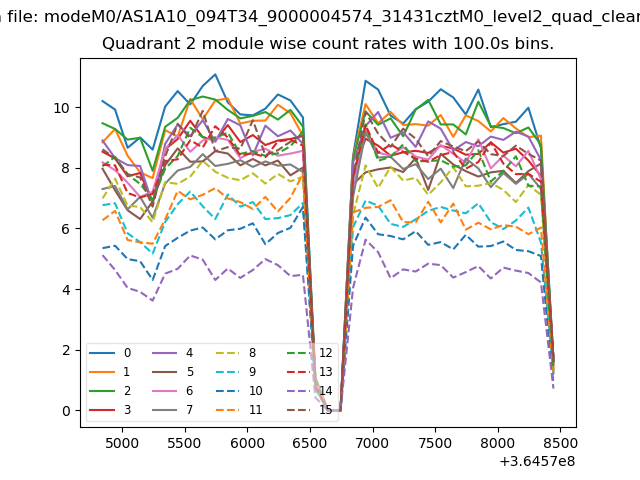
| Filename | modeM0/AS1A10_094T34_9000004574_31431cztM0_level2.evt | modeM0/AS1A10_094T34_9000004574_31431cztM0_level2_quad_clean.evt |
| Size (bytes) | 313,680,960 | 63,123,840 |
| Size | 299.1 MB | 60.2 MB |
| Events in quadrant A | 1,621,636 | 431,541 |
| Events in quadrant B | 3,261,371 | 417,414 |
| Events in quadrant C | 1,806,123 | 419,423 |
| Events in quadrant D | 2,584,228 | 407,282 |
| Mode M0 | |||
|---|---|---|---|
| Quadrant | BADHDUFLAG | Total packets | Discarded packets |
| A | 0 | 6862 | 1 |
| B | 0 | 11979 | 1 |
| C | 0 | 7370 | 1 |
| D | 0 | 9841 | 1 |
| Mode SS | |||
|---|---|---|---|
| Quadrant | BADHDUFLAG | Total packets | Discarded packets |
| A | 0 | 70 | 0 |
| B | 0 | 70 | 0 |
| C | 0 | 70 | 0 |
| D | 0 | 70 | 0 |
| Mode M9 | |||
|---|---|---|---|
| Quadrant | BADHDUFLAG | Total packets | Discarded packets |
| A | 0 | 3 | 0 |
| B | 0 | 3 | 0 |
| C | 0 | 3 | 0 |
| D | 0 | 3 | 0 |
| Quadrant | Total seconds | Saturated seconds | Saturation percentage |
|---|---|---|---|
| A | 3315 | 58 | 1.749623% |
| B | 3314 | 279 | 8.418829% |
| C | 3314 | 264 | 7.966204% |
| D | 3314 | 209 | 6.306578% |
Noise dominated data is calculated using 1-second bins in cleaned event files. If a bin has >2000 counts, and if more than 50% of those come from <1% of pixels, then it is considered to be noise-dominated and hence unusable.
| Quadrant | # 1 sec bins | Bins with >0 counts | Bins with >2000 counts | High rate bins dominated by noise | Noise dominated (total time) | Noise dominated (detector-on time) | Marked lightcurve |
|---|---|---|---|---|---|---|---|
| A | 3625 | 3316 | 0 | 0 | 0.00% | 0.00% | 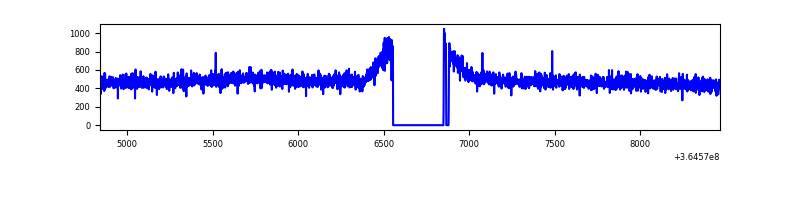 |
| B | 3624 | 3314 | 47 | 47 | 1.30% | 1.42% | 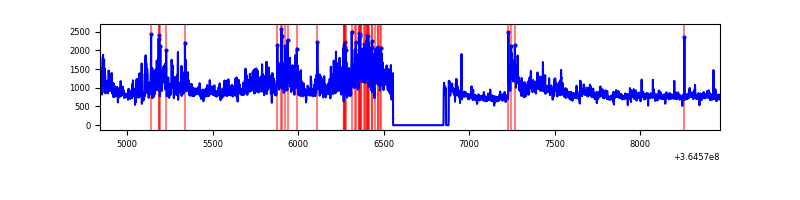 |
| C | 3624 | 3316 | 0 | 0 | 0.00% | 0.00% | 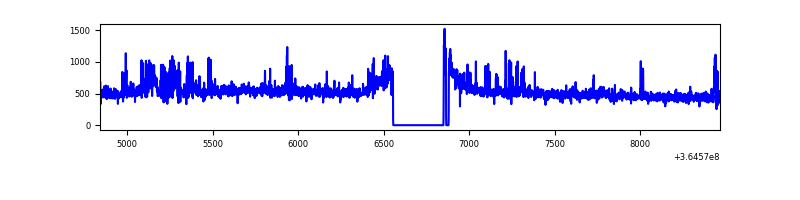 |
| D | 3624 | 3316 | 118 | 118 | 3.26% | 3.56% | 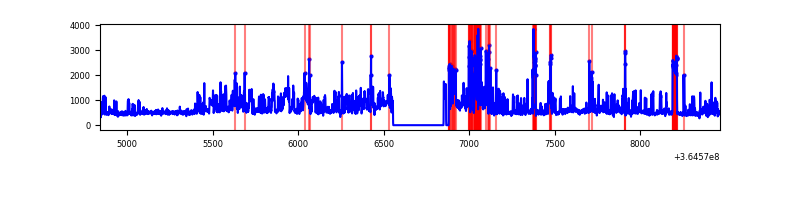 |
Top three noisy pixels from each quadrant. If the there are fewer than three noisy pixels in the level2.evt file, extra rows are filled as -1
| Pixel properties | Quadrant properties | ||||||
|---|---|---|---|---|---|---|---|
| Quadrant | DetID | PixID | Counts | Sigma | Mean | Median | Sigma |
| A | 13 | 254 | 6697 | 74.15 | 419 | 409 | 84.8 |
| A | 3 | 137 | 4353 | 46.51 | 419 | 409 | 84.8 |
| A | 0 | 226 | 3537 | 36.88 | 419 | 409 | 84.8 |
| B | 6 | 159 | 925564 | 11562.65 | 401 | 389 | 80.0 |
| B | 12 | 1 | 660060 | 8244.43 | 401 | 389 | 80.0 |
| B | 4 | 80 | 54091 | 671.16 | 401 | 389 | 80.0 |
| C | 14 | 238 | 112898 | 1189.48 | 397 | 397 | 94.6 |
| C | 14 | 254 | 70627 | 742.54 | 397 | 397 | 94.6 |
| C | 3 | 233 | 54609 | 573.18 | 397 | 397 | 94.6 |
| D | 12 | 218 | 416918 | 4318.68 | 403 | 392 | 96.4 |
| D | 8 | 195 | 377982 | 3914.98 | 403 | 392 | 96.4 |
| D | 13 | 249 | 109614 | 1132.45 | 403 | 392 | 96.4 |
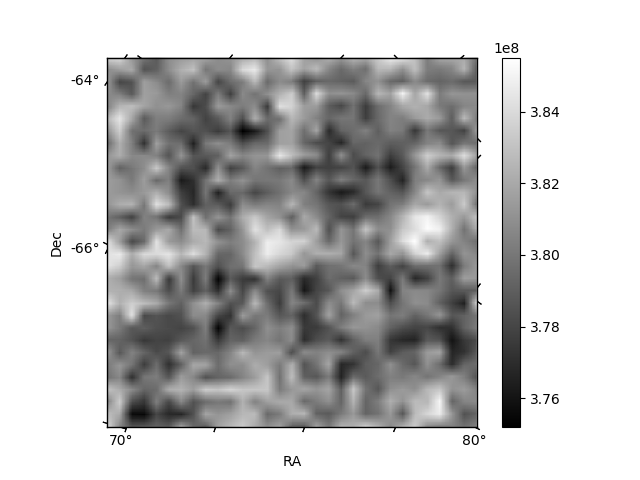
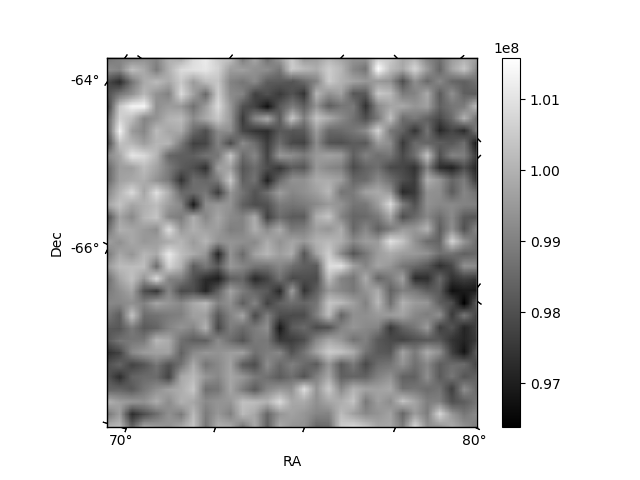
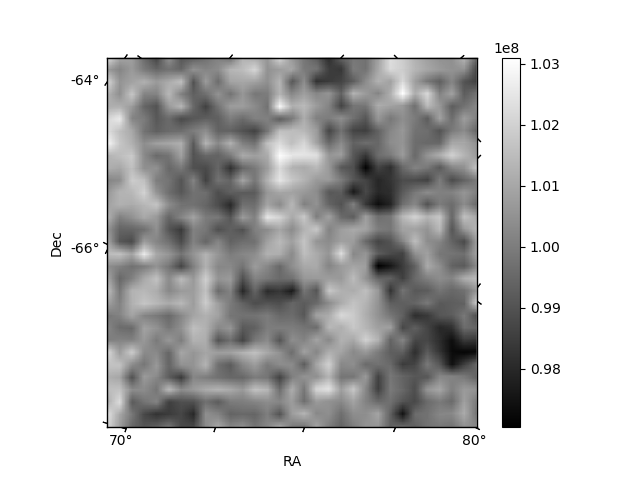
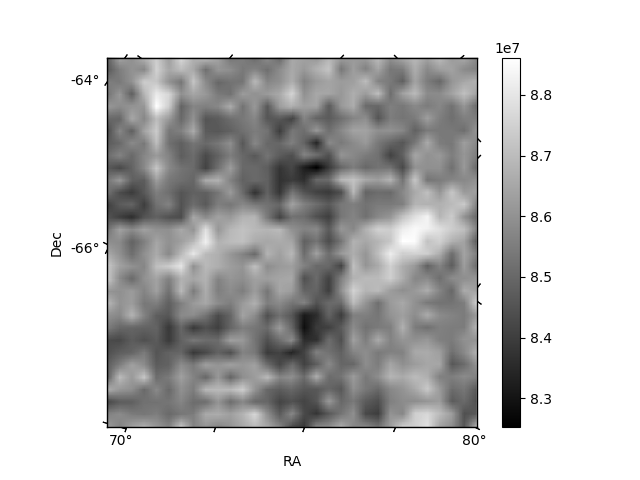
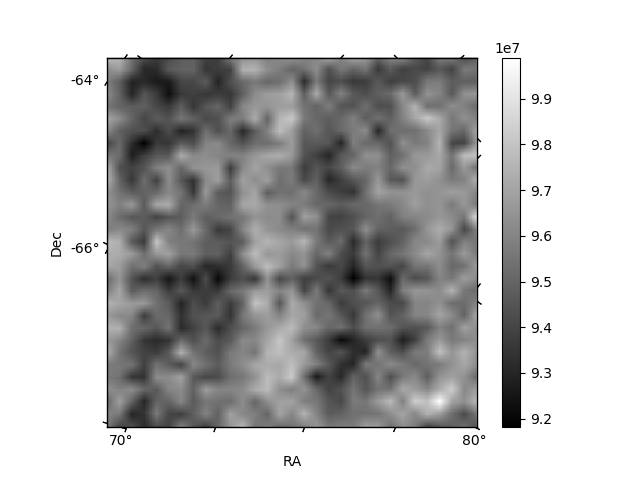
Histogram calculated using DETX and DETY for each event in the final _common_clean file
| Quadrant A | 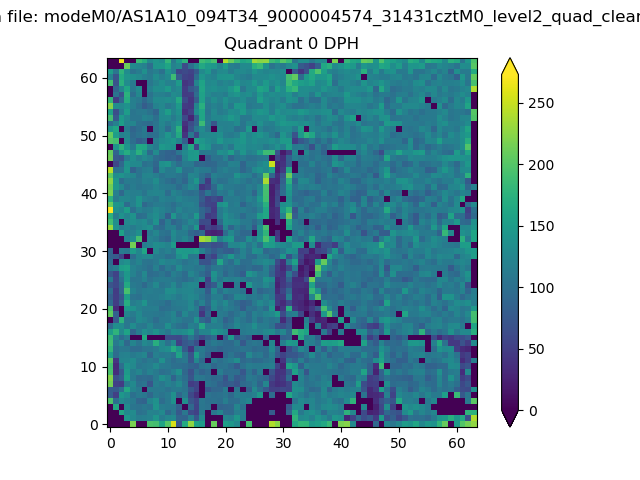 |
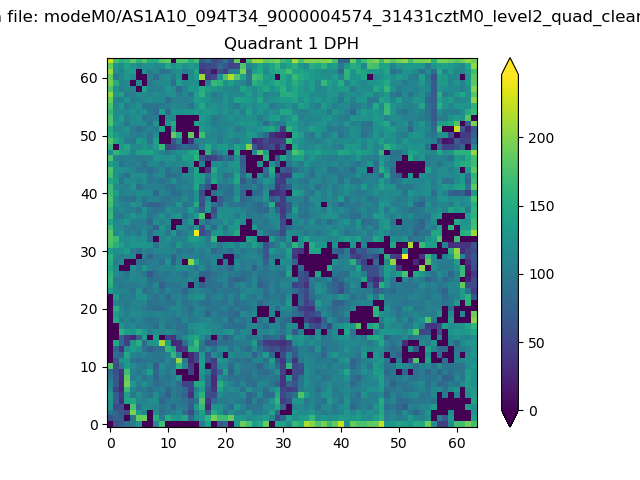 |
Quadrant B |
|---|---|---|---|
| Quadrant D | 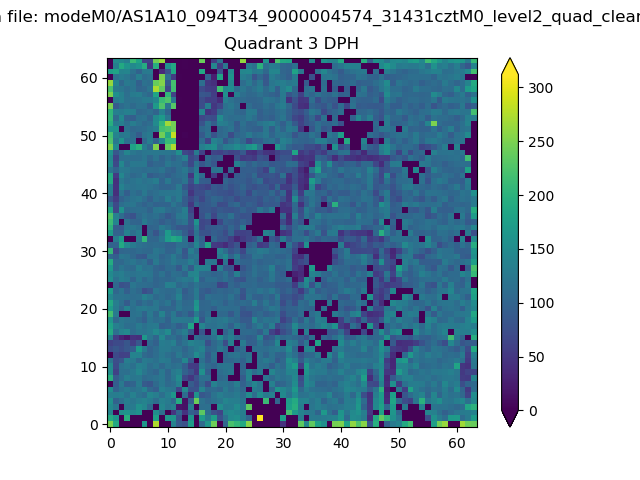 |
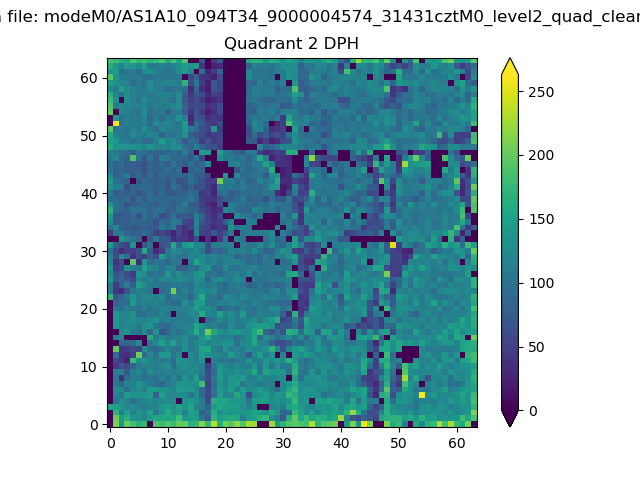 |
Quadrant C |
| Plot type | Count rate plots | Images |
|---|---|---|
| Comparison with Poisson distribution Blue bars denote a histogram of data divided into 1 sec bins. Red curve is a Poisson curve with rate = median count rate of data. |
 |
 |
| Quadrant-wise count rates Data is divided into 100 sec bins |
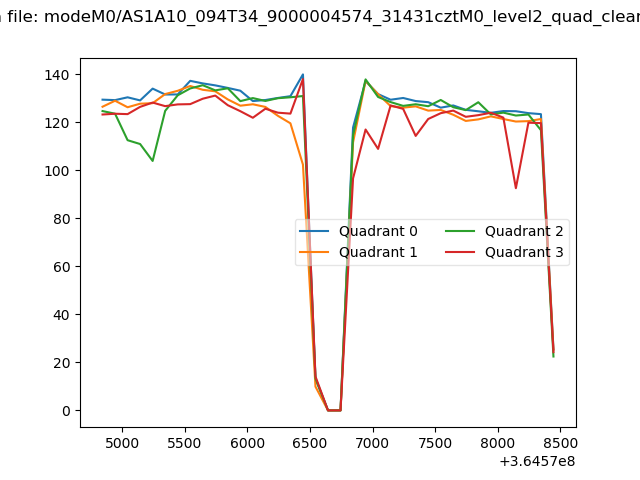 |
|
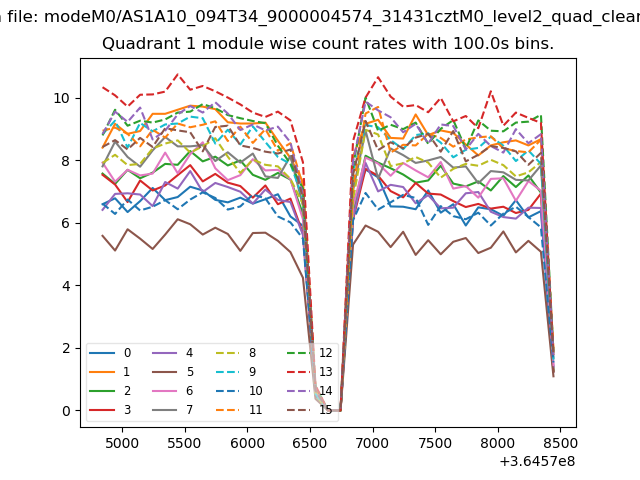
| Module-wise count rates for Quadrant A Data is divided into 100 sec bins |
 |
 |
| Module-wise count rates for Quadrant B Data is divided into 100 sec bins |
 |
 |
| Module-wise count rates for Quadrant C Data is divided into 100 sec bins |
 |
 |
| Module-wise count rates for Quadrant D Data is divided into 100 sec bins |
 |
 |
| Parameter | Plot |
|---|---|
| CZT HV Monitor | 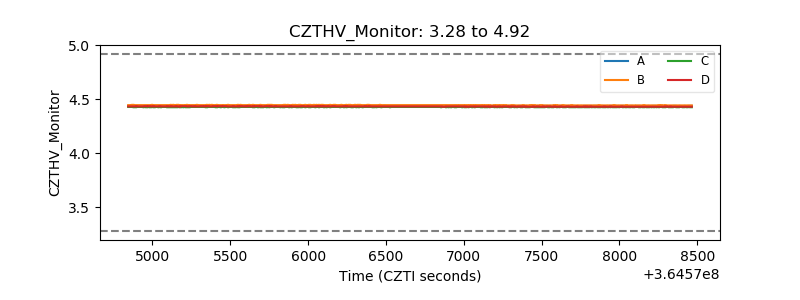 |
| D_VDD | 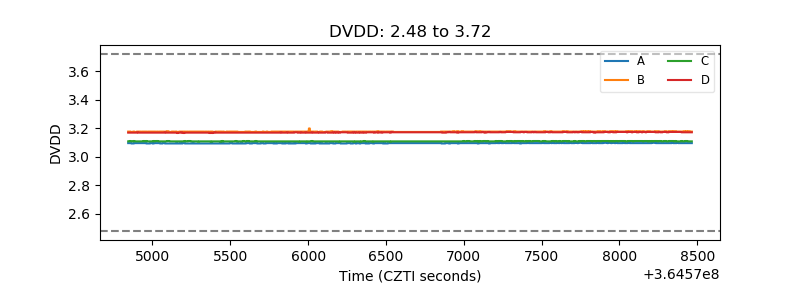 |
| Temperature 1 | 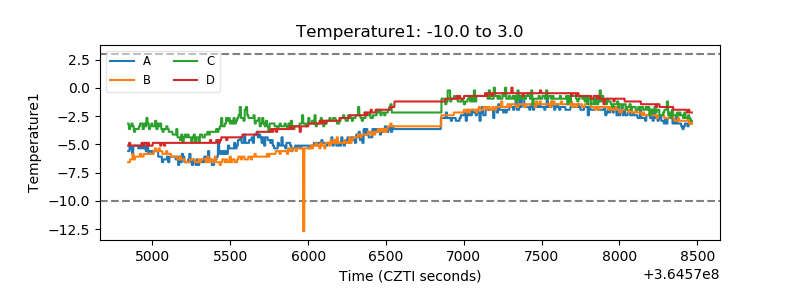 |
| Veto HV Monitor | 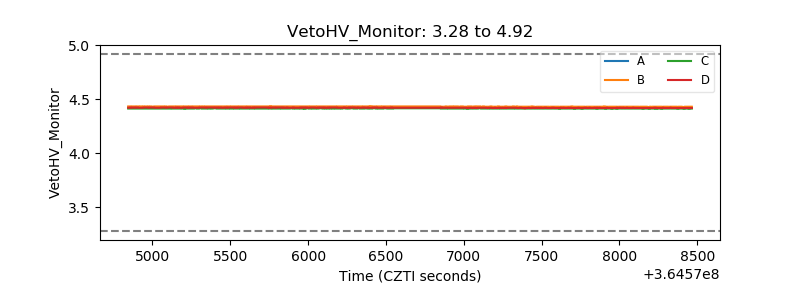 |
| Veto LLD | 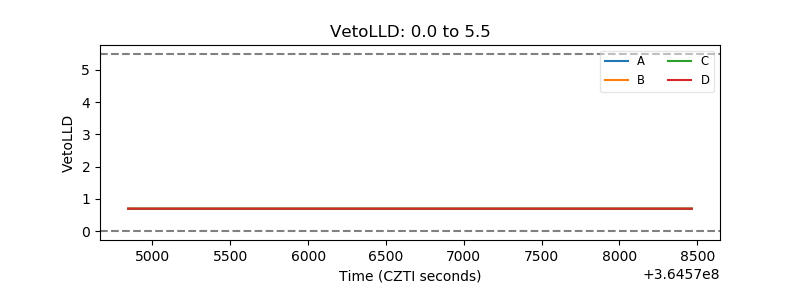 |
| Alpha Counter | 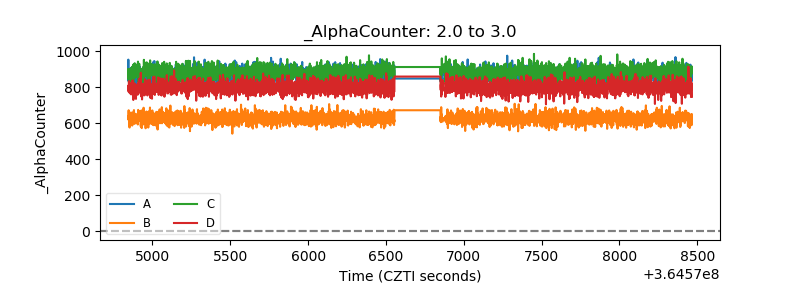 |
| _CPM_Rate | 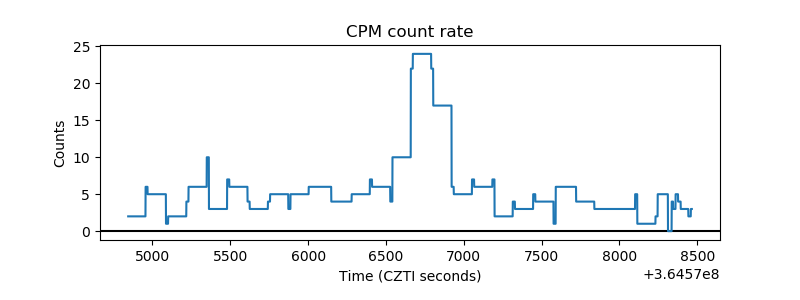 |
| CZT Counter | 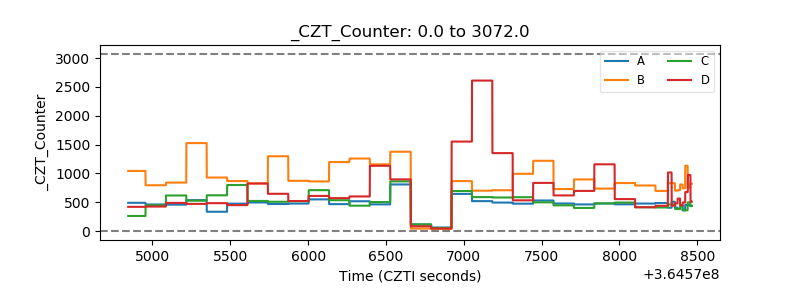 |
| +2.5 Volts monitor |  |
| +5 Volts monitor |  |
| _ROLL_ROT |  |
| _Roll_DEC |  |
| _Roll_RA | 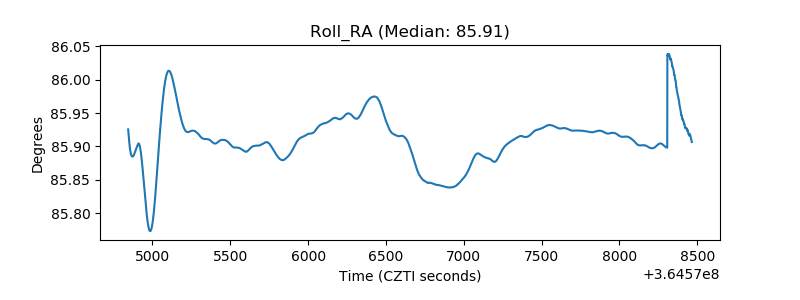 |
| Veto Counter |  |