| Param | Original file | Final file |
|---|---|---|
| Filename | modeM0/AS1A10_094T34_9000004574_31433cztM0_level2.evt | modeM0/AS1A10_094T34_9000004574_31433cztM0_level2_quad_clean.evt |
| Size (bytes) | 238,775,040 | 54,434,880 |
| Size | 227.7 MB | 51.9 MB |
| Events in quadrant A | 1,277,193 | 368,539 |
| Events in quadrant B | 2,310,646 | 360,604 |
| Events in quadrant C | 1,585,206 | 355,124 |
| Events in quadrant D | 1,853,509 | 350,948 |
| Mode M0 | |||
|---|---|---|---|
| Quadrant | BADHDUFLAG | Total packets | Discarded packets |
| A | 0 | 5983 | 0 |
| B | 0 | 9201 | 0 |
| C | 0 | 6748 | 0 |
| D | 0 | 7467 | 0 |
| Mode SS | |||
|---|---|---|---|
| Quadrant | BADHDUFLAG | Total packets | Discarded packets |
| A | 0 | 60 | 0 |
| B | 0 | 60 | 0 |
| C | 0 | 60 | 0 |
| D | 0 | 60 | 0 |
| Quadrant | Total seconds | Saturated seconds | Saturation percentage |
|---|---|---|---|
| A | 2988 | 1 | 0.033467% |
| B | 2989 | 18 | 0.602208% |
| C | 2989 | 83 | 2.776848% |
| D | 2989 | 57 | 1.906992% |
Noise dominated data is calculated using 1-second bins in cleaned event files. If a bin has >2000 counts, and if more than 50% of those come from <1% of pixels, then it is considered to be noise-dominated and hence unusable.
| Quadrant | # 1 sec bins | Bins with >0 counts | Bins with >2000 counts | High rate bins dominated by noise | Noise dominated (total time) | Noise dominated (detector-on time) | Marked lightcurve |
|---|---|---|---|---|---|---|---|
| A | 2988 | 2988 | 0 | 0 | 0.00% | 0.00% | 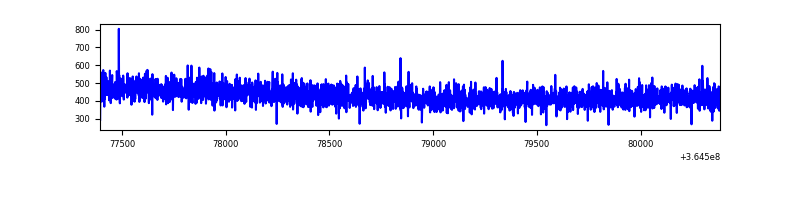 |
| B | 2989 | 2989 | 4 | 4 | 0.13% | 0.13% | 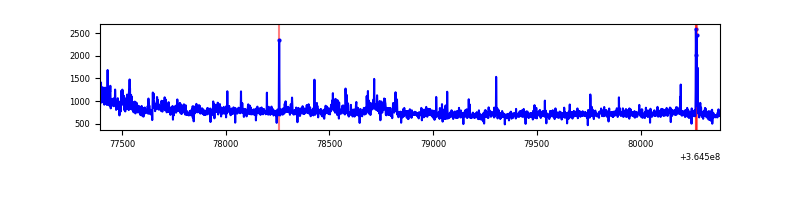 |
| C | 2989 | 2989 | 9 | 9 | 0.30% | 0.30% | 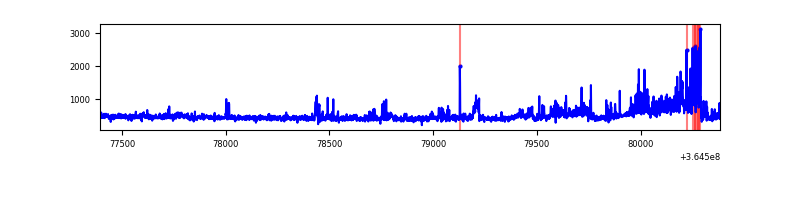 |
| D | 2989 | 2989 | 55 | 55 | 1.84% | 1.84% | 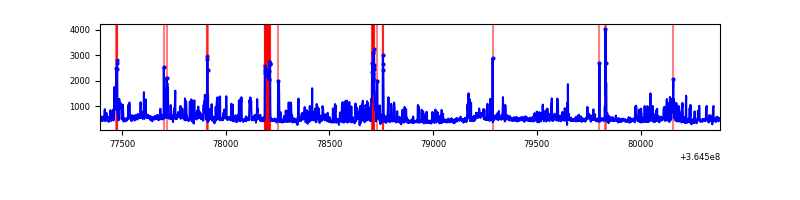 |
Top three noisy pixels from each quadrant. If the there are fewer than three noisy pixels in the level2.evt file, extra rows are filled as -1
| Pixel properties | Quadrant properties | ||||||
|---|---|---|---|---|---|---|---|
| Quadrant | DetID | PixID | Counts | Sigma | Mean | Median | Sigma |
| A | 13 | 254 | 6640 | 92.81 | 330 | 322 | 68.1 |
| A | 3 | 137 | 3320 | 44.04 | 330 | 322 | 68.1 |
| A | 0 | 226 | 2821 | 36.71 | 330 | 322 | 68.1 |
| B | 6 | 159 | 852397 | 13267.2 | 325 | 317 | 64.2 |
| B | 12 | 1 | 98097 | 1522.47 | 325 | 317 | 64.2 |
| B | 4 | 80 | 25091 | 385.74 | 325 | 317 | 64.2 |
| C | 3 | 233 | 247897 | 3363.58 | 309 | 312 | 73.6 |
| C | 14 | 238 | 75231 | 1017.82 | 309 | 312 | 73.6 |
| C | 14 | 254 | 34818 | 468.78 | 309 | 312 | 73.6 |
| D | 8 | 195 | 266554 | 3454.94 | 312 | 303 | 77.1 |
| D | 13 | 249 | 122316 | 1583.27 | 312 | 303 | 77.1 |
| D | 1 | 52 | 94253 | 1219.12 | 312 | 303 | 77.1 |
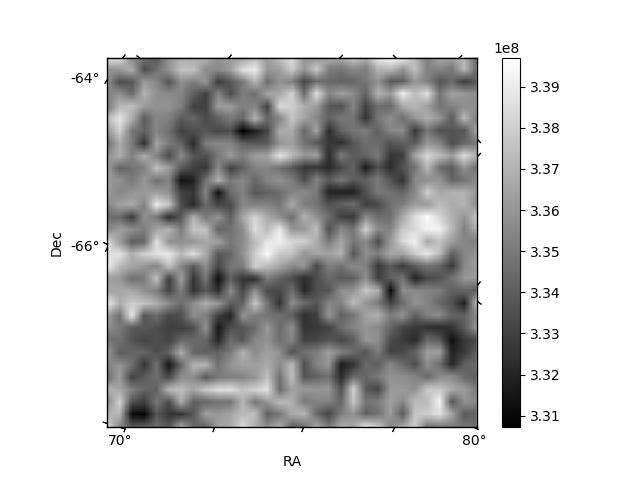
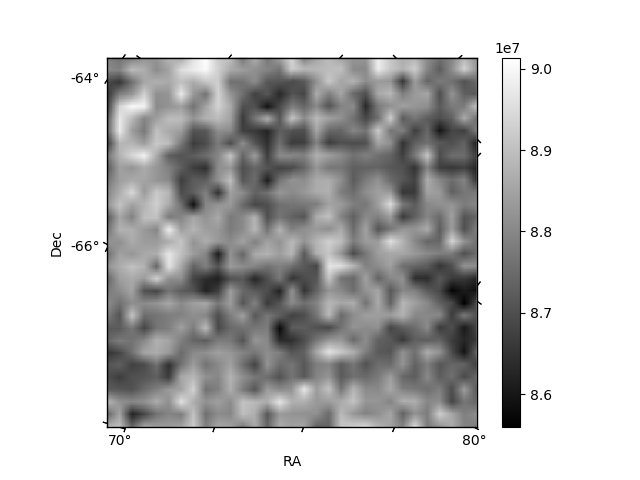
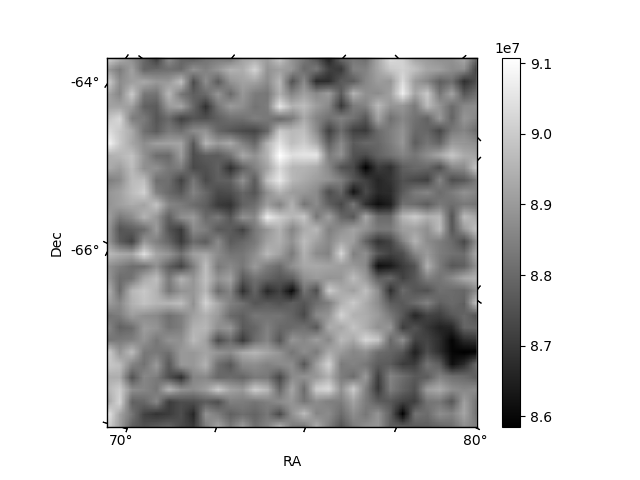
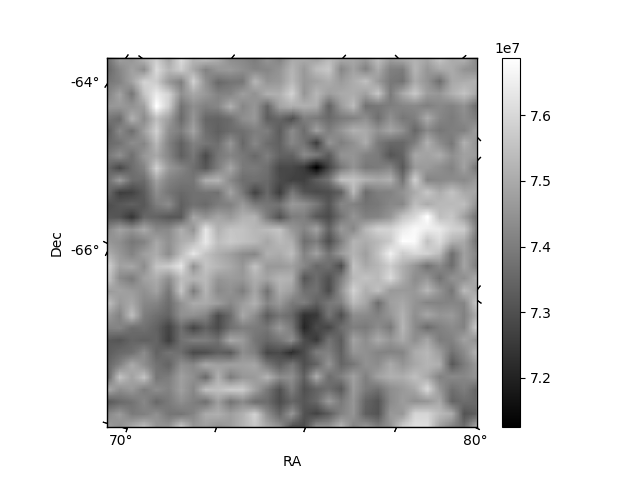
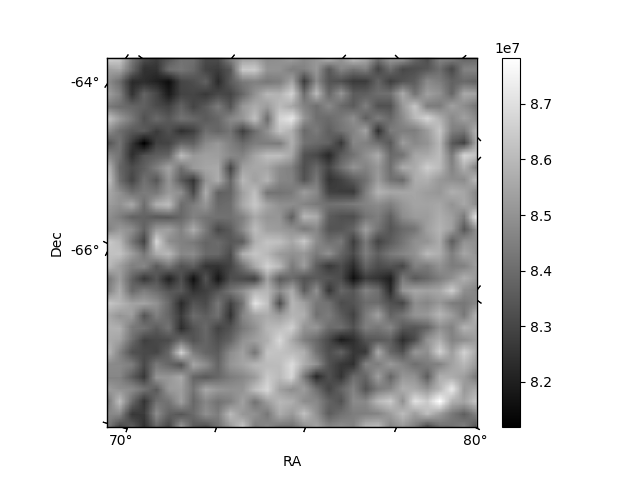
Histogram calculated using DETX and DETY for each event in the final _common_clean file
| Quadrant A | 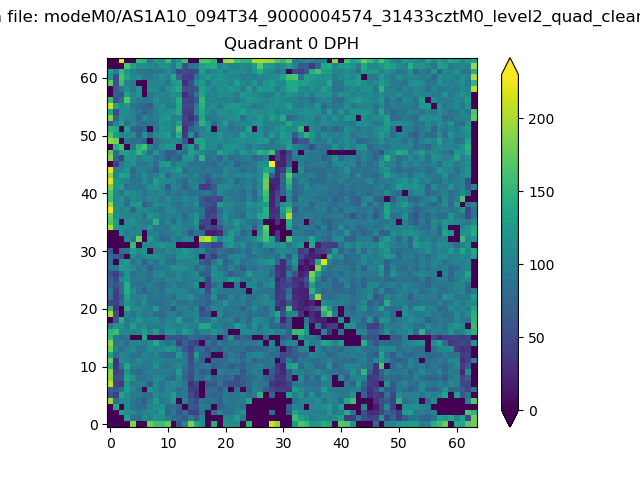 |
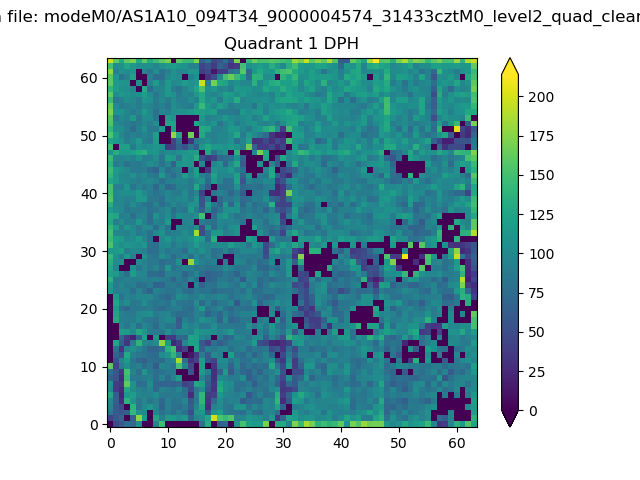 |
Quadrant B |
|---|---|---|---|
| Quadrant D | 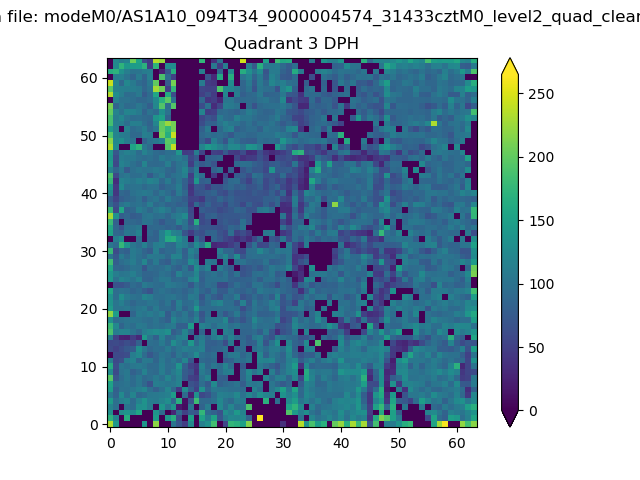 |
 |
Quadrant C |
| Plot type | Count rate plots | Images |
|---|---|---|
| Comparison with Poisson distribution Blue bars denote a histogram of data divided into 1 sec bins. Red curve is a Poisson curve with rate = median count rate of data. |
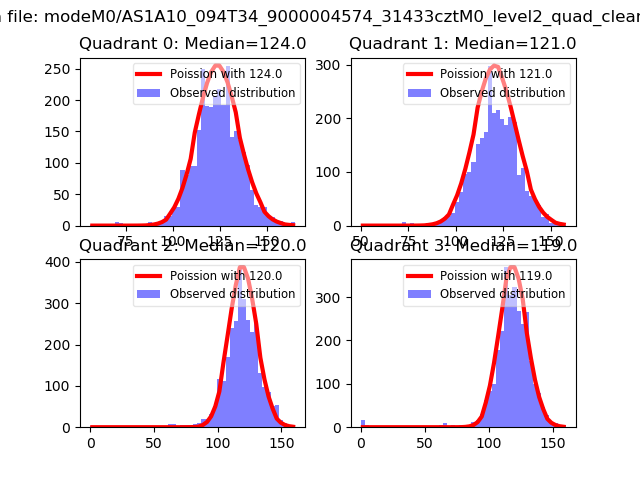 |
 |
| Quadrant-wise count rates Data is divided into 100 sec bins |
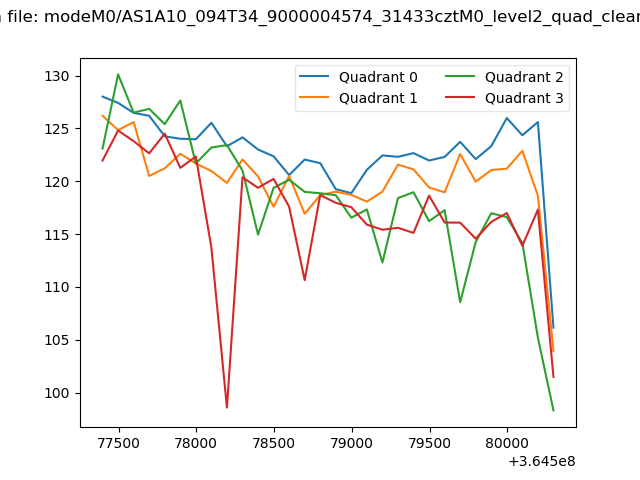 |
|
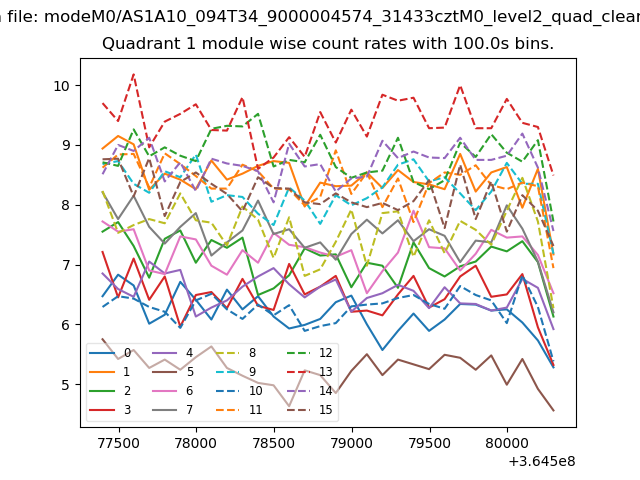
| Module-wise count rates for Quadrant A Data is divided into 100 sec bins |
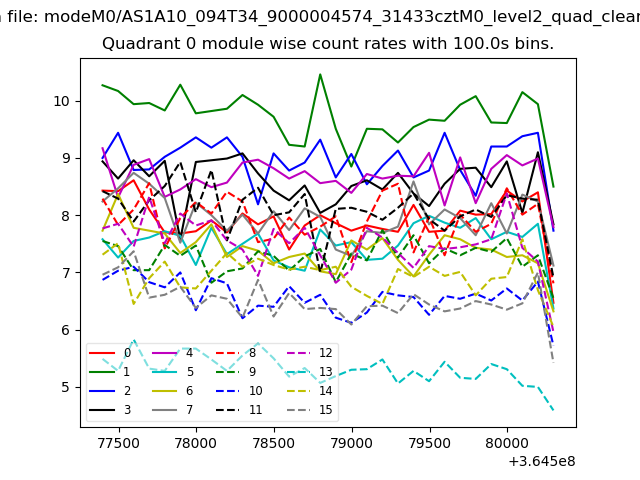 |
 |
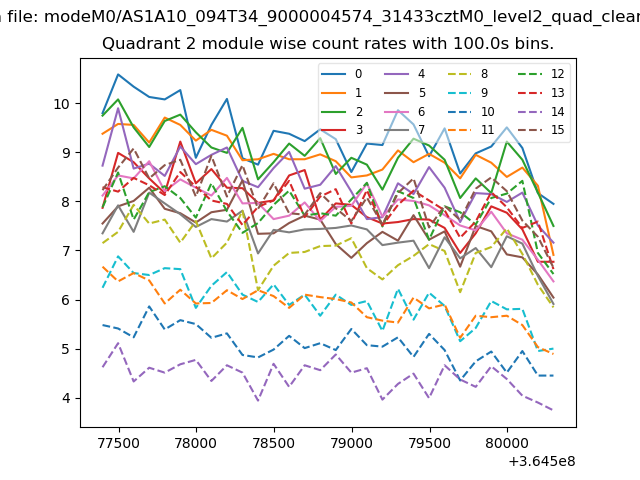
| Module-wise count rates for Quadrant B Data is divided into 100 sec bins |
 |
 |
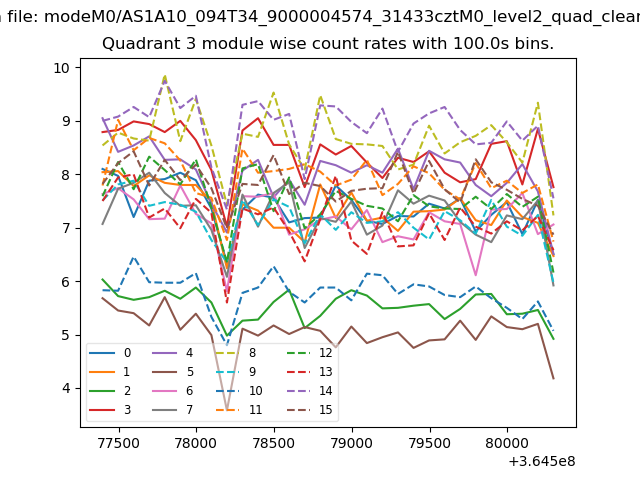
| Module-wise count rates for Quadrant C Data is divided into 100 sec bins |
 |
 |
| Module-wise count rates for Quadrant D Data is divided into 100 sec bins |
 |
 |
| Parameter | Plot |
|---|---|
| CZT HV Monitor | 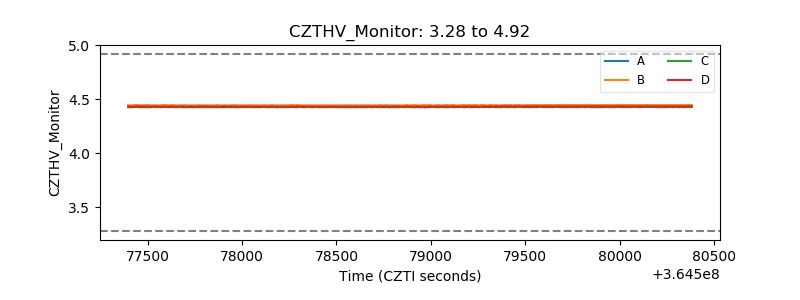 |
| D_VDD | 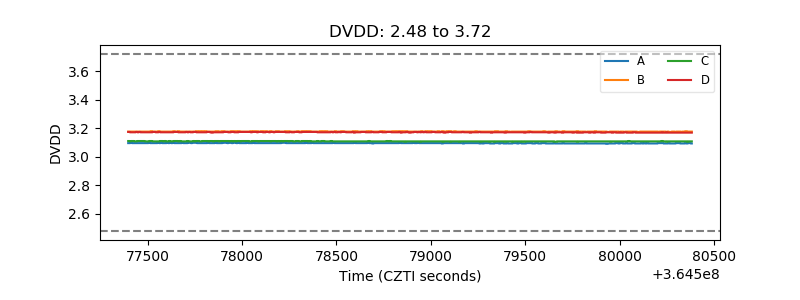 |
| Temperature 1 | 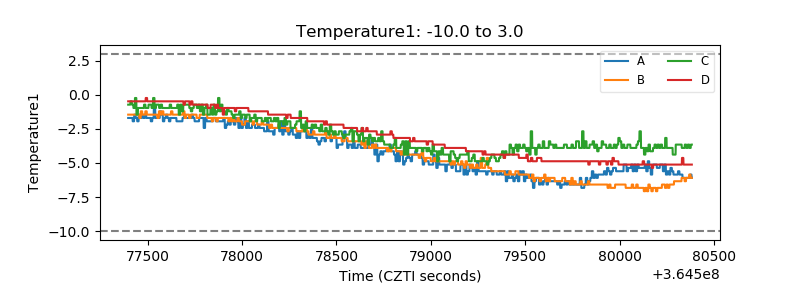 |
| Veto HV Monitor | 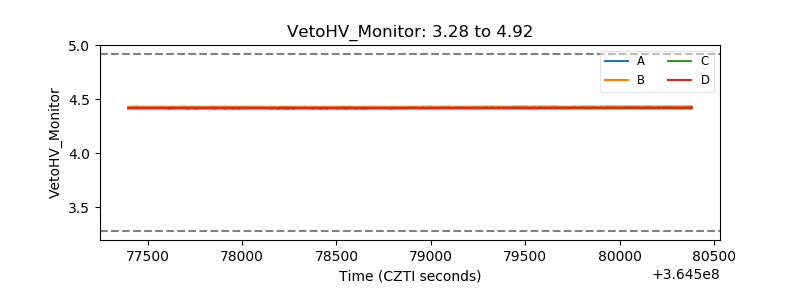 |
| Veto LLD | 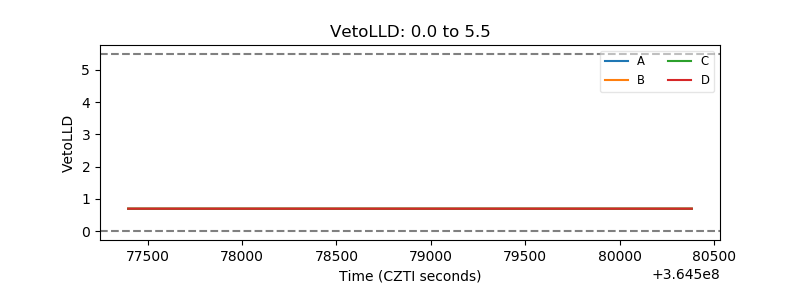 |
| Alpha Counter | 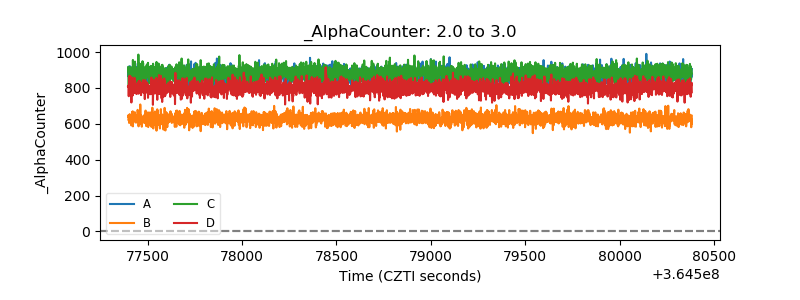 |
| _CPM_Rate | 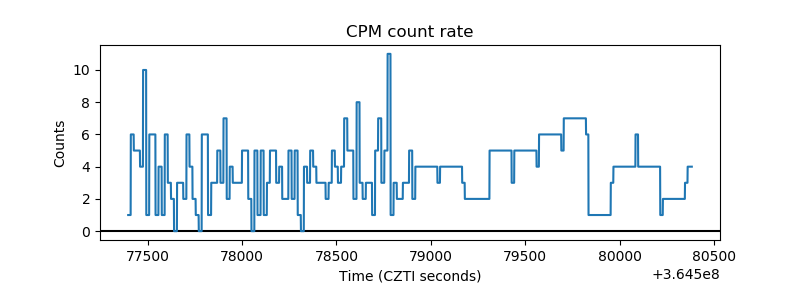 |
| CZT Counter | 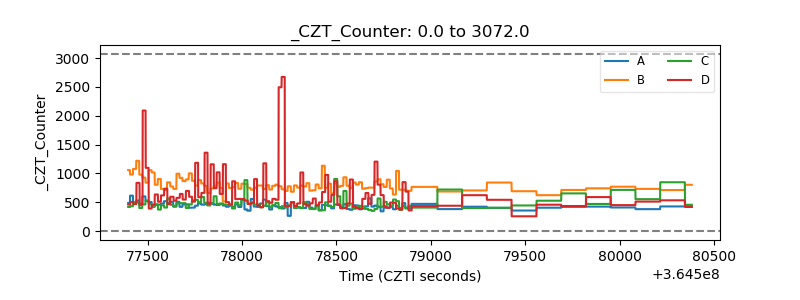 |
| +2.5 Volts monitor |  |
| +5 Volts monitor |  |
| _ROLL_ROT | 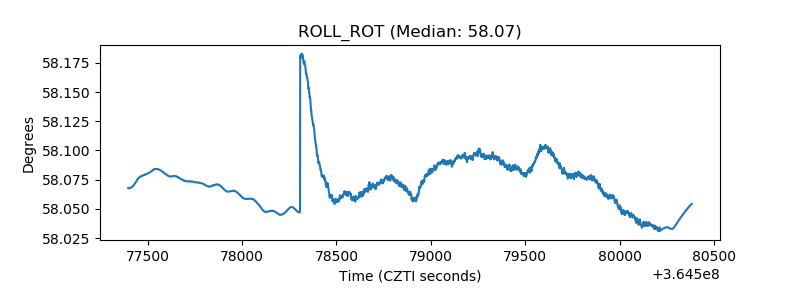 |
| _Roll_DEC | 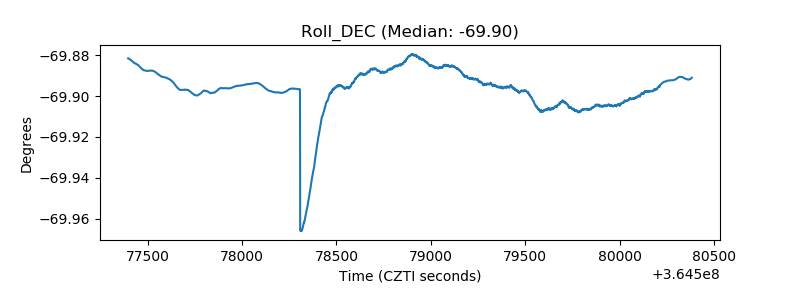 |
| _Roll_RA | 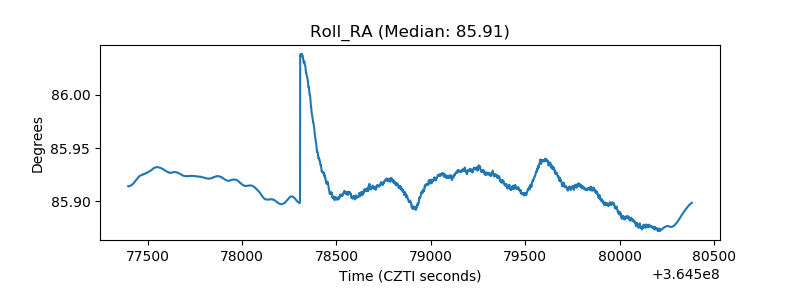 |
| Veto Counter | 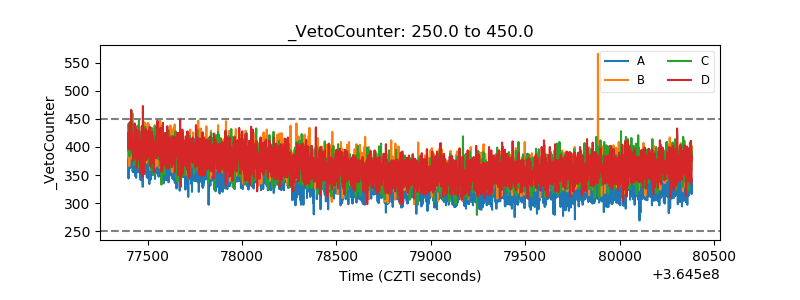 |