| Param | Original file | Final file |
|---|---|---|
| Filename | modeM0/AS1C06_005T01_9000004580_31434cztM0_level2.evt | modeM0/AS1C06_005T01_9000004580_31434cztM0_level2_quad_clean.evt |
| Size (bytes) | 130,553,280 | 28,440,000 |
| Size | 124.5 MB | 27.1 MB |
| Events in quadrant A | 687,937 | 196,095 |
| Events in quadrant B | 1,275,013 | 190,417 |
| Events in quadrant C | 752,237 | 188,769 |
| Events in quadrant D | 1,138,606 | 178,947 |
| Mode M0 | |||
|---|---|---|---|
| Quadrant | BADHDUFLAG | Total packets | Discarded packets |
| A | 0 | 2913 | 1 |
| B | 0 | 4768 | 1 |
| C | 0 | 3130 | 1 |
| D | 0 | 4336 | 1 |
| Mode SS | |||
|---|---|---|---|
| Quadrant | BADHDUFLAG | Total packets | Discarded packets |
| A | 0 | 30 | 0 |
| B | 0 | 30 | 0 |
| C | 0 | 30 | 0 |
| D | 0 | 30 | 0 |
| Quadrant | Total seconds | Saturated seconds | Saturation percentage |
|---|---|---|---|
| A | 1430 | 0 | 0.000000% |
| B | 1430 | 61 | 4.265734% |
| C | 1430 | 34 | 2.377622% |
| D | 1430 | 102 | 7.132867% |
Noise dominated data is calculated using 1-second bins in cleaned event files. If a bin has >2000 counts, and if more than 50% of those come from <1% of pixels, then it is considered to be noise-dominated and hence unusable.
| Quadrant | # 1 sec bins | Bins with >0 counts | Bins with >2000 counts | High rate bins dominated by noise | Noise dominated (total time) | Noise dominated (detector-on time) | Marked lightcurve |
|---|---|---|---|---|---|---|---|
| A | 1430 | 1430 | 0 | 0 | 0.00% | 0.00% | 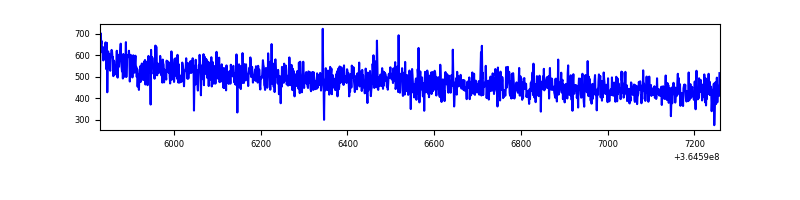 |
| B | 1430 | 1430 | 23 | 23 | 1.61% | 1.61% | 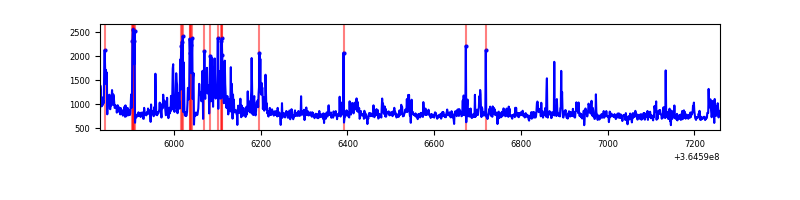 |
| C | 1430 | 1430 | 0 | 0 | 0.00% | 0.00% | 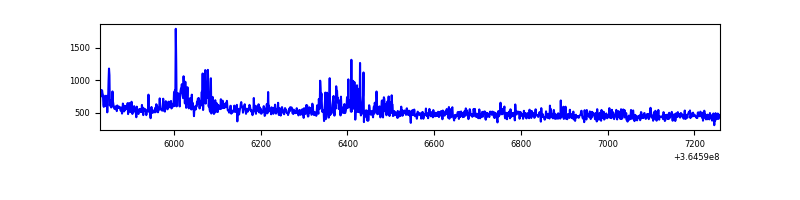 |
| D | 1430 | 1430 | 89 | 89 | 6.22% | 6.22% |  |
Top three noisy pixels from each quadrant. If the there are fewer than three noisy pixels in the level2.evt file, extra rows are filled as -1
| Pixel properties | Quadrant properties | ||||||
|---|---|---|---|---|---|---|---|
| Quadrant | DetID | PixID | Counts | Sigma | Mean | Median | Sigma |
| A | 13 | 254 | 2935 | 73.03 | 178 | 175 | 37.8 |
| A | 3 | 137 | 1928 | 46.38 | 178 | 175 | 37.8 |
| A | 0 | 226 | 1539 | 36.09 | 178 | 175 | 37.8 |
| B | 6 | 159 | 387583 | 10914.65 | 175 | 171 | 35.5 |
| B | 12 | 1 | 117610 | 3308.64 | 175 | 171 | 35.5 |
| B | 4 | 80 | 38086 | 1068.19 | 175 | 171 | 35.5 |
| C | 3 | 233 | 42213 | 1024.08 | 167 | 168 | 41.1 |
| C | 14 | 238 | 36721 | 890.31 | 167 | 168 | 41.1 |
| C | 14 | 254 | 13575 | 326.55 | 167 | 168 | 41.1 |
| D | 13 | 249 | 247039 | 5728.63 | 160 | 156 | 43.1 |
| D | 1 | 52 | 140590 | 3258.61 | 160 | 156 | 43.1 |
| D | 8 | 195 | 108479 | 2513.51 | 160 | 156 | 43.1 |
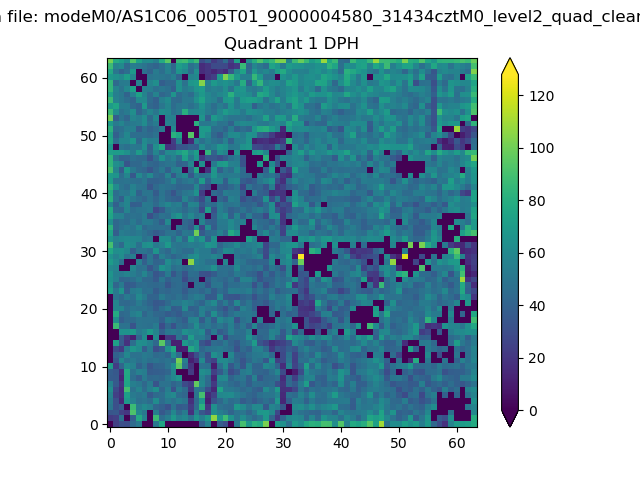
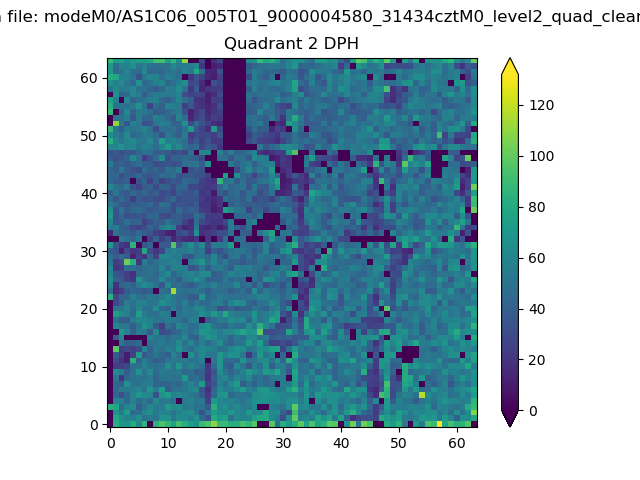
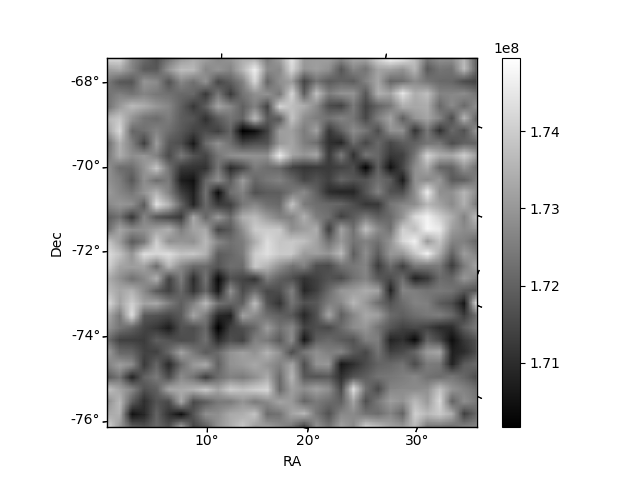
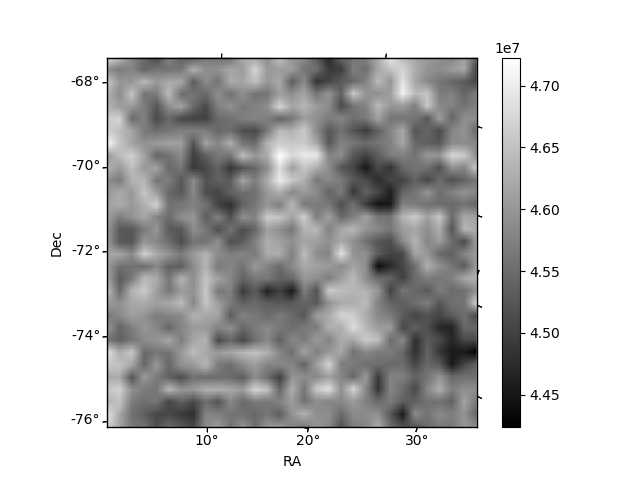
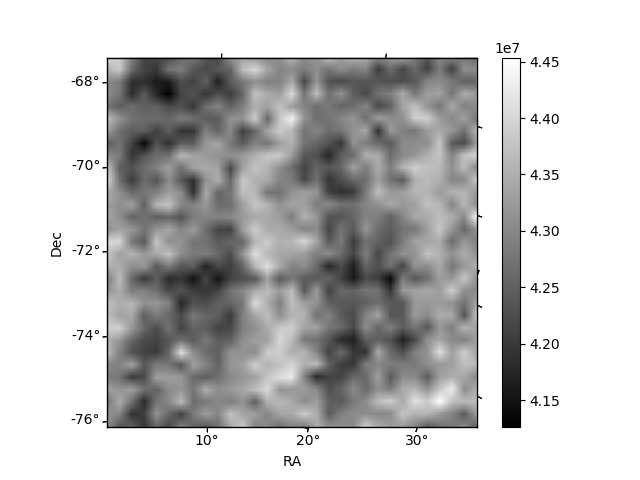
Histogram calculated using DETX and DETY for each event in the final _common_clean file
| Quadrant A | 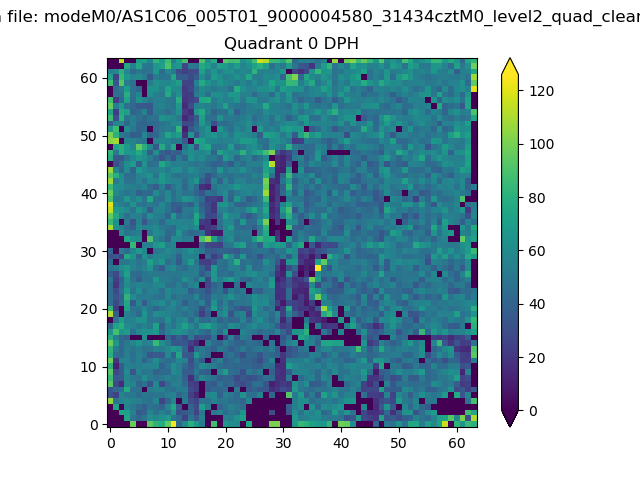 |
 |
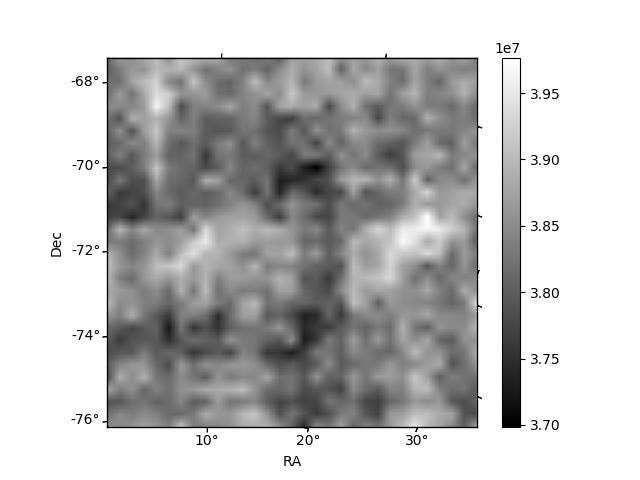
Quadrant B |
|---|---|---|---|
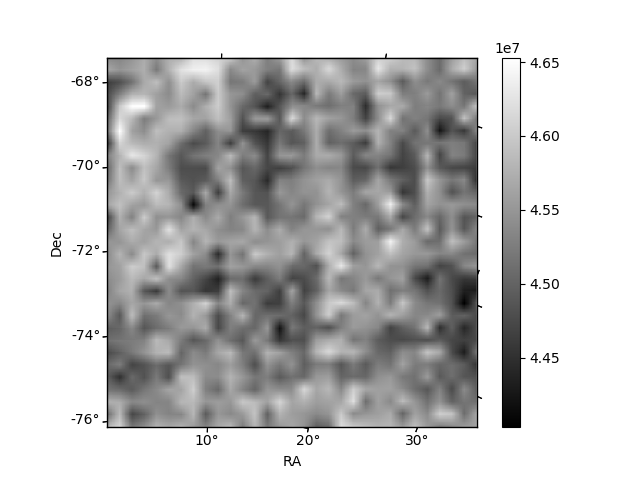
| Quadrant D | 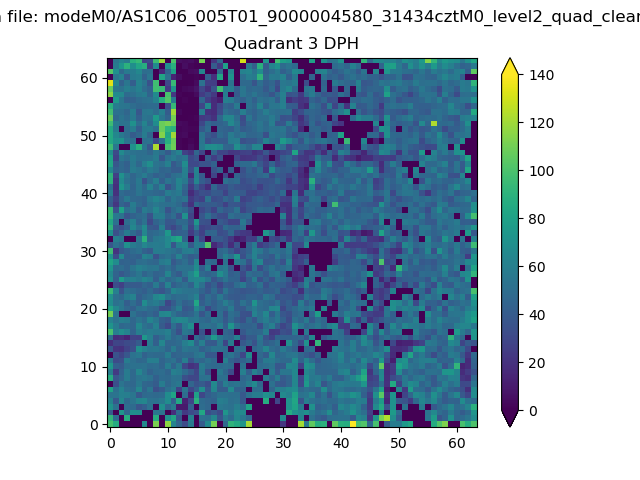 |
 |
Quadrant C |
| Plot type | Count rate plots | Images |
|---|---|---|
| Comparison with Poisson distribution Blue bars denote a histogram of data divided into 1 sec bins. Red curve is a Poisson curve with rate = median count rate of data. |
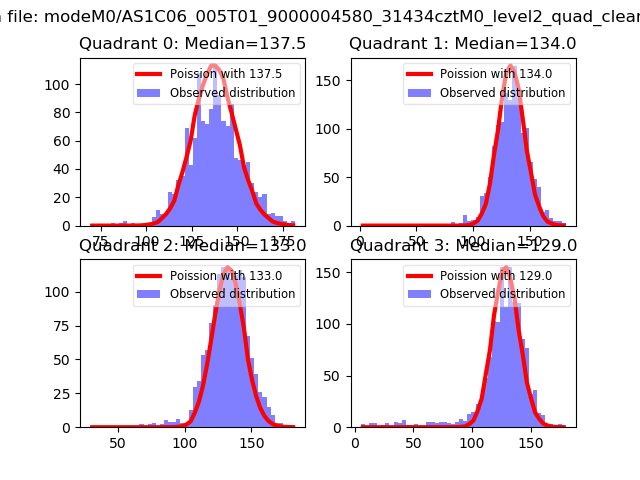 |
 |
| Quadrant-wise count rates Data is divided into 100 sec bins |
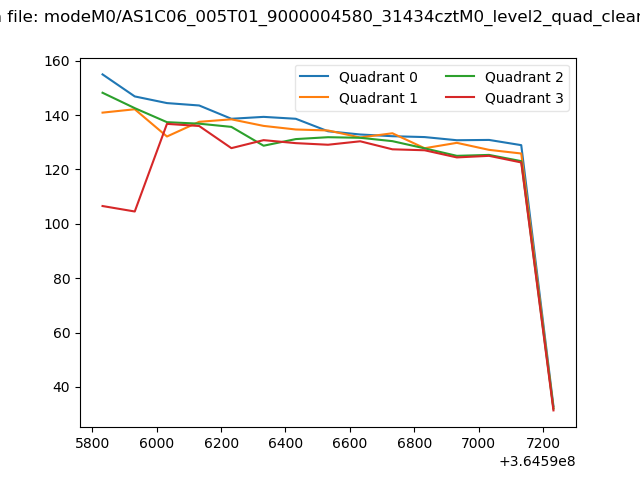 |
|
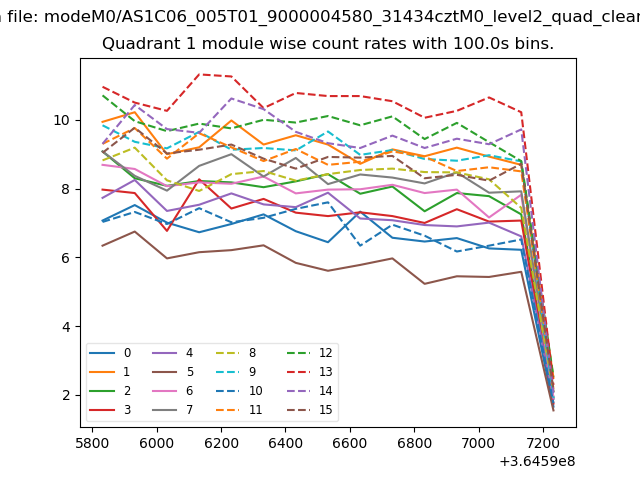
| Module-wise count rates for Quadrant A Data is divided into 100 sec bins |
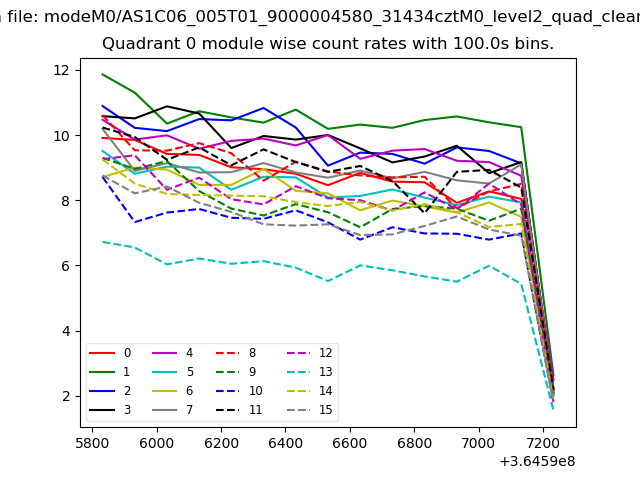 |
 |
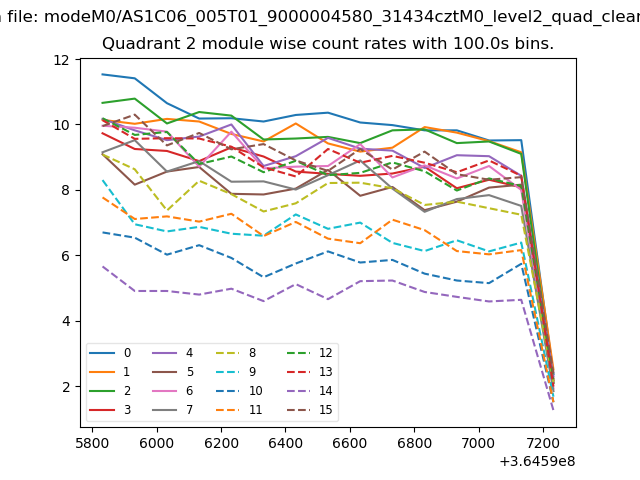
| Module-wise count rates for Quadrant B Data is divided into 100 sec bins |
 |
 |
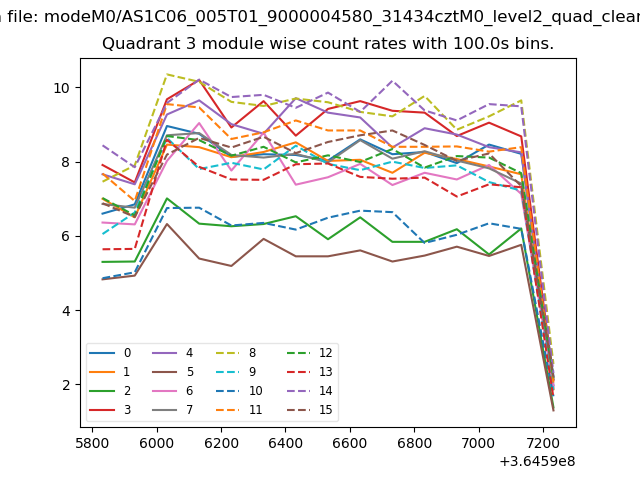
| Module-wise count rates for Quadrant C Data is divided into 100 sec bins |
 |
 |
| Module-wise count rates for Quadrant D Data is divided into 100 sec bins |
 |
 |
| Parameter | Plot |
|---|---|
| CZT HV Monitor | 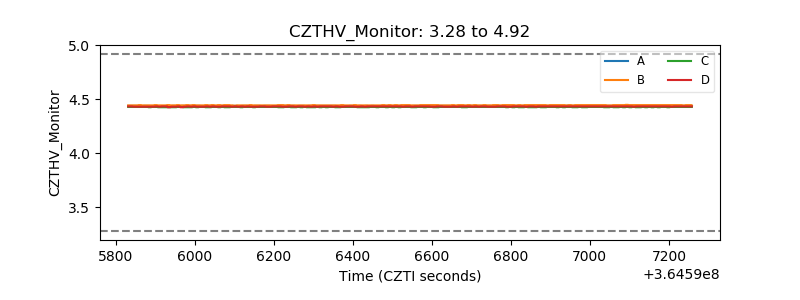 |
| D_VDD |  |
| Temperature 1 | 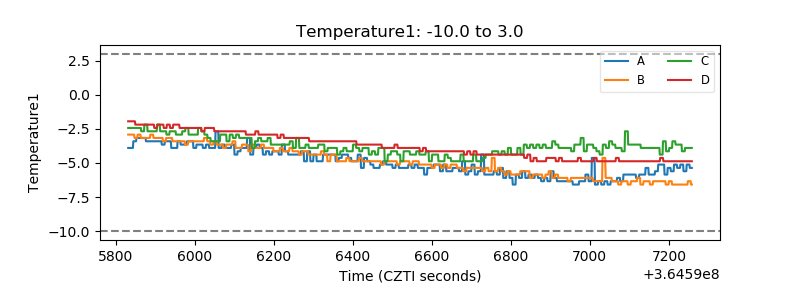 |
| Veto HV Monitor | 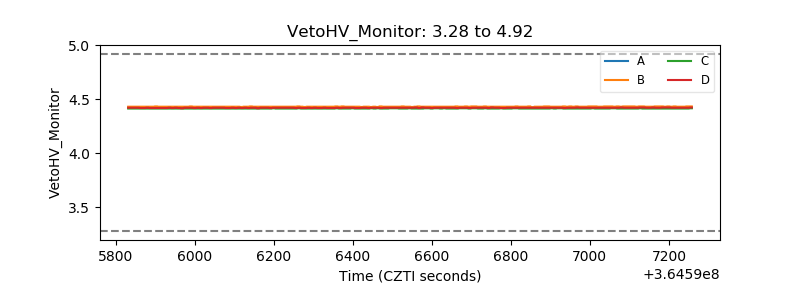 |
| Veto LLD | 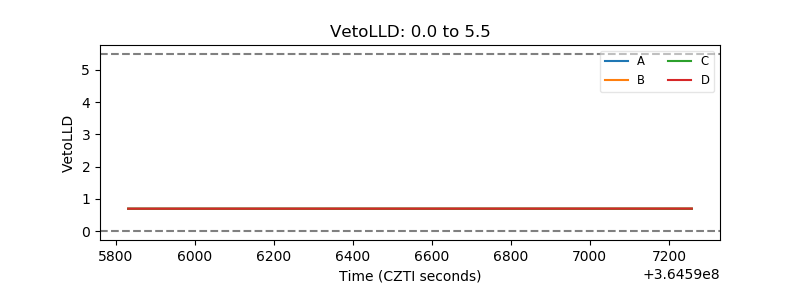 |
| Alpha Counter | 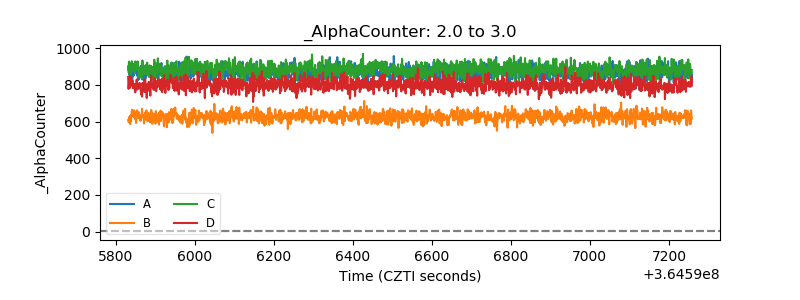 |
| _CPM_Rate | 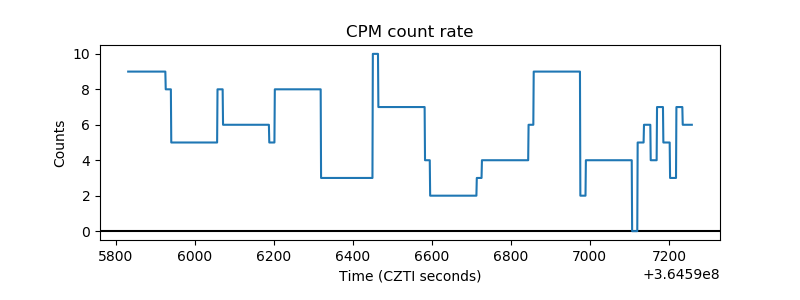 |
| CZT Counter | 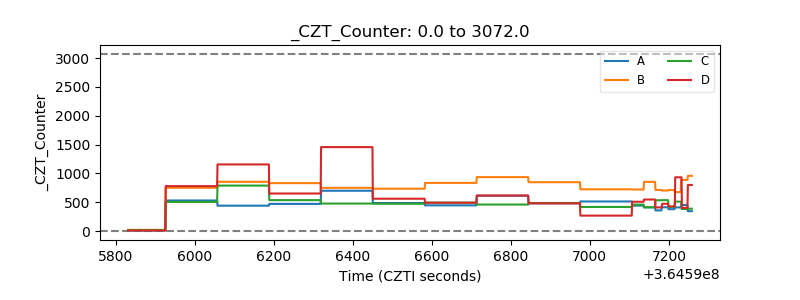 |
| +2.5 Volts monitor |  |
| +5 Volts monitor |  |
| _ROLL_ROT | 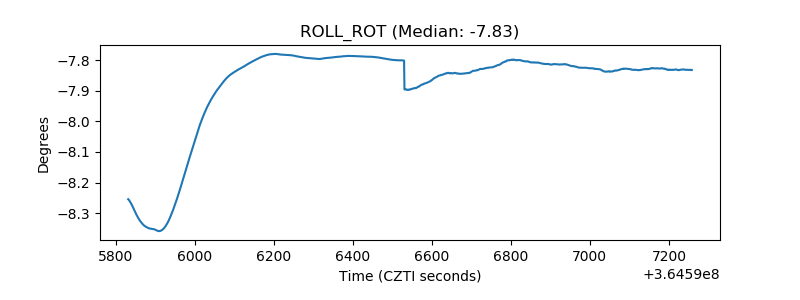 |
| _Roll_DEC | 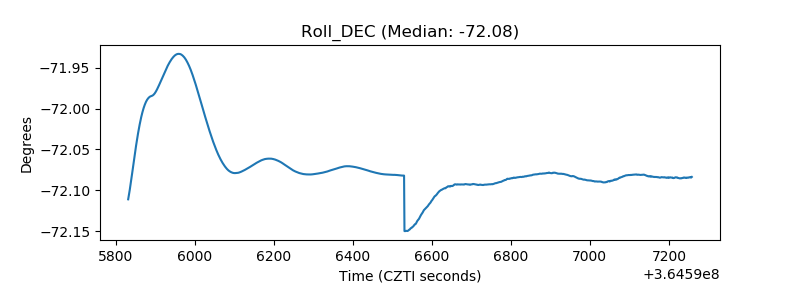 |
| _Roll_RA | 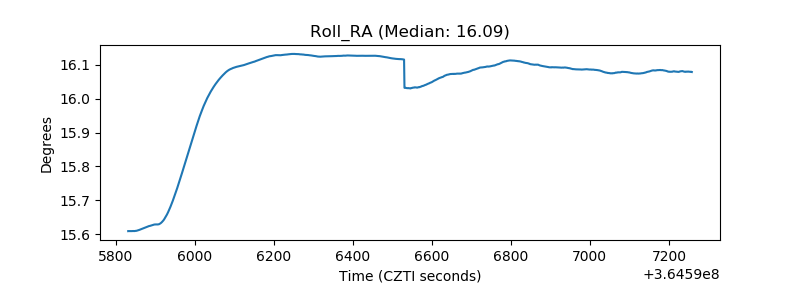 |
| Veto Counter | 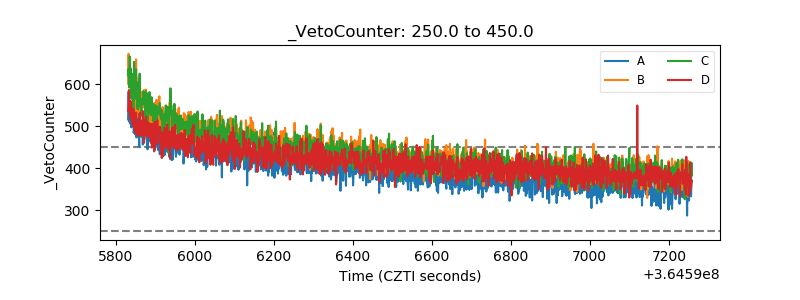 |