| Param | Original file | Final file |
|---|---|---|
| Filename | modeM0/AS1C06_005T01_9000004580_31435cztM0_level2.evt | modeM0/AS1C06_005T01_9000004580_31435cztM0_level2_quad_clean.evt |
| Size (bytes) | 658,293,120 | 122,621,760 |
| Size | 627.8 MB | 116.9 MB |
| Events in quadrant A | 3,054,924 | 877,968 |
| Events in quadrant B | 8,393,241 | 706,050 |
| Events in quadrant C | 3,356,273 | 846,168 |
| Events in quadrant D | 4,686,436 | 823,722 |
| Mode M0 | |||
|---|---|---|---|
| Quadrant | BADHDUFLAG | Total packets | Discarded packets |
| A | 0 | 13374 | 2 |
| B | 0 | 29574 | 2 |
| C | 0 | 14017 | 2 |
| D | 0 | 18471 | 2 |
| Mode M9 | |||
|---|---|---|---|
| Quadrant | BADHDUFLAG | Total packets | Discarded packets |
| A | 0 | 10 | 0 |
| B | 0 | 10 | 0 |
| C | 0 | 10 | 0 |
| D | 0 | 10 | 0 |
| Mode SS | |||
|---|---|---|---|
| Quadrant | BADHDUFLAG | Total packets | Discarded packets |
| A | 0 | 134 | 0 |
| B | 0 | 134 | 0 |
| C | 0 | 134 | 0 |
| D | 0 | 134 | 0 |
| Quadrant | Total seconds | Saturated seconds | Saturation percentage |
|---|---|---|---|
| A | 6581 | 5 | 0.075976% |
| B | 6581 | 1808 | 27.473028% |
| C | 6581 | 262 | 3.981158% |
| D | 6581 | 201 | 3.054247% |
Noise dominated data is calculated using 1-second bins in cleaned event files. If a bin has >2000 counts, and if more than 50% of those come from <1% of pixels, then it is considered to be noise-dominated and hence unusable.
| Quadrant | # 1 sec bins | Bins with >0 counts | Bins with >2000 counts | High rate bins dominated by noise | Noise dominated (total time) | Noise dominated (detector-on time) | Marked lightcurve |
|---|---|---|---|---|---|---|---|
| A | 7596 | 6582 | 0 | 0 | 0.00% | 0.00% | 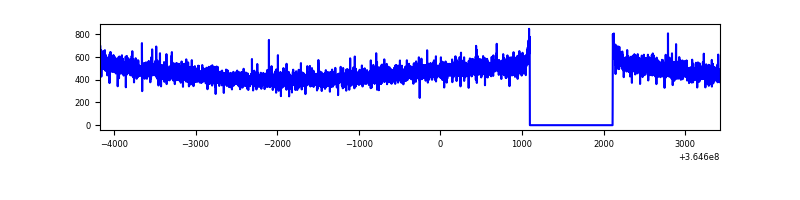 |
| B | 7595 | 6580 | 1516 | 1516 | 19.96% | 23.04% | 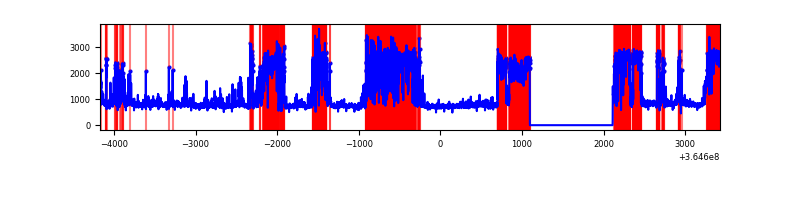 |
| C | 7596 | 6582 | 0 | 0 | 0.00% | 0.00% | 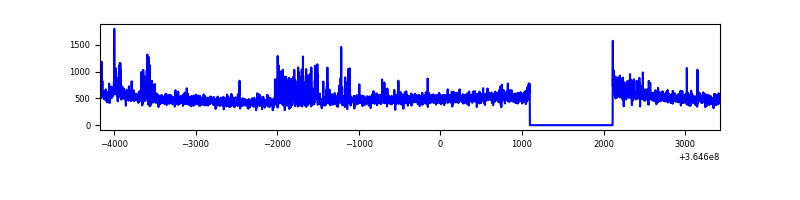 |
| D | 7596 | 6582 | 167 | 167 | 2.20% | 2.54% | 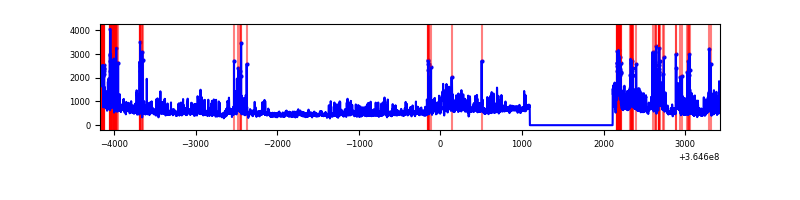 |
Top three noisy pixels from each quadrant. If the there are fewer than three noisy pixels in the level2.evt file, extra rows are filled as -1
| Pixel properties | Quadrant properties | ||||||
|---|---|---|---|---|---|---|---|
| Quadrant | DetID | PixID | Counts | Sigma | Mean | Median | Sigma |
| A | 13 | 254 | 12791 | 75.9 | 790 | 776 | 158.3 |
| A | 3 | 137 | 7997 | 45.61 | 790 | 776 | 158.3 |
| A | 0 | 226 | 6596 | 36.76 | 790 | 776 | 158.3 |
| B | 12 | 1 | 4101364 | 32868.65 | 651 | 633 | 124.8 |
| B | 6 | 159 | 1546320 | 12389.17 | 651 | 633 | 124.8 |
| B | 4 | 80 | 130718 | 1042.67 | 651 | 633 | 124.8 |
| C | 14 | 238 | 195994 | 1095.69 | 757 | 759 | 178.2 |
| C | 14 | 254 | 108601 | 605.23 | 757 | 759 | 178.2 |
| C | 3 | 233 | 82911 | 461.05 | 757 | 759 | 178.2 |
| D | 1 | 52 | 575466 | 3010.52 | 753 | 735 | 190.9 |
| D | 8 | 195 | 553932 | 2897.73 | 753 | 735 | 190.9 |
| D | 13 | 249 | 261304 | 1364.9 | 753 | 735 | 190.9 |
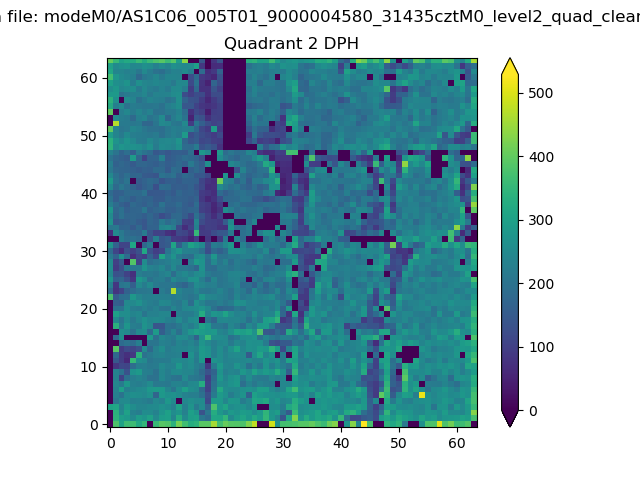
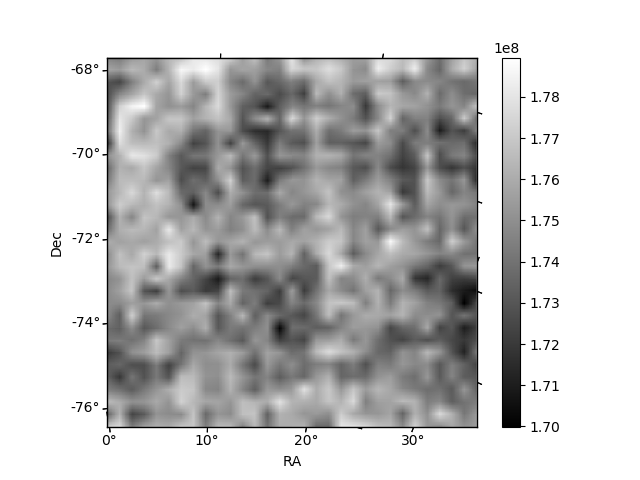
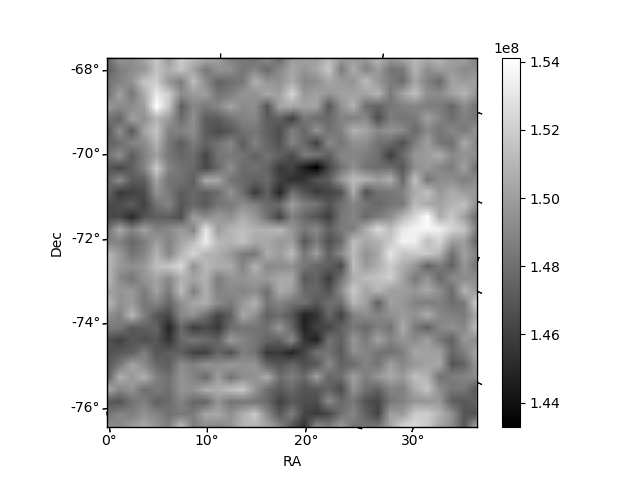
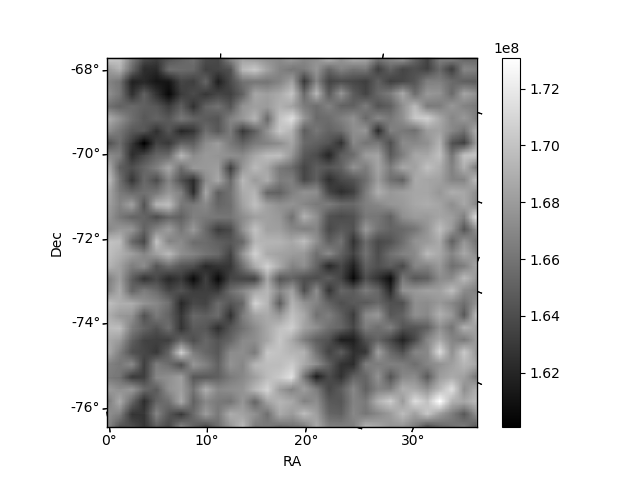
Histogram calculated using DETX and DETY for each event in the final _common_clean file
| Quadrant A | 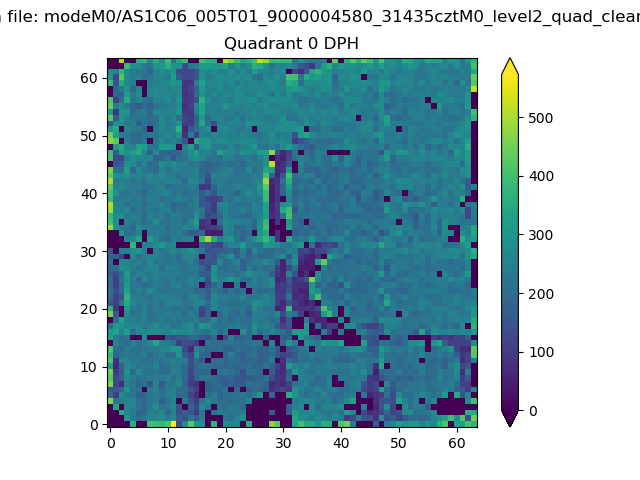 |
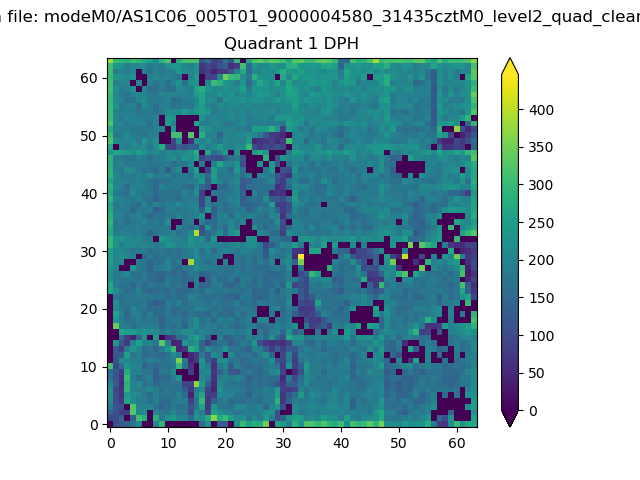 |
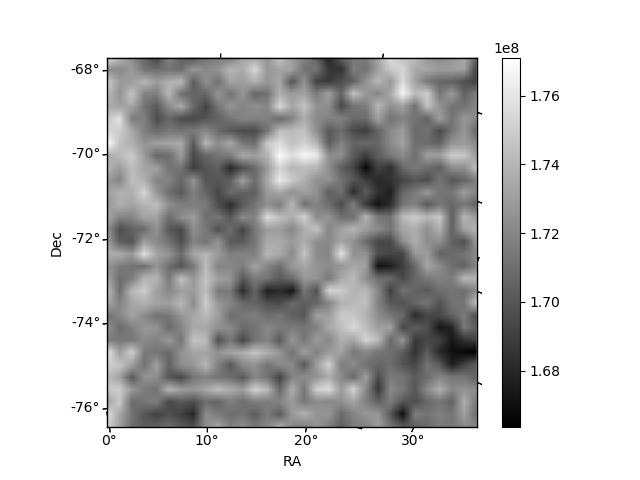
Quadrant B |
|---|---|---|---|
| Quadrant D | 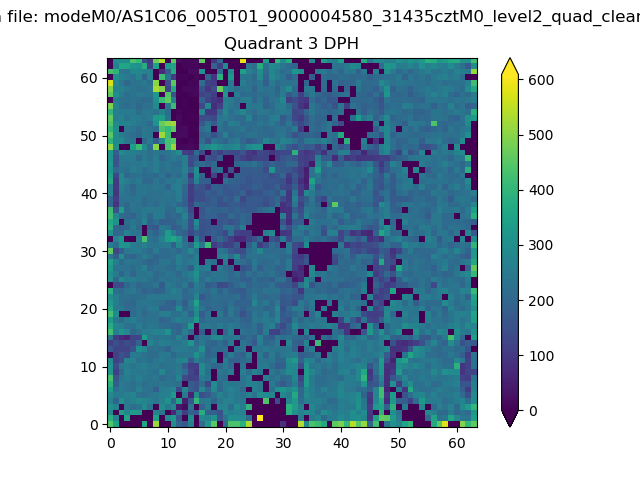 |
 |
Quadrant C |
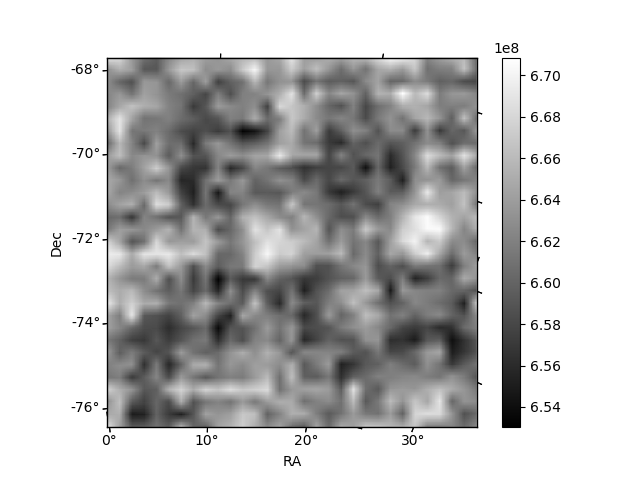
| Plot type | Count rate plots | Images |
|---|---|---|
| Comparison with Poisson distribution Blue bars denote a histogram of data divided into 1 sec bins. Red curve is a Poisson curve with rate = median count rate of data. |
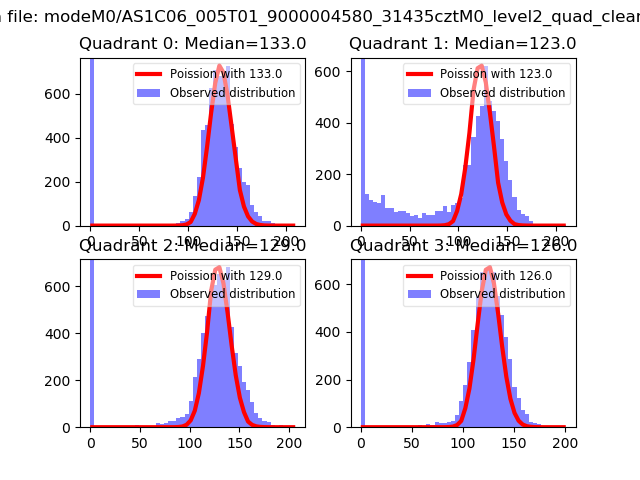 |
 |
| Quadrant-wise count rates Data is divided into 100 sec bins |
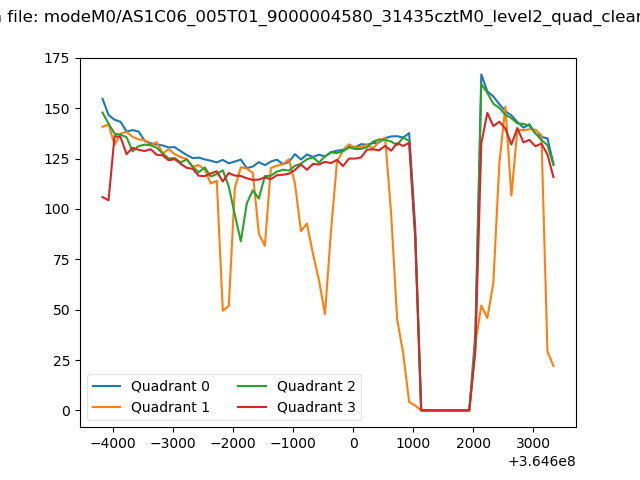 |
|
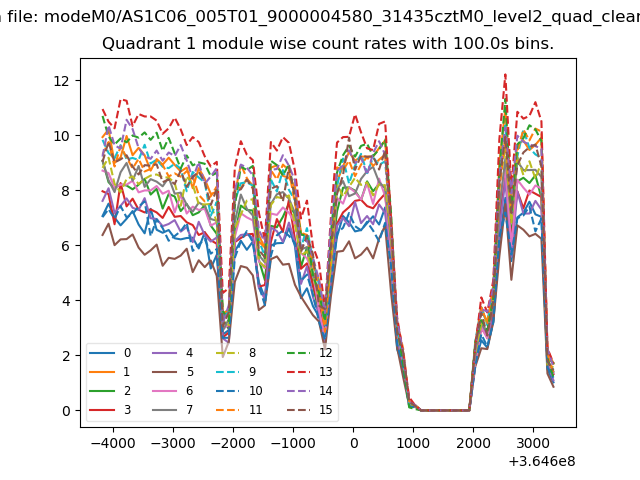
| Module-wise count rates for Quadrant A Data is divided into 100 sec bins |
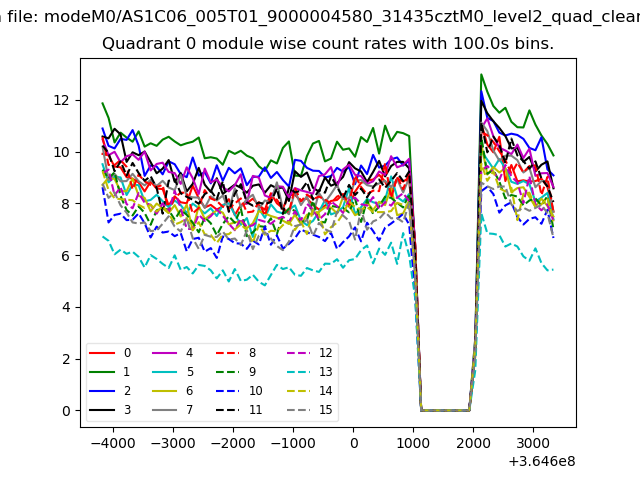 |
 |
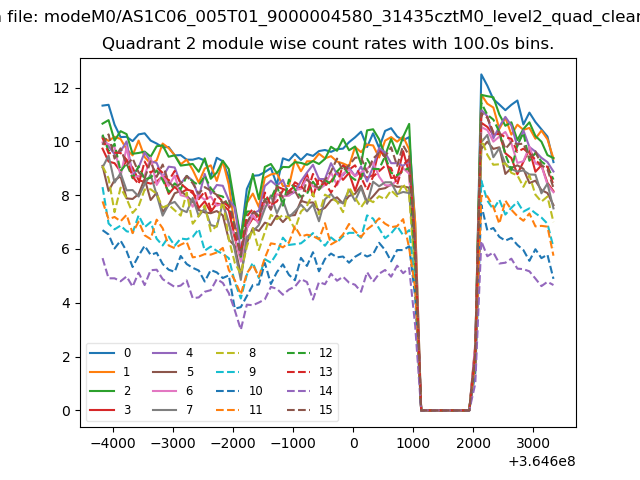
| Module-wise count rates for Quadrant B Data is divided into 100 sec bins |
 |
 |
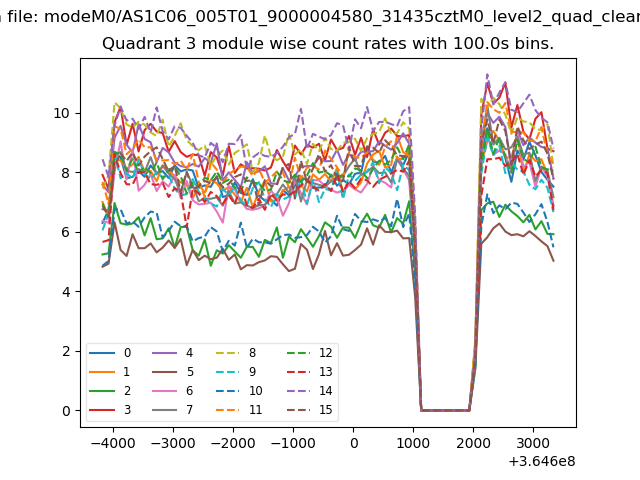
| Module-wise count rates for Quadrant C Data is divided into 100 sec bins |
 |
 |
| Module-wise count rates for Quadrant D Data is divided into 100 sec bins |
 |
 |
| Parameter | Plot |
|---|---|
| CZT HV Monitor | 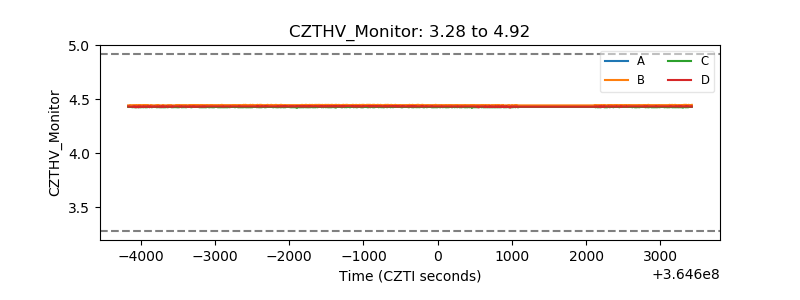 |
| D_VDD |  |
| Temperature 1 | 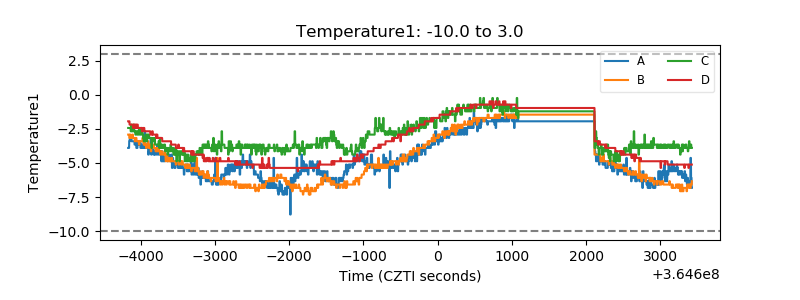 |
| Veto HV Monitor | 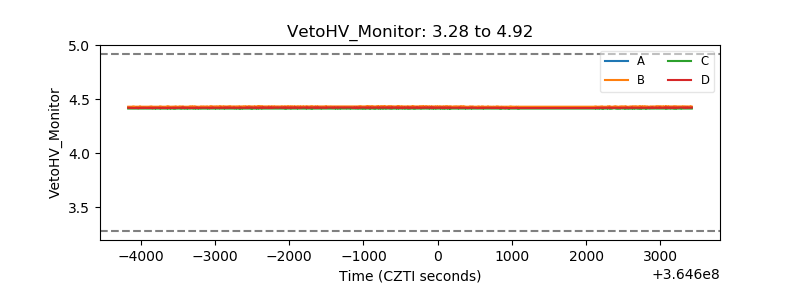 |
| Veto LLD | 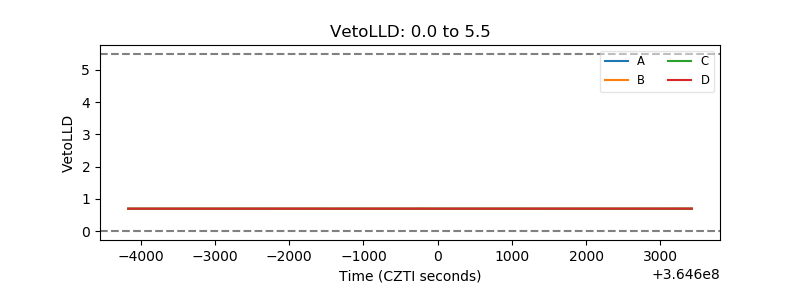 |
| Alpha Counter | 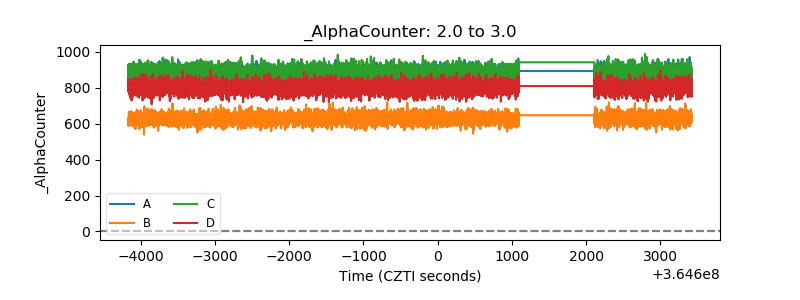 |
| _CPM_Rate | 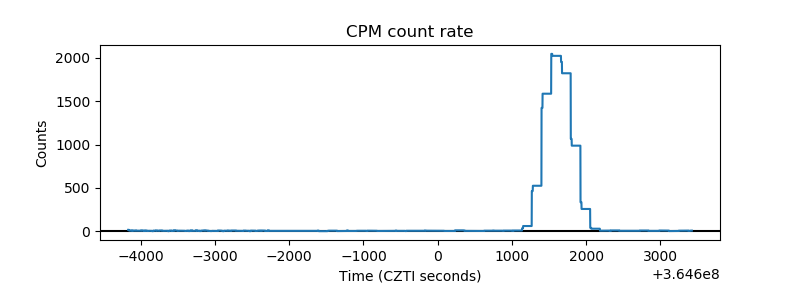 |
| CZT Counter | 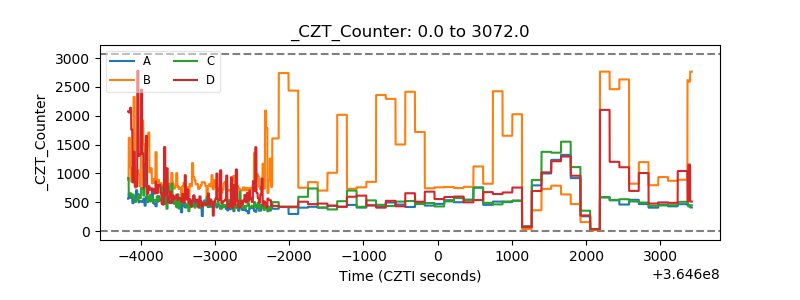 |
| +2.5 Volts monitor |  |
| +5 Volts monitor |  |
| _ROLL_ROT | 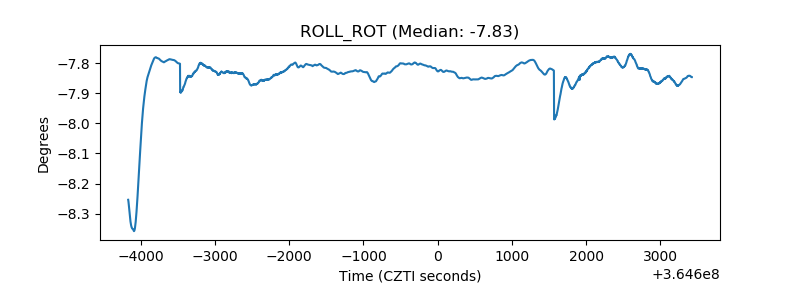 |
| _Roll_DEC | 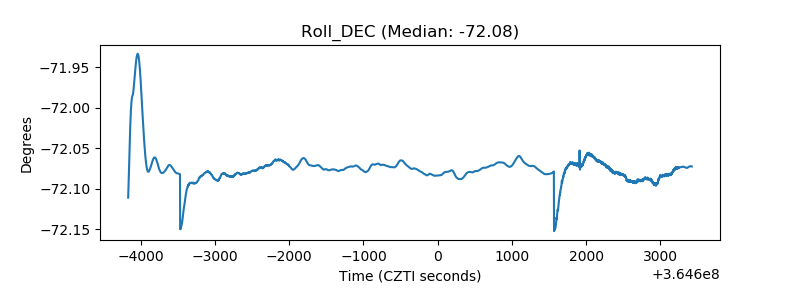 |
| _Roll_RA | 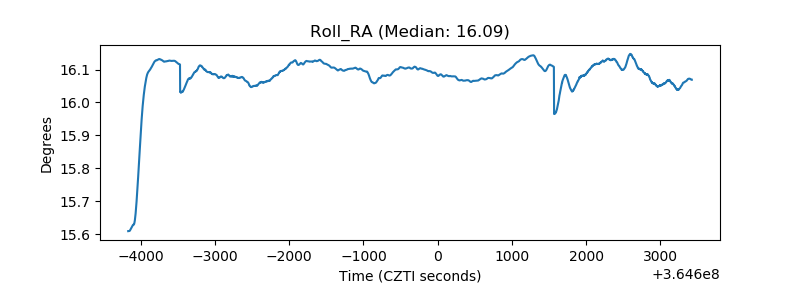 |
| Veto Counter | 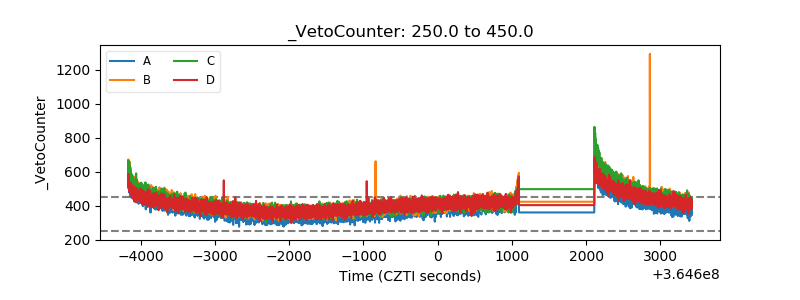 |