| Param | Original file | Final file |
|---|---|---|
| Filename | modeM0/AS1C06_005T01_9000004580_31437cztM0_level2.evt | modeM0/AS1C06_005T01_9000004580_31437cztM0_level2_quad_clean.evt |
| Size (bytes) | 19,362,240 | 5,391,360 |
| Size | 18.5 MB | 5.1 MB |
| Events in quadrant A | 113,302 | 35,509 |
| Events in quadrant B | 180,225 | 32,785 |
| Events in quadrant C | 134,992 | 36,590 |
| Events in quadrant D | 137,036 | 32,027 |
| Mode M0 | |||
|---|---|---|---|
| Quadrant | BADHDUFLAG | Total packets | Discarded packets |
| A | 0 | 1292 | 785 |
| B | 0 | 1960 | 1257 |
| C | 0 | 1329 | 781 |
| D | 0 | 1832 | 1267 |
| Mode M9 | |||
|---|---|---|---|
| Quadrant | BADHDUFLAG | Total packets | Discarded packets |
| A | 1 | 140014151387944 | 46 |
| B | 1 | -1 | -1 |
| C | 1 | -1 | -1 |
| D | 1 | -1 | -1 |
| Mode SS | |||
|---|---|---|---|
| Quadrant | BADHDUFLAG | Total packets | Discarded packets |
| A | 0 | 15 | 9 |
| B | 0 | 14 | 8 |
| C | 0 | 14 | 8 |
| D | 0 | 13 | 7 |
| Quadrant | Total seconds | Saturated seconds | Saturation percentage |
|---|---|---|---|
| A | 253 | 0 | 0.000000% |
| B | 231 | 0 | 0.000000% |
| C | 262 | 3 | 1.145038% |
| D | 240 | 0 | 0.000000% |
Noise dominated data is calculated using 1-second bins in cleaned event files. If a bin has >2000 counts, and if more than 50% of those come from <1% of pixels, then it is considered to be noise-dominated and hence unusable.
| Quadrant | # 1 sec bins | Bins with >0 counts | Bins with >2000 counts | High rate bins dominated by noise | Noise dominated (total time) | Noise dominated (detector-on time) | Marked lightcurve |
|---|---|---|---|---|---|---|---|
| A | 632 | 292 | 0 | 0 | 0.00% | 0.00% | 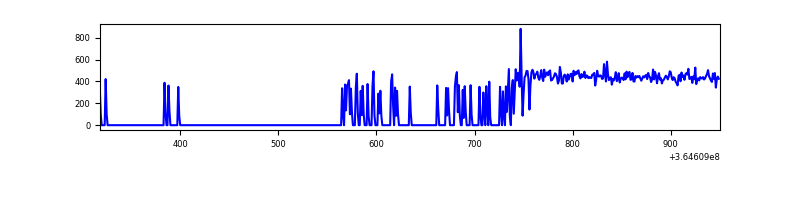 |
| B | 568 | 254 | 0 | 0 | 0.00% | 0.00% | 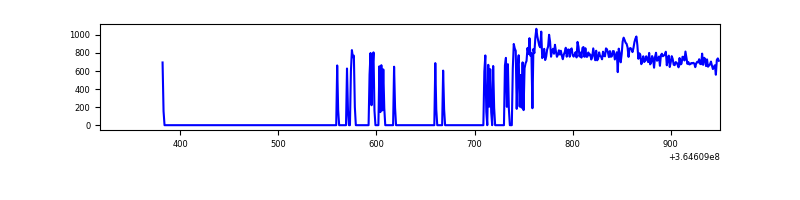 |
| C | 615 | 299 | 2 | 2 | 0.33% | 0.67% | 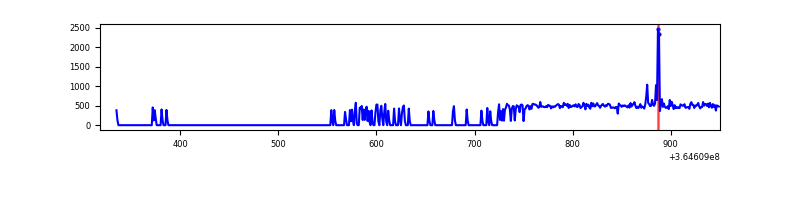 |
| D | 576 | 261 | 0 | 0 | 0.00% | 0.00% | 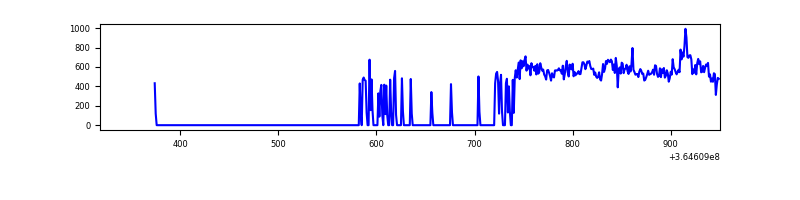 |
Top three noisy pixels from each quadrant. If the there are fewer than three noisy pixels in the level2.evt file, extra rows are filled as -1
| Pixel properties | Quadrant properties | ||||||
|---|---|---|---|---|---|---|---|
| Quadrant | DetID | PixID | Counts | Sigma | Mean | Median | Sigma |
| A | 13 | 254 | 434 | 50.86 | 29 | 28 | 8.0 |
| A | 3 | 137 | 278 | 31.32 | 29 | 28 | 8.0 |
| A | 0 | 226 | 242 | 26.81 | 29 | 28 | 8.0 |
| B | 6 | 159 | 68657 | 9407.33 | 27 | 26 | 7.3 |
| B | 4 | 80 | 5188 | 707.56 | 27 | 26 | 7.3 |
| B | 12 | 111 | 550 | 71.83 | 27 | 26 | 7.3 |
| C | 15 | 208 | 6409 | 692.51 | 30 | 30 | 9.2 |
| C | 14 | 238 | 5171 | 558.11 | 30 | 30 | 9.2 |
| C | 3 | 233 | 2609 | 279.98 | 30 | 30 | 9.2 |
| D | 1 | 52 | 18077 | 2105.21 | 27 | 26 | 8.6 |
| D | 8 | 195 | 13231 | 1540.04 | 27 | 26 | 8.6 |
| D | 2 | 250 | 1667 | 191.38 | 27 | 26 | 8.6 |
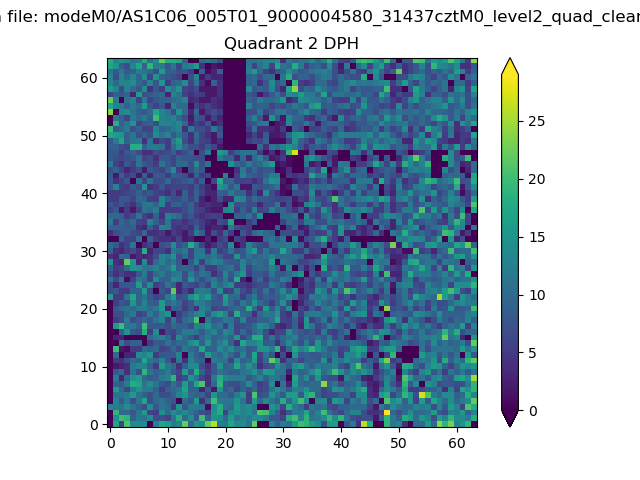
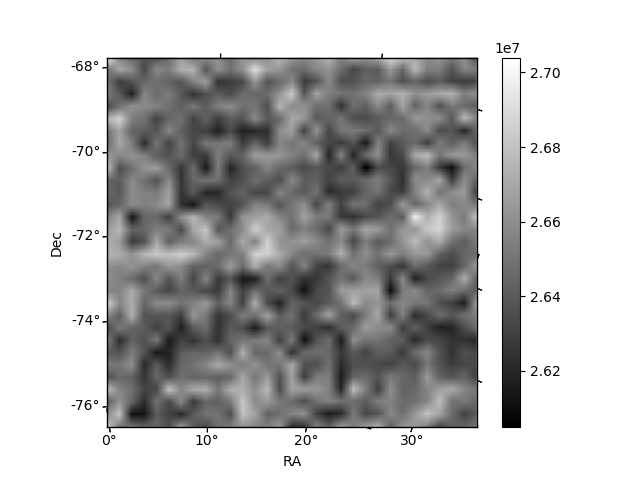
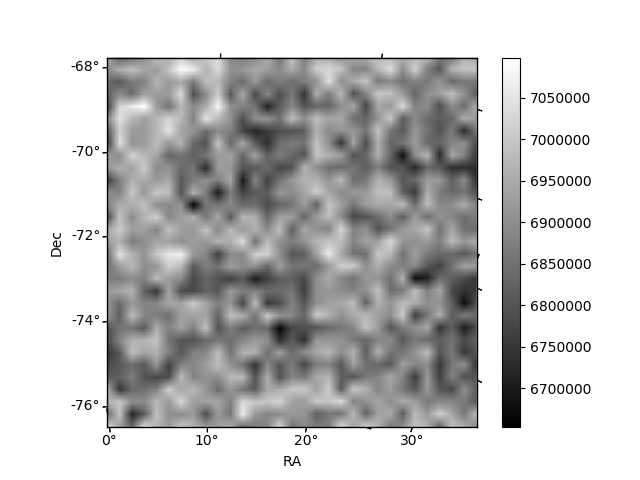
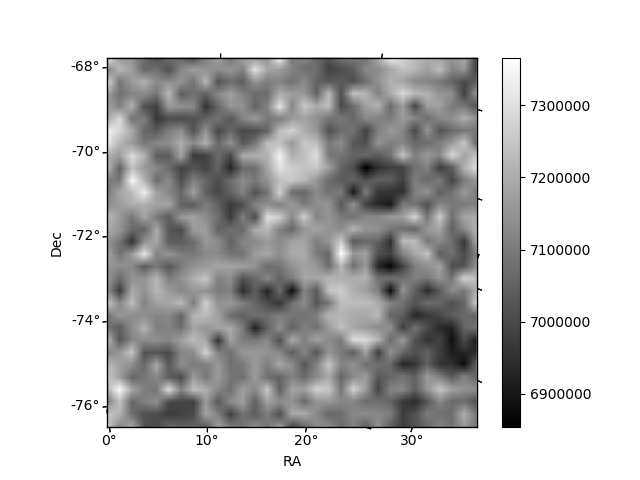
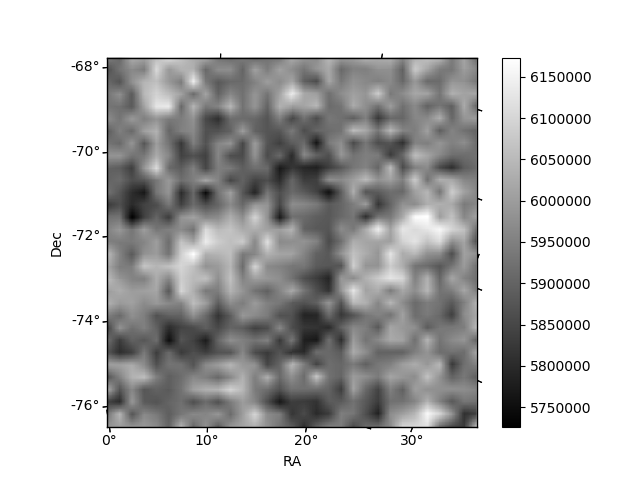
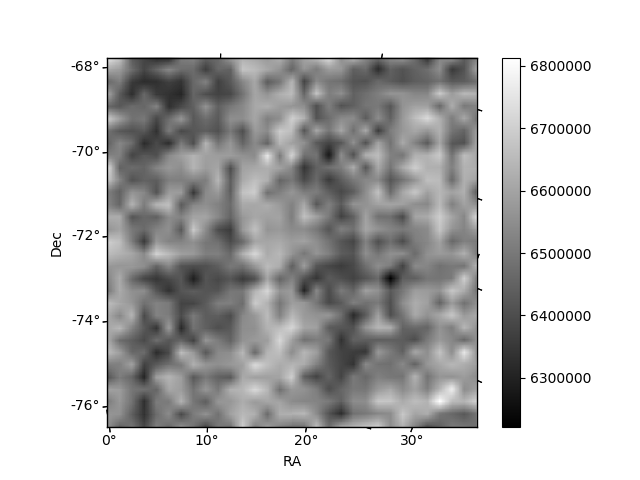
Histogram calculated using DETX and DETY for each event in the final _common_clean file
| Quadrant A | 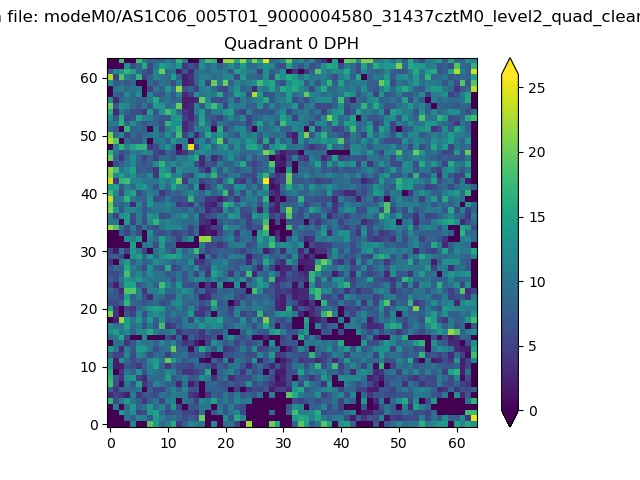 |
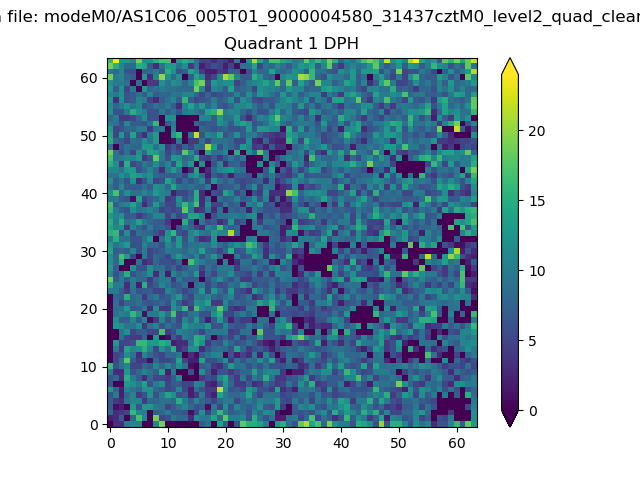 |
Quadrant B |
|---|---|---|---|
| Quadrant D | 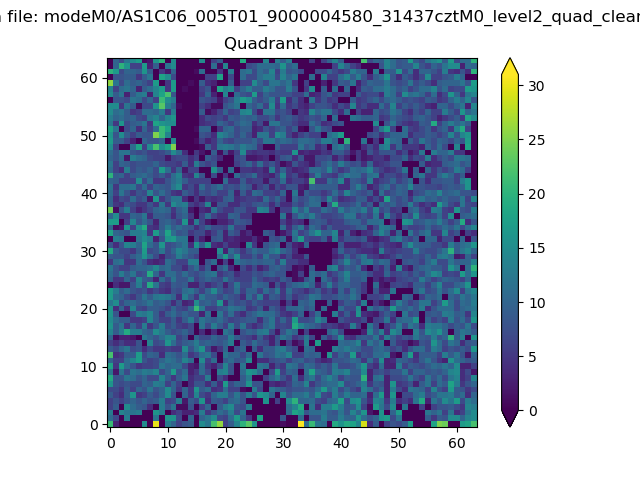 |
 |
Quadrant C |
| Plot type | Count rate plots | Images |
|---|---|---|
| Comparison with Poisson distribution Blue bars denote a histogram of data divided into 1 sec bins. Red curve is a Poisson curve with rate = median count rate of data. |
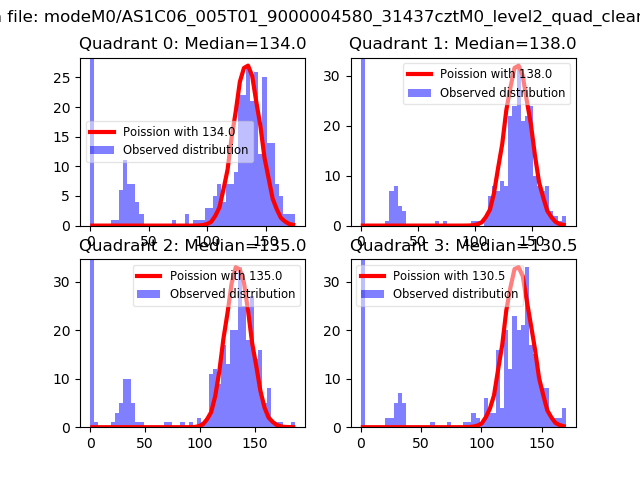 |
 |
| Quadrant-wise count rates Data is divided into 100 sec bins |
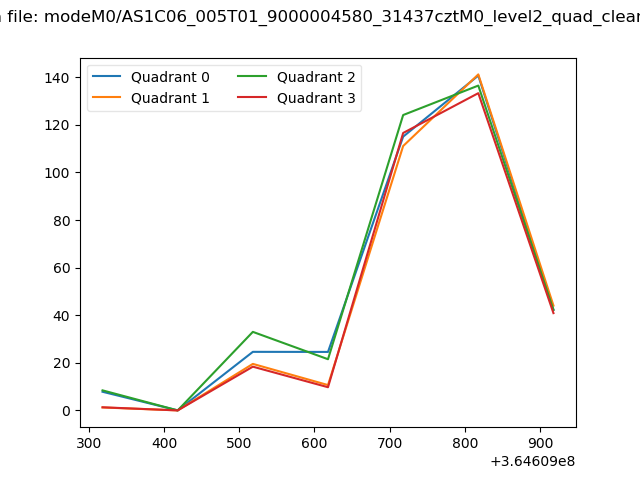 |
|
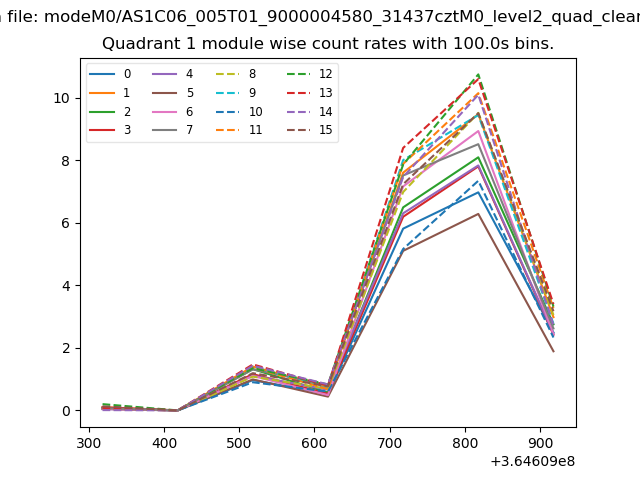
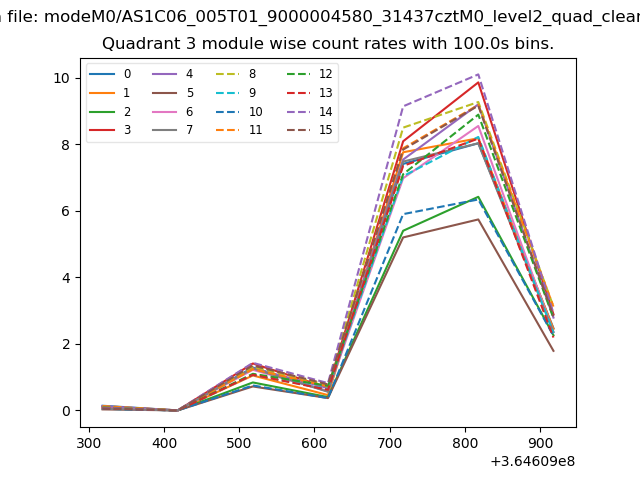
| Module-wise count rates for Quadrant A Data is divided into 100 sec bins |
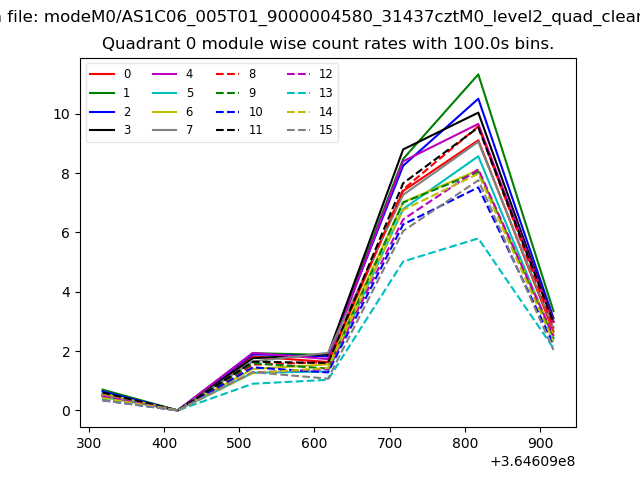 |
 |
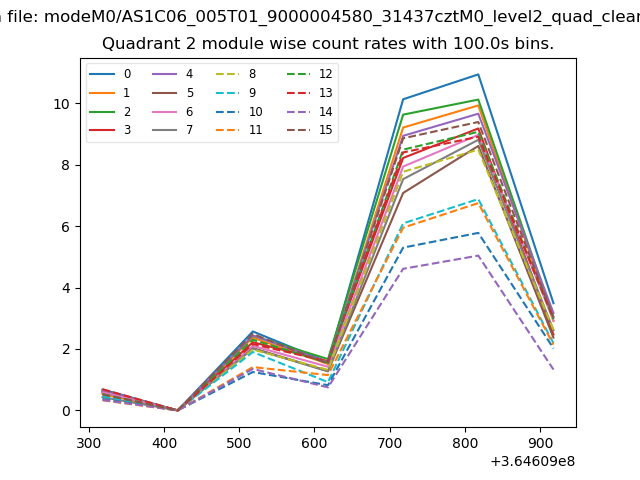
| Module-wise count rates for Quadrant B Data is divided into 100 sec bins |
 |
 |
| Module-wise count rates for Quadrant C Data is divided into 100 sec bins |
 |
 |
| Module-wise count rates for Quadrant D Data is divided into 100 sec bins |
 |
 |
| Parameter | Plot |
|---|---|
| CZT HV Monitor | 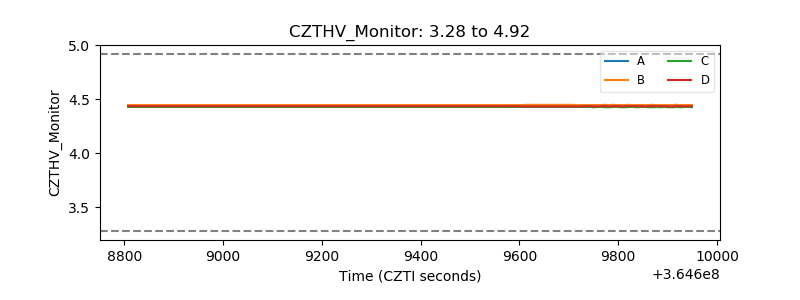 |
| D_VDD |  |
| Temperature 1 | 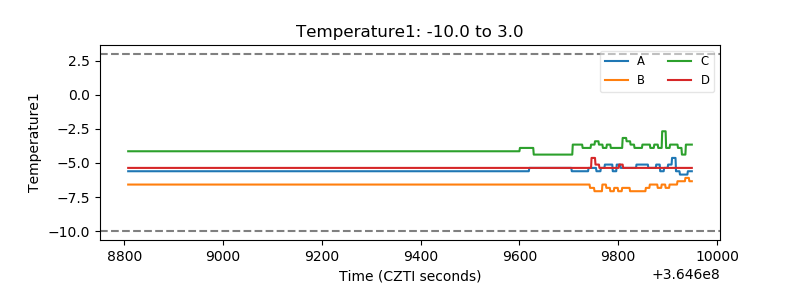 |
| Veto HV Monitor | 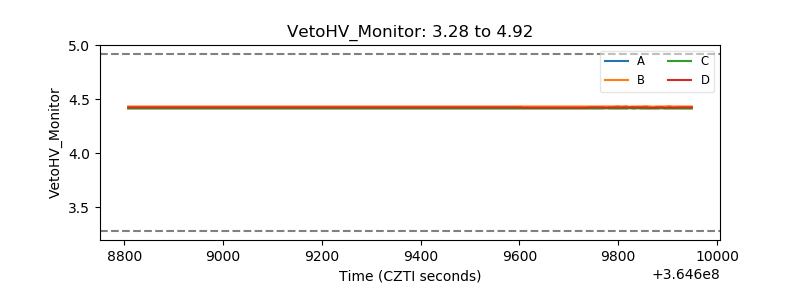 |
| Veto LLD | 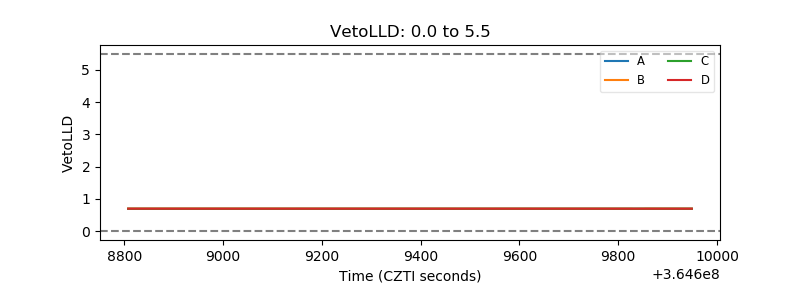 |
| Alpha Counter | 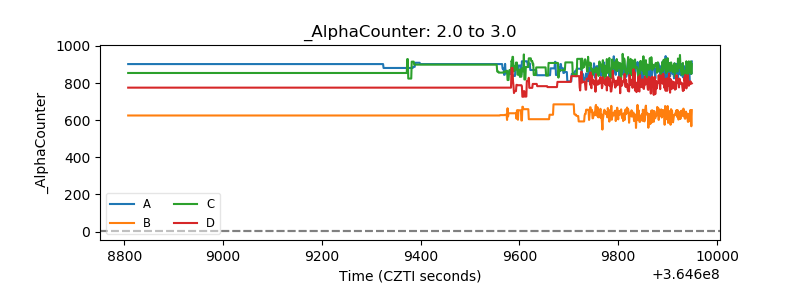 |
| _CPM_Rate | 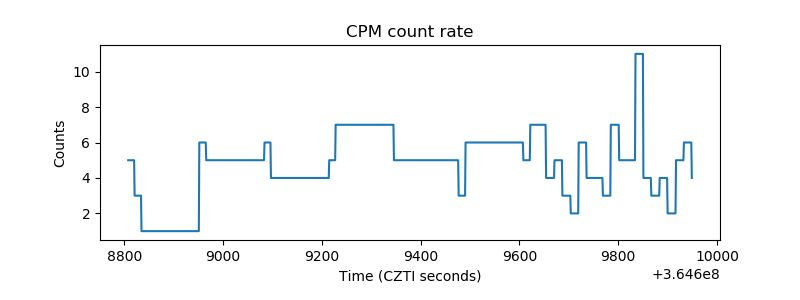 |
| CZT Counter | 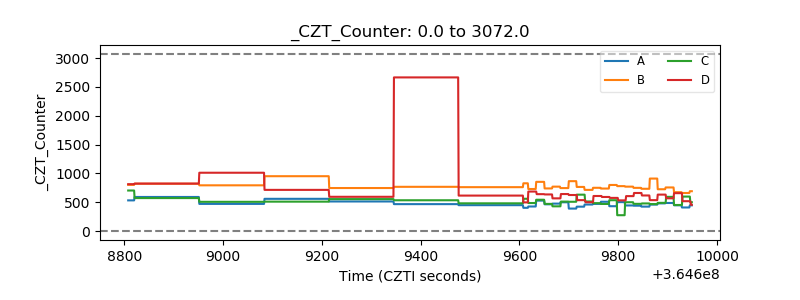 |
| +2.5 Volts monitor |  |
| +5 Volts monitor |  |
| _ROLL_ROT | 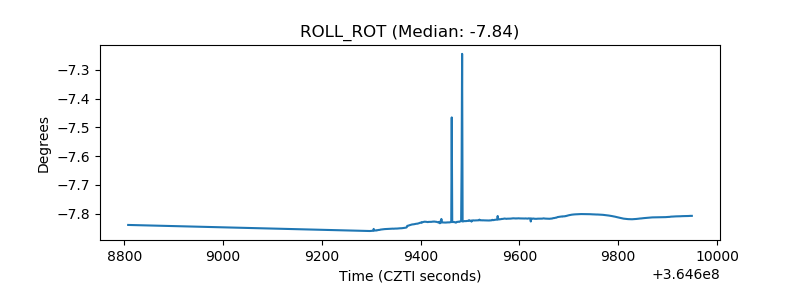 |
| _Roll_DEC | 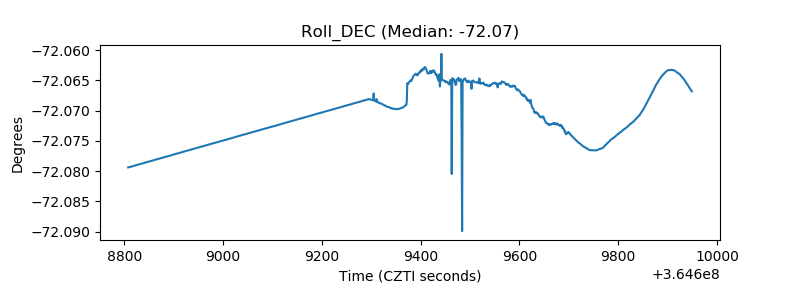 |
| _Roll_RA | 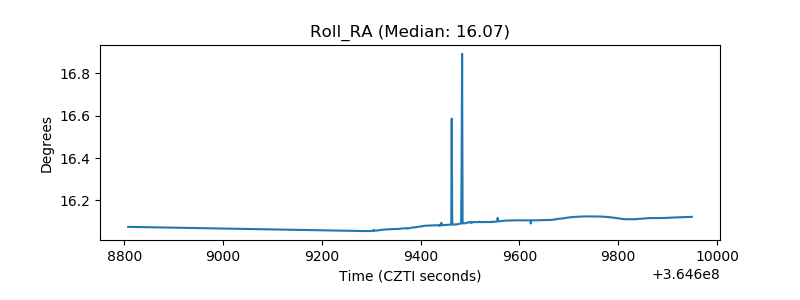 |
| Veto Counter | 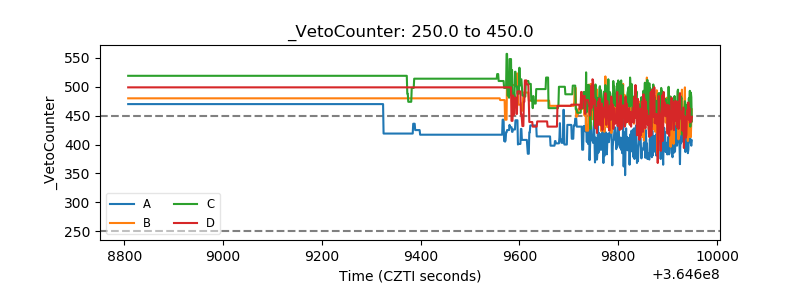 |