| Param | Original file | Final file |
|---|---|---|
| Filename | modeM0/AS1C06_005T01_9000004580_31438cztM0_level2.evt | modeM0/AS1C06_005T01_9000004580_31438cztM0_level2_quad_clean.evt |
| Size (bytes) | 566,968,320 | 100,281,600 |
| Size | 540.7 MB | 95.6 MB |
| Events in quadrant A | 2,489,007 | 749,034 |
| Events in quadrant B | 8,008,756 | 479,313 |
| Events in quadrant C | 2,899,635 | 740,272 |
| Events in quadrant D | 3,428,880 | 711,225 |
| Mode M0 | |||
|---|---|---|---|
| Quadrant | BADHDUFLAG | Total packets | Discarded packets |
| A | 0 | 11448 | 795 |
| B | 0 | 30213 | 2937 |
| C | 0 | 12711 | 1001 |
| D | 0 | 14911 | 1232 |
| Mode M9 | |||
|---|---|---|---|
| Quadrant | BADHDUFLAG | Total packets | Discarded packets |
| A | 0 | 14 | 1 |
| B | 0 | 13 | 0 |
| C | 0 | 13 | 0 |
| D | 0 | 13 | 0 |
| Mode SS | |||
|---|---|---|---|
| Quadrant | BADHDUFLAG | Total packets | Discarded packets |
| A | 0 | 112 | 8 |
| B | 0 | 113 | 7 |
| C | 0 | 113 | 9 |
| D | 0 | 114 | 12 |
| Quadrant | Total seconds | Saturated seconds | Saturation percentage |
|---|---|---|---|
| A | 5138 | 7 | 0.136240% |
| B | 4973 | 2241 | 45.063342% |
| C | 5116 | 136 | 2.658327% |
| D | 5084 | 87 | 1.711251% |
Noise dominated data is calculated using 1-second bins in cleaned event files. If a bin has >2000 counts, and if more than 50% of those come from <1% of pixels, then it is considered to be noise-dominated and hence unusable.
| Quadrant | # 1 sec bins | Bins with >0 counts | Bins with >2000 counts | High rate bins dominated by noise | Noise dominated (total time) | Noise dominated (detector-on time) | Marked lightcurve |
|---|---|---|---|---|---|---|---|
| A | 7132 | 5255 | 0 | 0 | 0.00% | 0.00% | 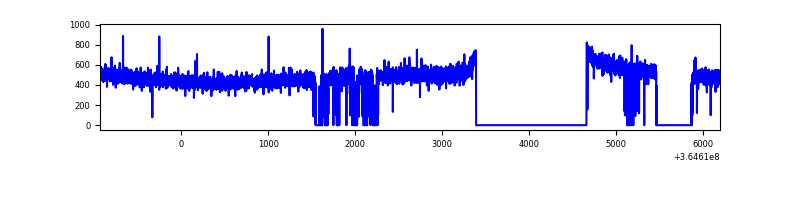 |
| B | 7131 | 5068 | 2083 | 2083 | 29.21% | 41.10% | 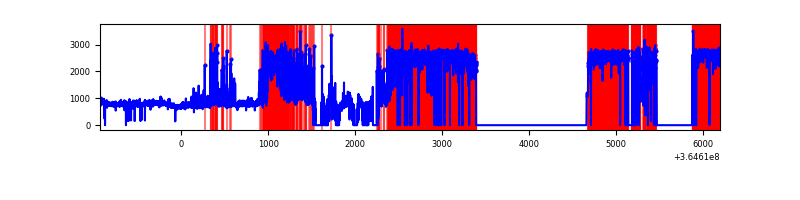 |
| C | 7131 | 5219 | 2 | 2 | 0.03% | 0.04% | 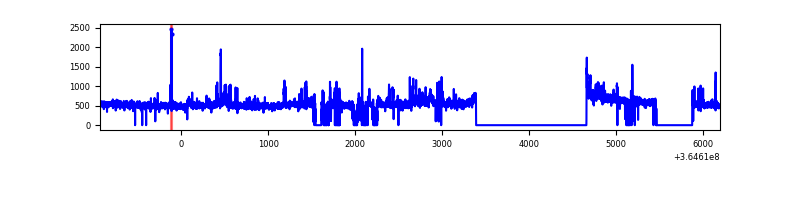 |
| D | 7131 | 5205 | 66 | 66 | 0.93% | 1.27% | 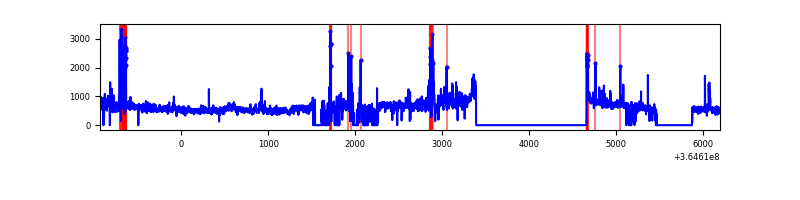 |
Top three noisy pixels from each quadrant. If the there are fewer than three noisy pixels in the level2.evt file, extra rows are filled as -1
| Pixel properties | Quadrant properties | ||||||
|---|---|---|---|---|---|---|---|
| Quadrant | DetID | PixID | Counts | Sigma | Mean | Median | Sigma |
| A | 13 | 254 | 9904 | 72.13 | 644 | 632 | 128.6 |
| A | 3 | 137 | 6206 | 43.36 | 644 | 632 | 128.6 |
| A | 0 | 226 | 5242 | 35.86 | 644 | 632 | 128.6 |
| B | 12 | 1 | 5217777 | 64589.58 | 431 | 420 | 80.8 |
| B | 6 | 159 | 1029722 | 12742.5 | 431 | 420 | 80.8 |
| B | 4 | 80 | 54436 | 668.7 | 431 | 420 | 80.8 |
| C | 3 | 233 | 217901 | 1476.05 | 635 | 642 | 147.2 |
| C | 14 | 238 | 132034 | 892.67 | 635 | 642 | 147.2 |
| C | 14 | 254 | 40351 | 269.78 | 635 | 642 | 147.2 |
| D | 8 | 195 | 466160 | 3112.63 | 626 | 611 | 149.6 |
| D | 1 | 52 | 270477 | 1804.31 | 626 | 611 | 149.6 |
| D | 5 | 233 | 109531 | 728.23 | 626 | 611 | 149.6 |
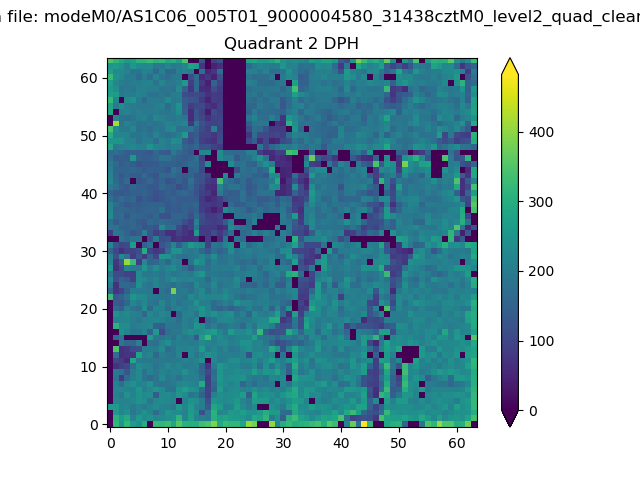
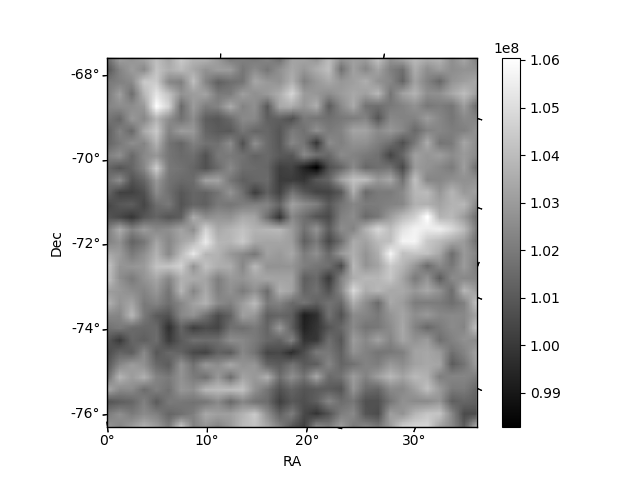
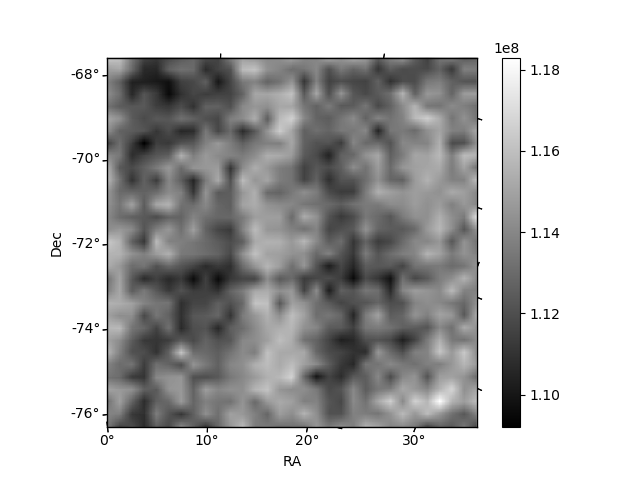
Histogram calculated using DETX and DETY for each event in the final _common_clean file
| Quadrant A | 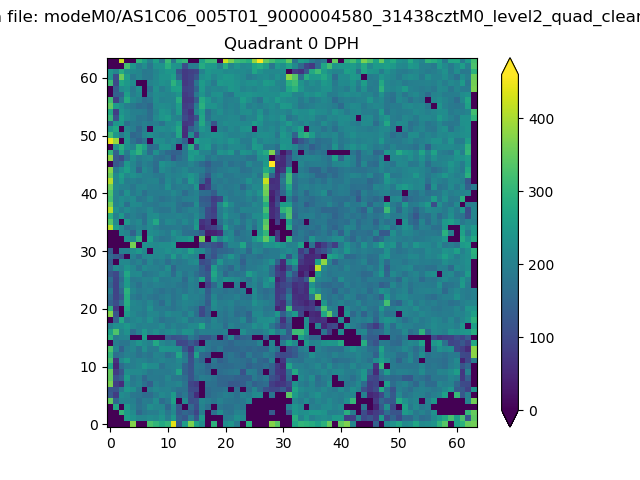 |
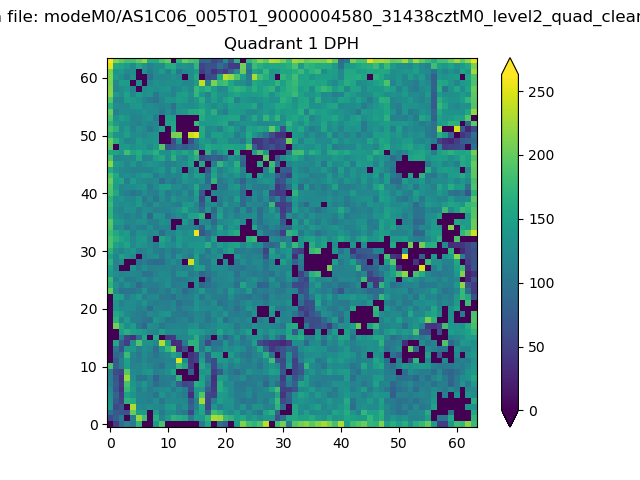 |
Quadrant B |
|---|---|---|---|
| Quadrant D | 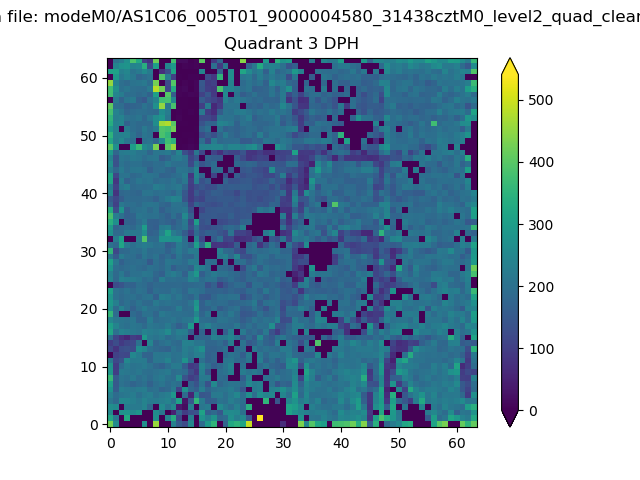 |
 |
Quadrant C |
| Plot type | Count rate plots | Images |
|---|---|---|
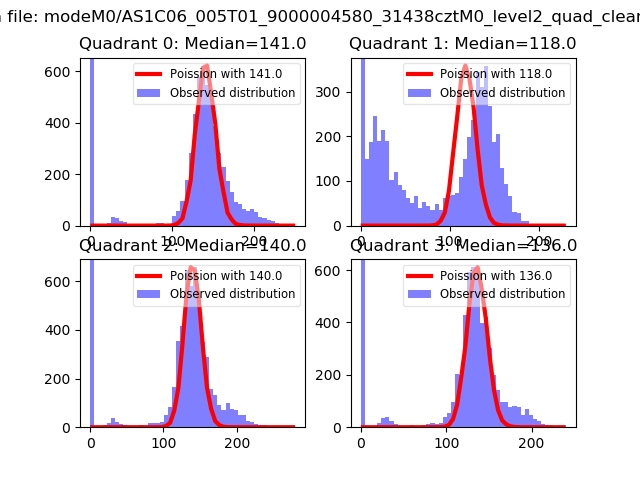
| Comparison with Poisson distribution Blue bars denote a histogram of data divided into 1 sec bins. Red curve is a Poisson curve with rate = median count rate of data. |
 |
 |
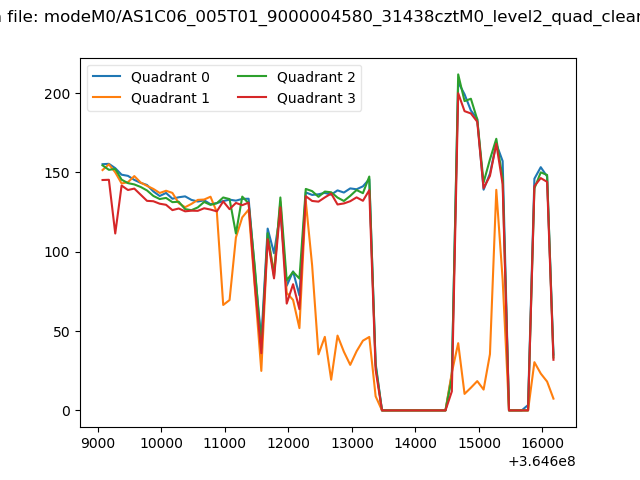
| Quadrant-wise count rates Data is divided into 100 sec bins |
 |
|
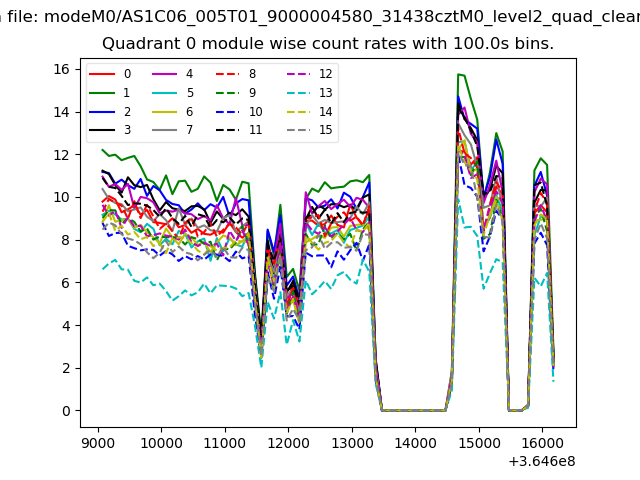
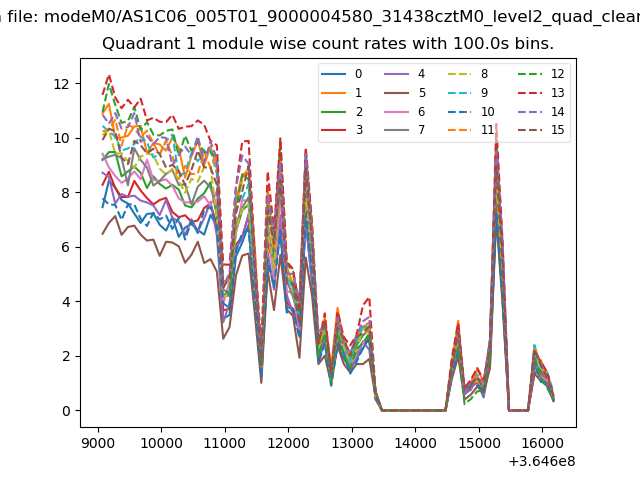
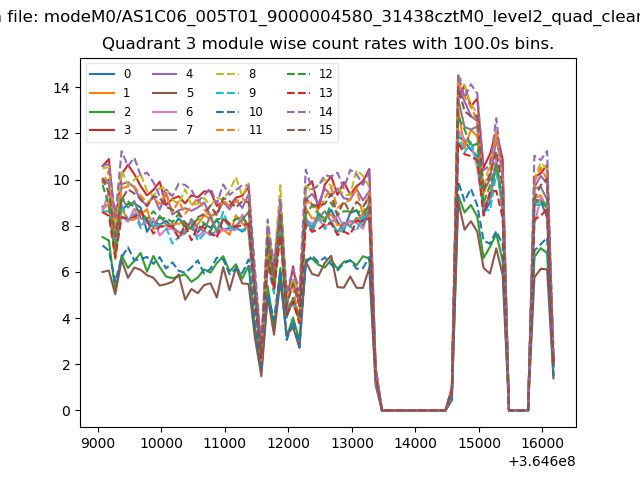
| Module-wise count rates for Quadrant A Data is divided into 100 sec bins |
 |
 |
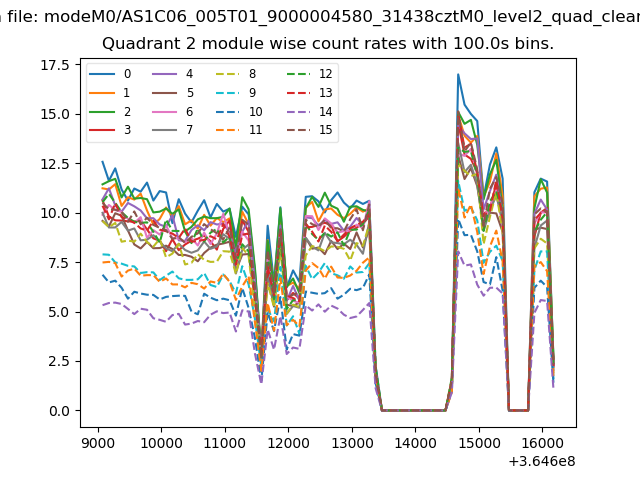
| Module-wise count rates for Quadrant B Data is divided into 100 sec bins |
 |
 |
| Module-wise count rates for Quadrant C Data is divided into 100 sec bins |
 |
 |
| Module-wise count rates for Quadrant D Data is divided into 100 sec bins |
 |
 |
| Parameter | Plot |
|---|---|
| CZT HV Monitor | 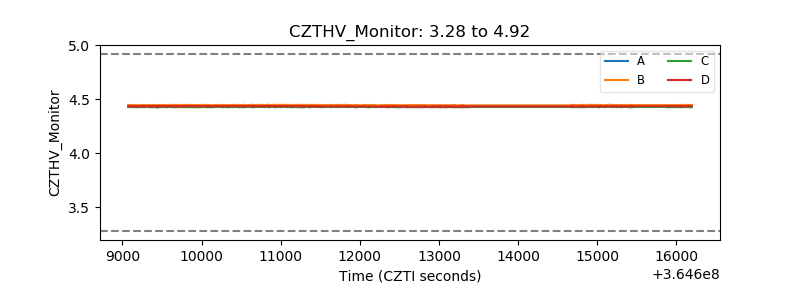 |
| D_VDD | 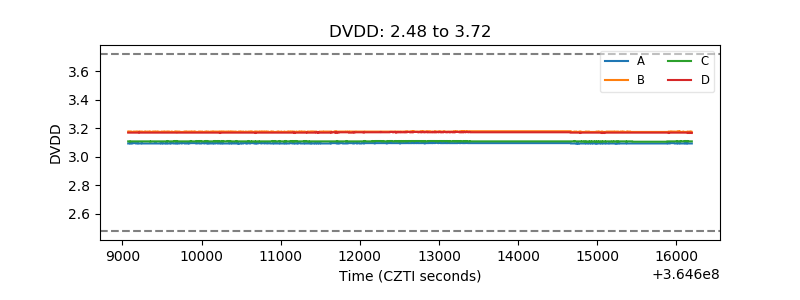 |
| Temperature 1 | 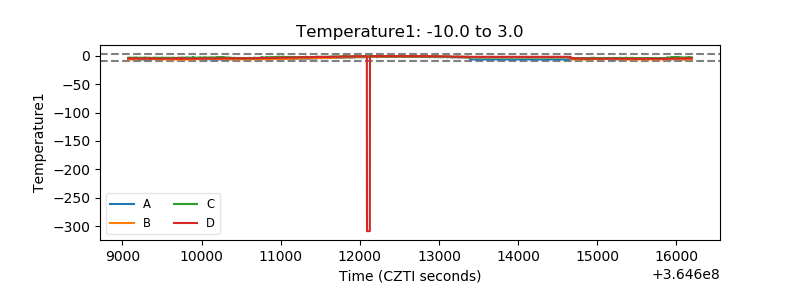 |
| Veto HV Monitor |  |
| Veto LLD | 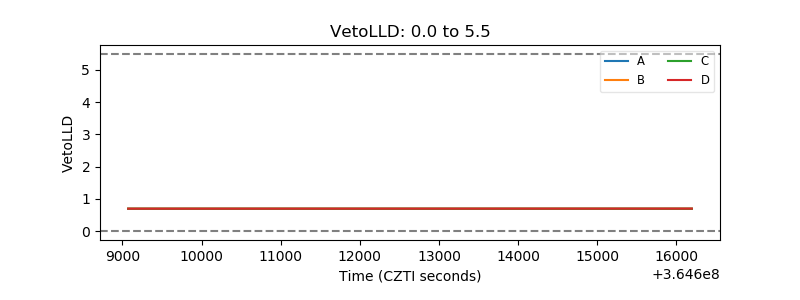 |
| Alpha Counter | 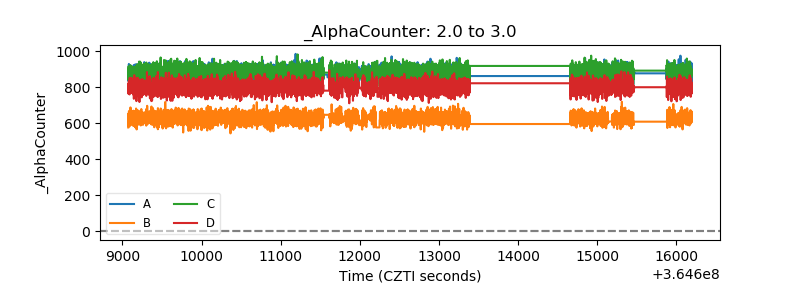 |
| _CPM_Rate | 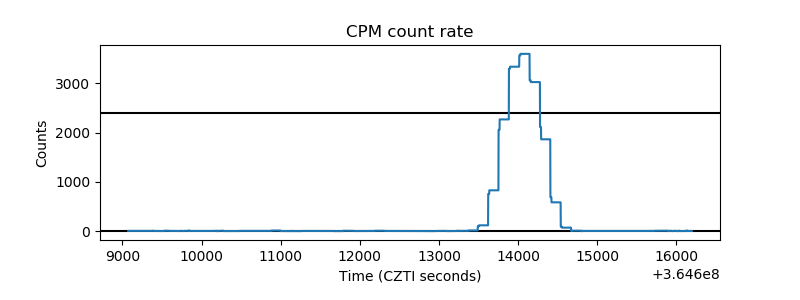 |
| CZT Counter | 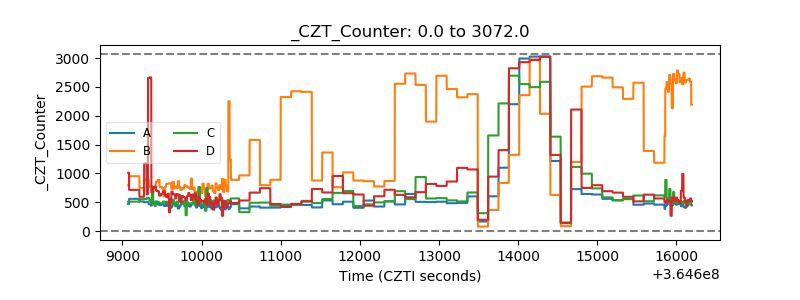 |
| +2.5 Volts monitor |  |
| +5 Volts monitor |  |
| _ROLL_ROT | 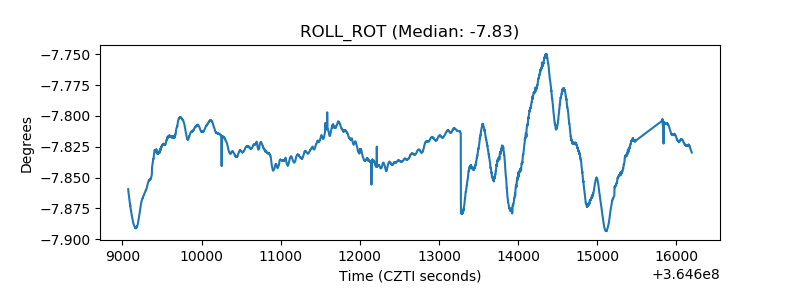 |
| _Roll_DEC | 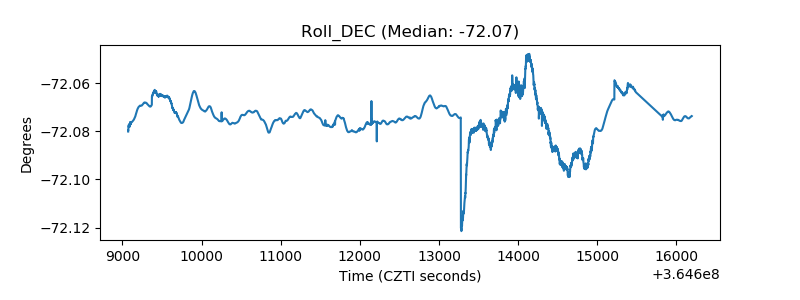 |
| _Roll_RA | 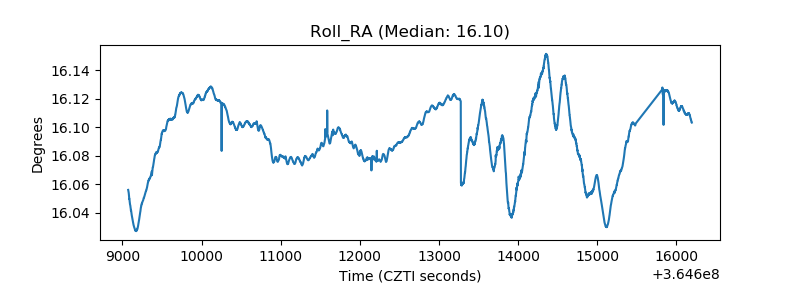 |
| Veto Counter | 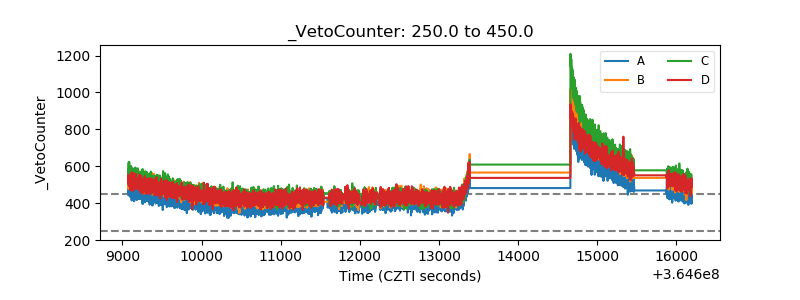 |