| Param | Original file | Final file |
|---|---|---|
| Filename | modeM0/AS1C06_005T01_9000004580_31439cztM0_level2.evt | modeM0/AS1C06_005T01_9000004580_31439cztM0_level2_quad_clean.evt |
| Size (bytes) | 867,971,520 | 124,750,080 |
| Size | 827.8 MB | 119.0 MB |
| Events in quadrant A | 3,258,719 | 998,509 |
| Events in quadrant B | 14,220,279 | 374,438 |
| Events in quadrant C | 3,709,087 | 995,204 |
| Events in quadrant D | 4,671,326 | 966,310 |
| Mode M0 | |||
|---|---|---|---|
| Quadrant | BADHDUFLAG | Total packets | Discarded packets |
| A | 0 | 13536 | 23 |
| B | 0 | 47079 | 409 |
| C | 0 | 15054 | 45 |
| D | 0 | 18212 | 38 |
| Mode M9 | |||
|---|---|---|---|
| Quadrant | BADHDUFLAG | Total packets | Discarded packets |
| A | 0 | 14 | 0 |
| B | 0 | 15 | 0 |
| C | 0 | 15 | 0 |
| D | 0 | 15 | 0 |
| Mode SS | |||
|---|---|---|---|
| Quadrant | BADHDUFLAG | Total packets | Discarded packets |
| A | 0 | 128 | 0 |
| B | 0 | 128 | 0 |
| C | 0 | 128 | 0 |
| D | 0 | 128 | 4 |
| Quadrant | Total seconds | Saturated seconds | Saturation percentage |
|---|---|---|---|
| A | 6341 | 17 | 0.268097% |
| B | 6305 | 5094 | 80.793021% |
| C | 6335 | 349 | 5.509077% |
| D | 6335 | 110 | 1.736385% |
Noise dominated data is calculated using 1-second bins in cleaned event files. If a bin has >2000 counts, and if more than 50% of those come from <1% of pixels, then it is considered to be noise-dominated and hence unusable.
| Quadrant | # 1 sec bins | Bins with >0 counts | Bins with >2000 counts | High rate bins dominated by noise | Noise dominated (total time) | Noise dominated (detector-on time) | Marked lightcurve |
|---|---|---|---|---|---|---|---|
| A | 7667 | 6352 | 0 | 0 | 0.00% | 0.00% | 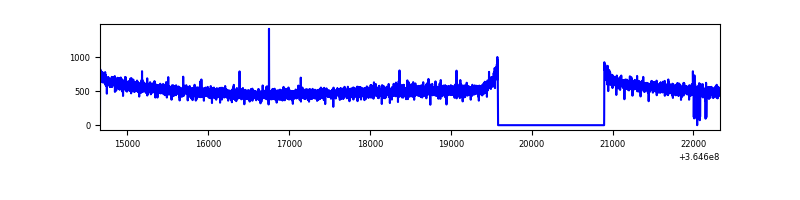 |
| B | 7666 | 6304 | 4735 | 4735 | 61.77% | 75.11% | 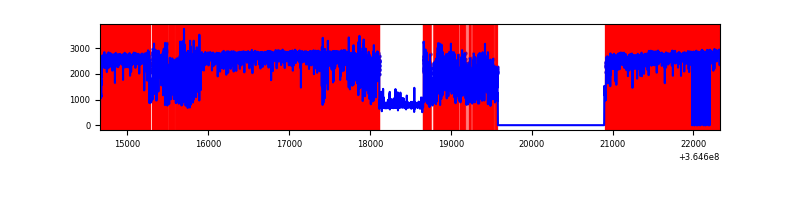 |
| C | 7667 | 6350 | 1 | 1 | 0.01% | 0.02% | 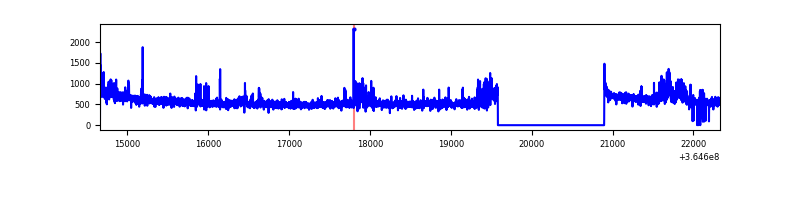 |
| D | 7667 | 6349 | 54 | 54 | 0.70% | 0.85% |  |
Top three noisy pixels from each quadrant. If the there are fewer than three noisy pixels in the level2.evt file, extra rows are filled as -1
| Pixel properties | Quadrant properties | ||||||
|---|---|---|---|---|---|---|---|
| Quadrant | DetID | PixID | Counts | Sigma | Mean | Median | Sigma |
| A | 13 | 254 | 12103 | 68.45 | 843 | 829 | 164.7 |
| A | 3 | 137 | 7735 | 41.93 | 843 | 829 | 164.7 |
| A | 0 | 226 | 7049 | 37.77 | 843 | 829 | 164.7 |
| B | 12 | 1 | 11760943 | 168893.17 | 376 | 368 | 69.6 |
| B | 6 | 159 | 807215 | 11587.1 | 376 | 368 | 69.6 |
| B | 4 | 80 | 80195 | 1146.39 | 376 | 368 | 69.6 |
| C | 14 | 238 | 208065 | 1074.29 | 836 | 846 | 192.9 |
| C | 14 | 254 | 98062 | 504.0 | 836 | 846 | 192.9 |
| C | 3 | 233 | 70309 | 360.12 | 836 | 846 | 192.9 |
| D | 1 | 52 | 656614 | 3326.74 | 837 | 819 | 197.1 |
| D | 8 | 195 | 454997 | 2303.97 | 837 | 819 | 197.1 |
| D | 12 | 218 | 243976 | 1233.5 | 837 | 819 | 197.1 |
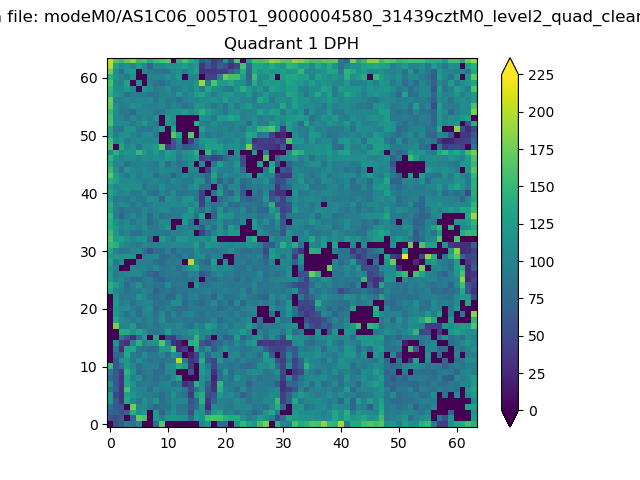
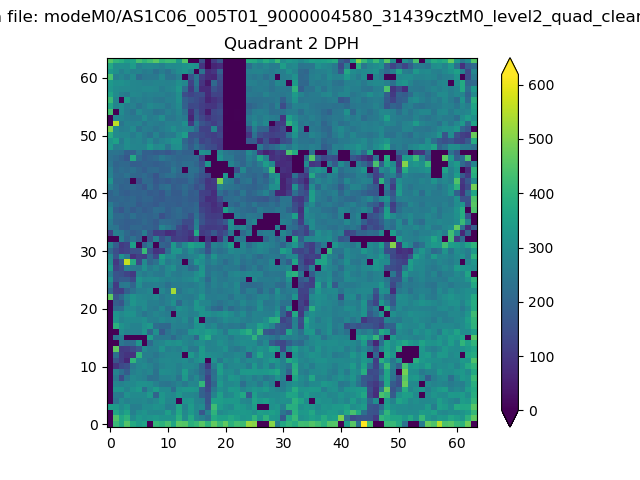
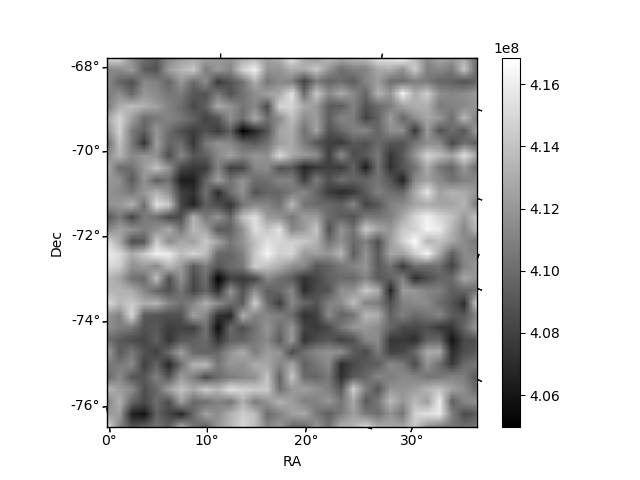
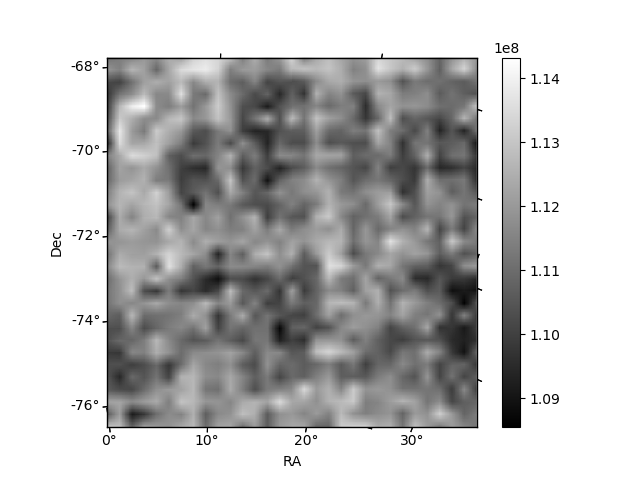
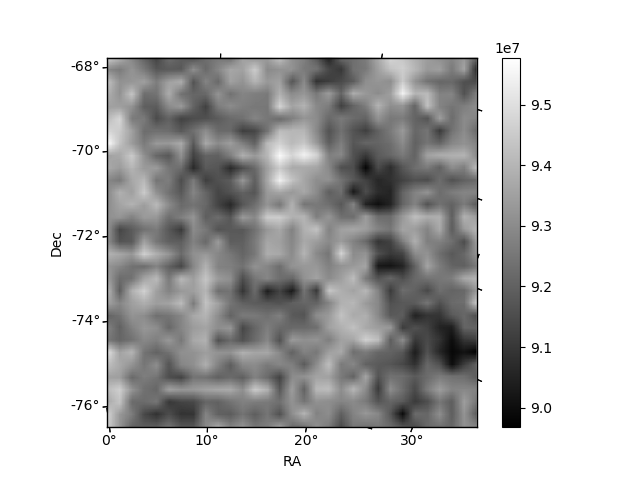
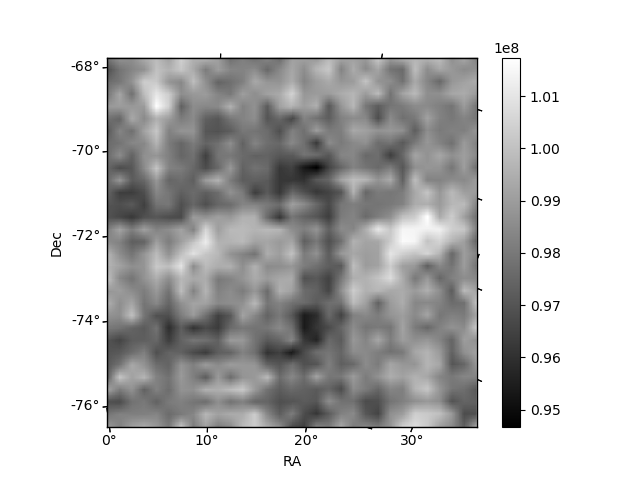
Histogram calculated using DETX and DETY for each event in the final _common_clean file
| Quadrant A | 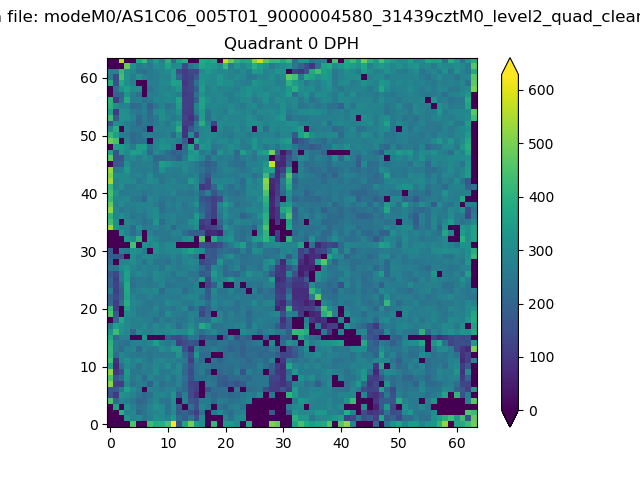 |
 |
Quadrant B |
|---|---|---|---|
| Quadrant D | 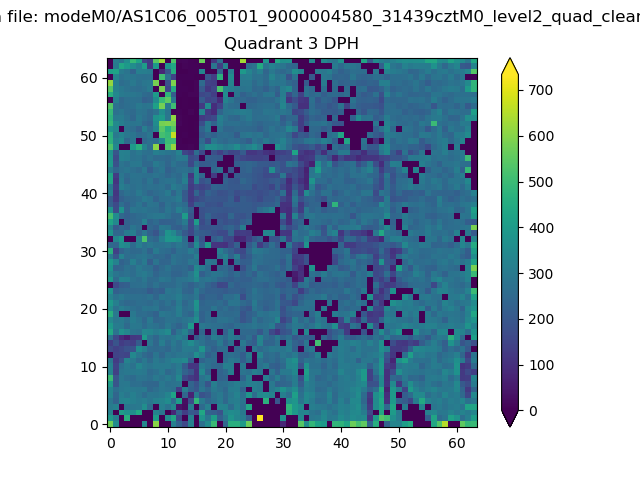 |
 |
Quadrant C |
| Plot type | Count rate plots | Images |
|---|---|---|
| Comparison with Poisson distribution Blue bars denote a histogram of data divided into 1 sec bins. Red curve is a Poisson curve with rate = median count rate of data. |
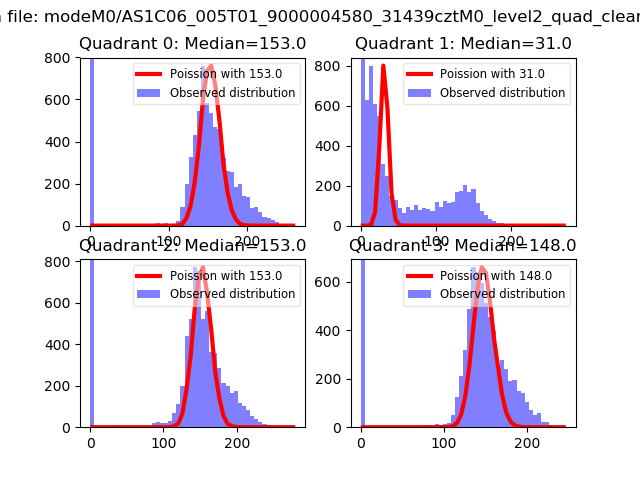 |
 |
| Quadrant-wise count rates Data is divided into 100 sec bins |
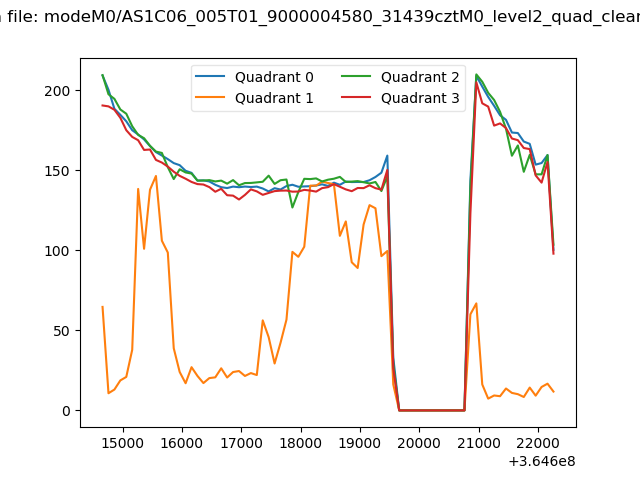 |
|
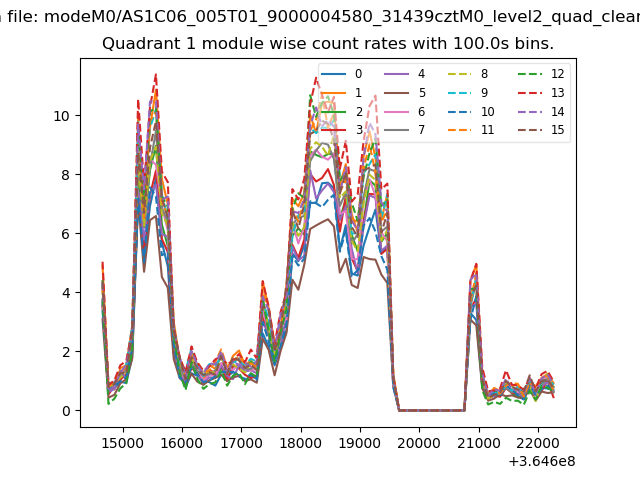
| Module-wise count rates for Quadrant A Data is divided into 100 sec bins |
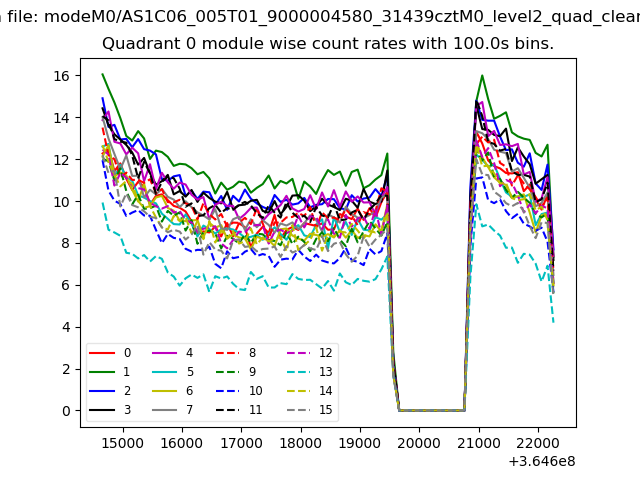 |
 |
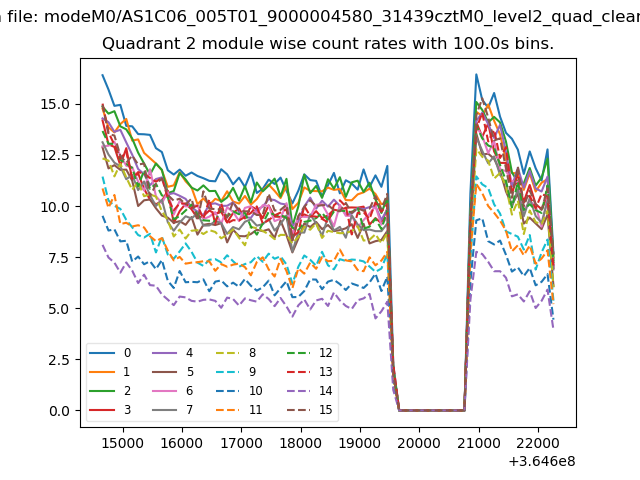
| Module-wise count rates for Quadrant B Data is divided into 100 sec bins |
 |
 |
| Module-wise count rates for Quadrant C Data is divided into 100 sec bins |
 |
 |
| Module-wise count rates for Quadrant D Data is divided into 100 sec bins |
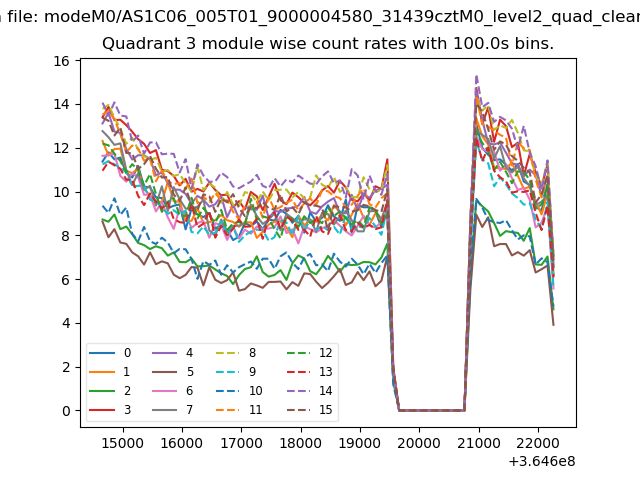 |
 |
| Parameter | Plot |
|---|---|
| CZT HV Monitor | 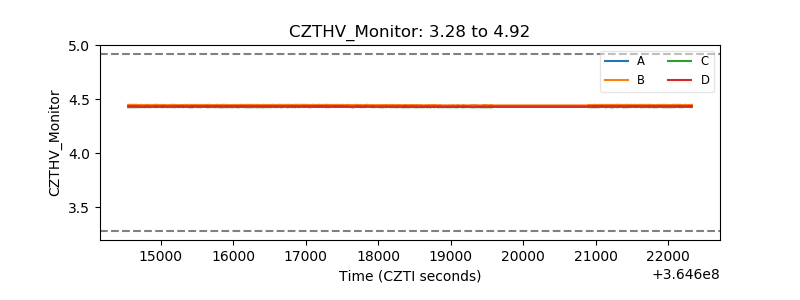 |
| D_VDD |  |
| Temperature 1 | 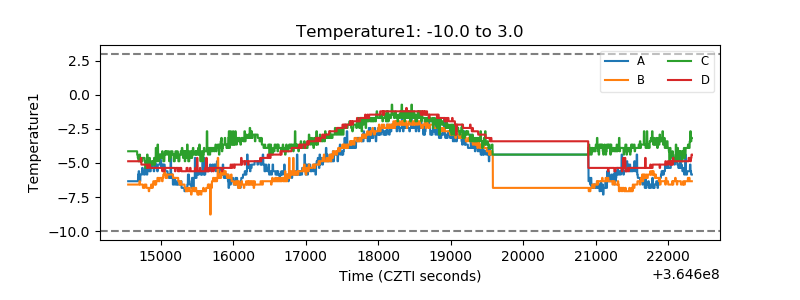 |
| Veto HV Monitor | 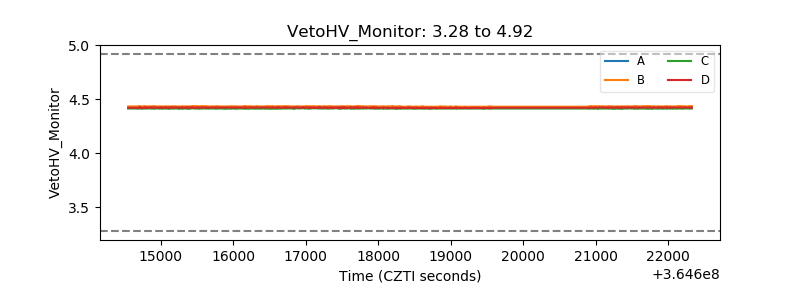 |
| Veto LLD | 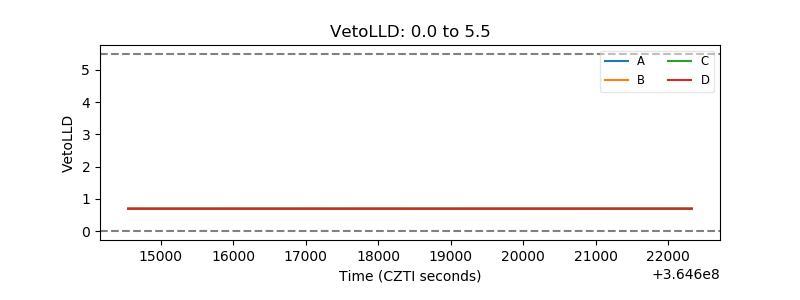 |
| Alpha Counter | 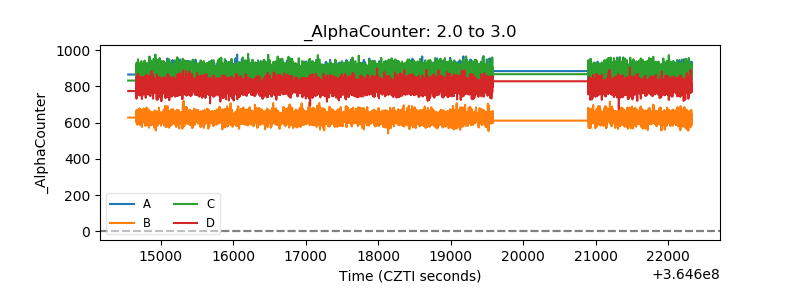 |
| _CPM_Rate | 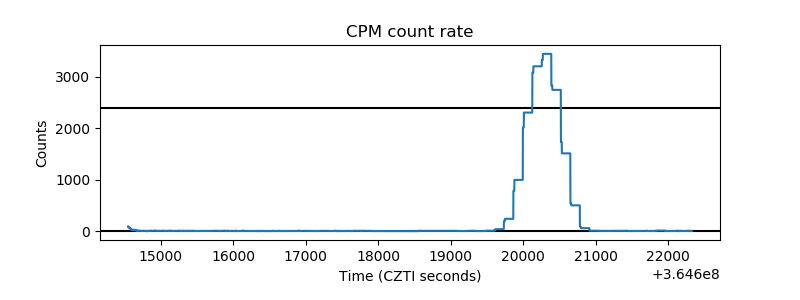 |
| CZT Counter | 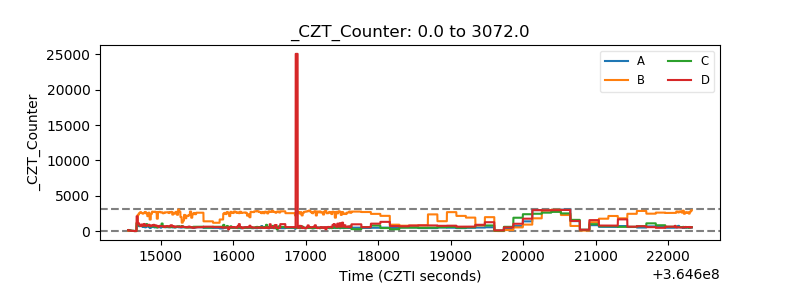 |
| +2.5 Volts monitor |  |
| +5 Volts monitor |  |
| _ROLL_ROT | 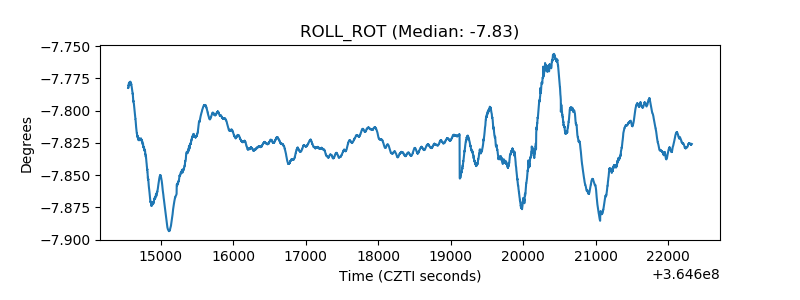 |
| _Roll_DEC | 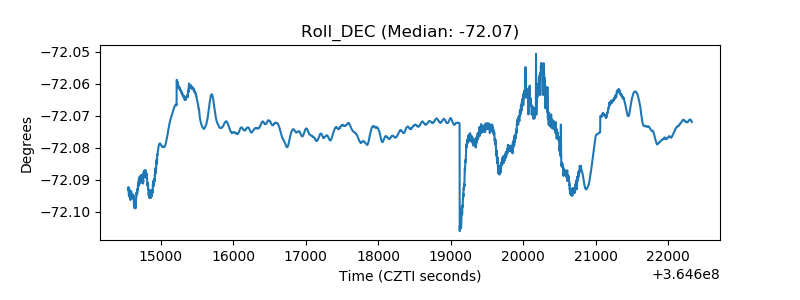 |
| _Roll_RA | 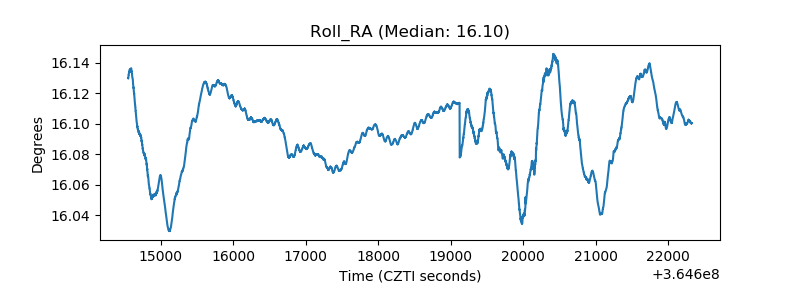 |
| Veto Counter | 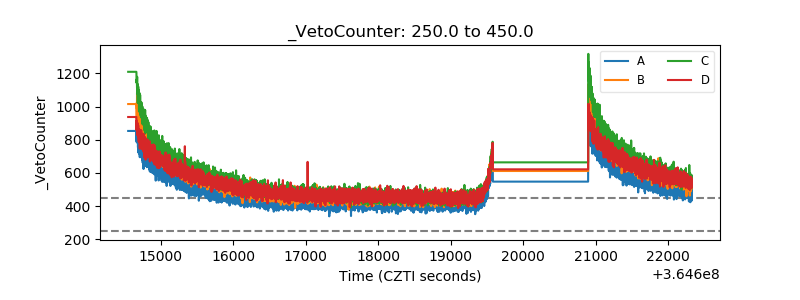 |