| Param | Original file | Final file |
|---|---|---|
| Filename | modeM0/AS1C06_005T01_9000004580_31440cztM0_level2.evt | modeM0/AS1C06_005T01_9000004580_31440cztM0_level2_quad_clean.evt |
| Size (bytes) | 606,107,520 | 82,563,840 |
| Size | 578.0 MB | 78.7 MB |
| Events in quadrant A | 2,234,568 | 690,357 |
| Events in quadrant B | 10,248,822 | 153,341 |
| Events in quadrant C | 2,560,064 | 688,488 |
| Events in quadrant D | 3,022,871 | 665,699 |
| Mode M0 | |||
|---|---|---|---|
| Quadrant | BADHDUFLAG | Total packets | Discarded packets |
| A | 0 | 10587 | 1419 |
| B | 0 | 39874 | 6589 |
| C | 0 | 11851 | 1527 |
| D | 0 | 14829 | 3094 |
| Mode M9 | |||
|---|---|---|---|
| Quadrant | BADHDUFLAG | Total packets | Discarded packets |
| A | 0 | 8 | 1 |
| B | 0 | 8 | 0 |
| C | 0 | 9 | 1 |
| D | 0 | 9 | 1 |
| Mode SS | |||
|---|---|---|---|
| Quadrant | BADHDUFLAG | Total packets | Discarded packets |
| A | 0 | 105 | 17 |
| B | 0 | 103 | 13 |
| C | 0 | 106 | 20 |
| D | 0 | 103 | 13 |
| Quadrant | Total seconds | Saturated seconds | Saturation percentage |
|---|---|---|---|
| A | 4313 | 10 | 0.231857% |
| B | 4166 | 3794 | 91.070571% |
| C | 4317 | 215 | 4.980310% |
| D | 4268 | 49 | 1.148079% |
Noise dominated data is calculated using 1-second bins in cleaned event files. If a bin has >2000 counts, and if more than 50% of those come from <1% of pixels, then it is considered to be noise-dominated and hence unusable.
| Quadrant | # 1 sec bins | Bins with >0 counts | Bins with >2000 counts | High rate bins dominated by noise | Noise dominated (total time) | Noise dominated (detector-on time) | Marked lightcurve |
|---|---|---|---|---|---|---|---|
| A | 7538 | 4380 | 0 | 0 | 0.00% | 0.00% | 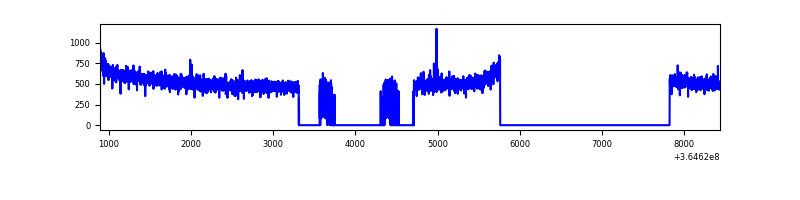 |
| B | 7537 | 4173 | 3677 | 3677 | 48.79% | 88.11% | 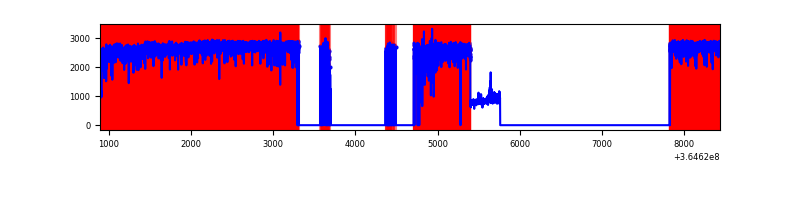 |
| C | 7538 | 4387 | 1 | 1 | 0.01% | 0.02% | 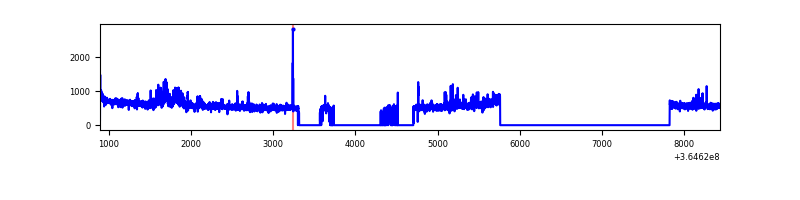 |
| D | 7538 | 4346 | 34 | 34 | 0.45% | 0.78% | 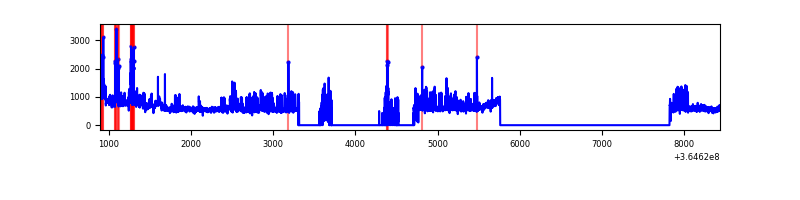 |
Top three noisy pixels from each quadrant. If the there are fewer than three noisy pixels in the level2.evt file, extra rows are filled as -1
| Pixel properties | Quadrant properties | ||||||
|---|---|---|---|---|---|---|---|
| Quadrant | DetID | PixID | Counts | Sigma | Mean | Median | Sigma |
| A | 13 | 254 | 8124 | 66.36 | 578 | 569 | 113.8 |
| A | 3 | 137 | 5158 | 40.31 | 578 | 569 | 113.8 |
| A | 0 | 226 | 4797 | 37.14 | 578 | 569 | 113.8 |
| B | 12 | 1 | 9147423 | 269095.14 | 175 | 171 | 34.0 |
| B | 6 | 159 | 374465 | 11011.03 | 175 | 171 | 34.0 |
| B | 4 | 80 | 32551 | 952.56 | 175 | 171 | 34.0 |
| C | 14 | 238 | 140626 | 1047.13 | 578 | 583 | 133.7 |
| C | 14 | 254 | 65819 | 487.79 | 578 | 583 | 133.7 |
| C | 3 | 233 | 44938 | 331.65 | 578 | 583 | 133.7 |
| D | 8 | 195 | 338667 | 2498.74 | 572 | 558 | 135.3 |
| D | 1 | 52 | 325261 | 2399.66 | 572 | 558 | 135.3 |
| D | 12 | 218 | 140092 | 1031.2 | 572 | 558 | 135.3 |
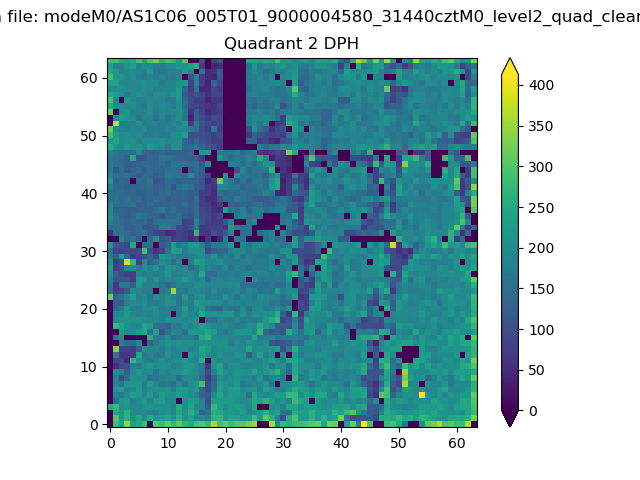
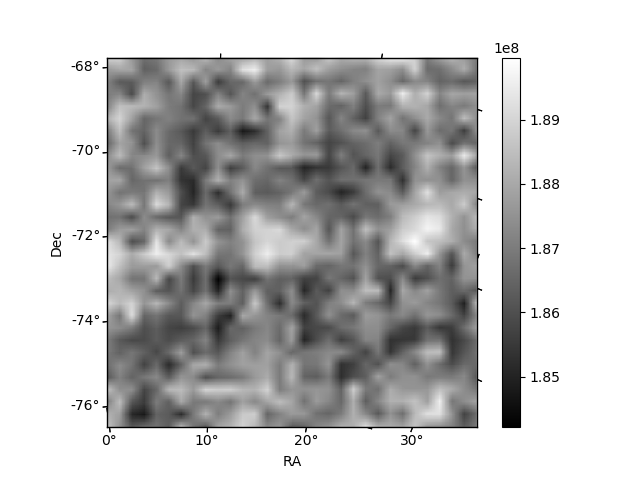
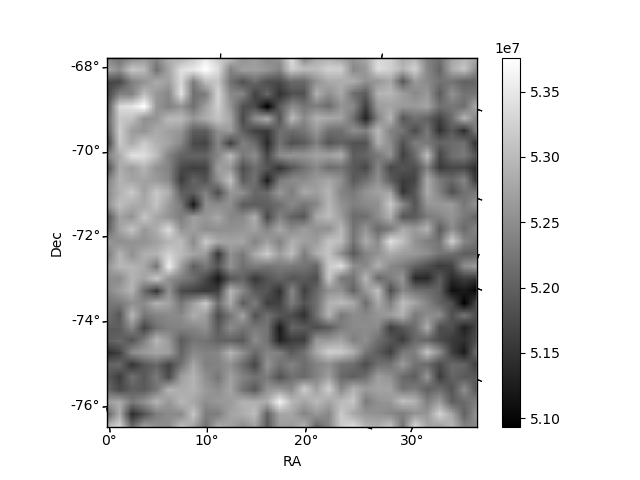
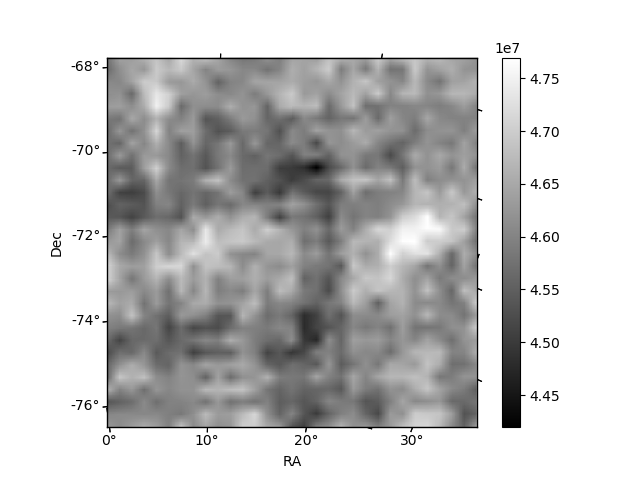
Histogram calculated using DETX and DETY for each event in the final _common_clean file
| Quadrant A | 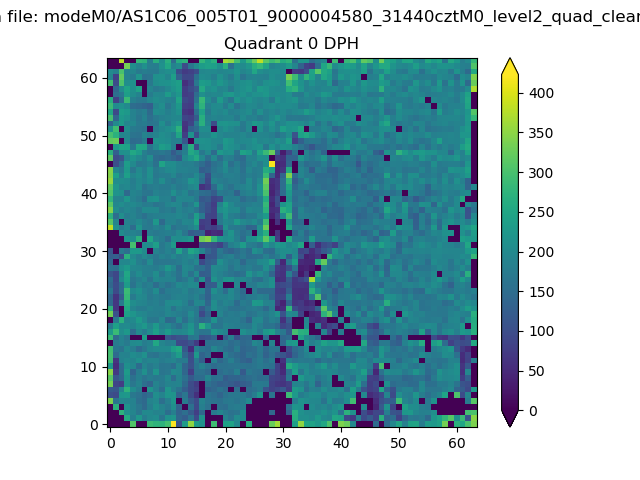 |
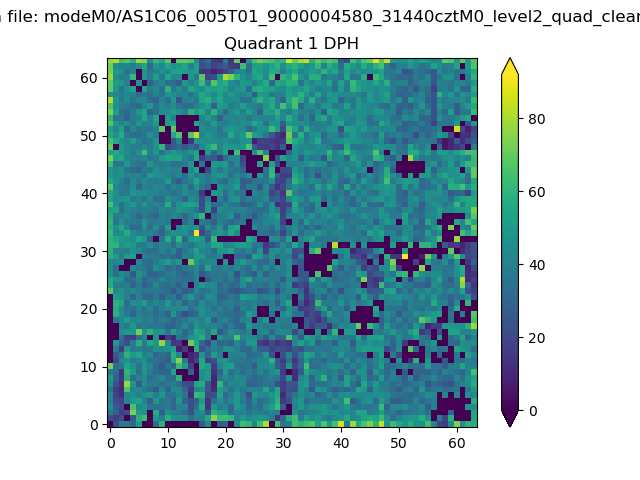 |
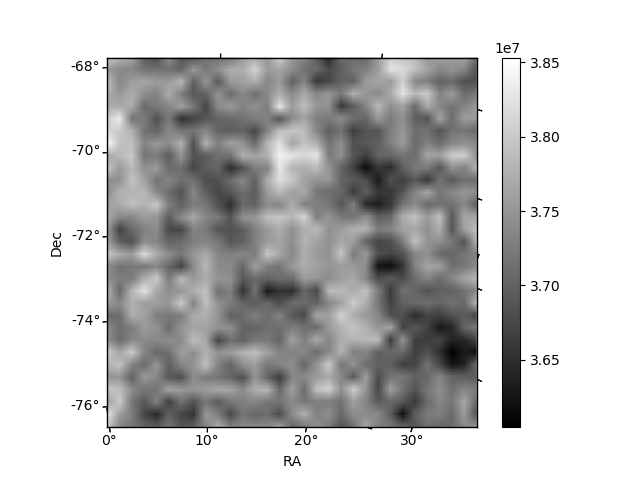
Quadrant B |
|---|---|---|---|
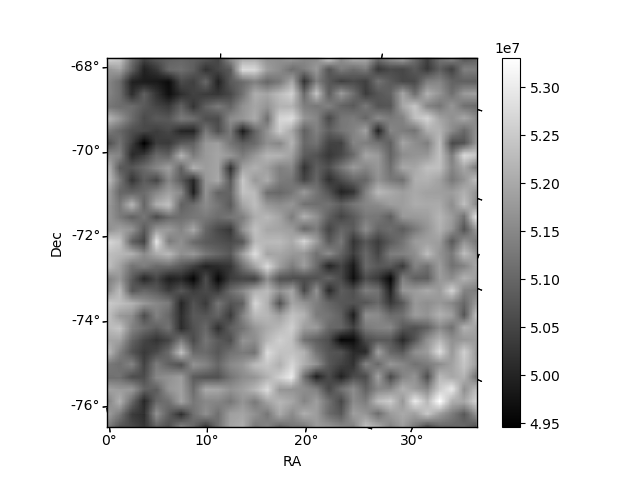
| Quadrant D | 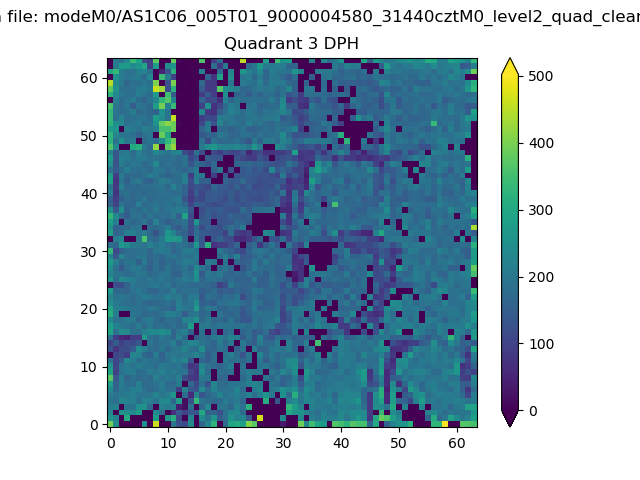 |
 |
Quadrant C |
| Plot type | Count rate plots | Images |
|---|---|---|
| Comparison with Poisson distribution Blue bars denote a histogram of data divided into 1 sec bins. Red curve is a Poisson curve with rate = median count rate of data. |
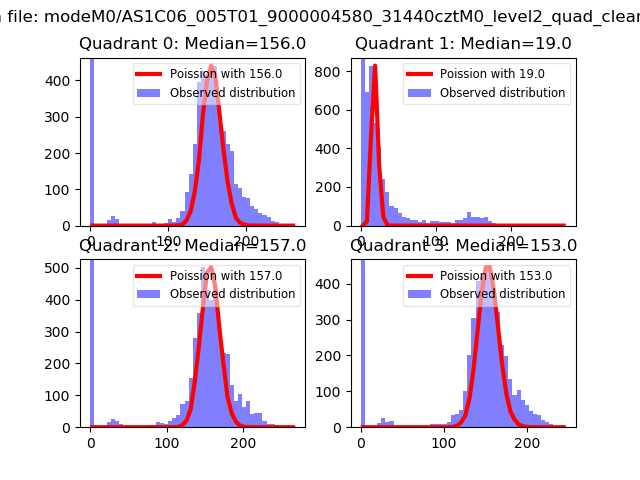 |
 |
| Quadrant-wise count rates Data is divided into 100 sec bins |
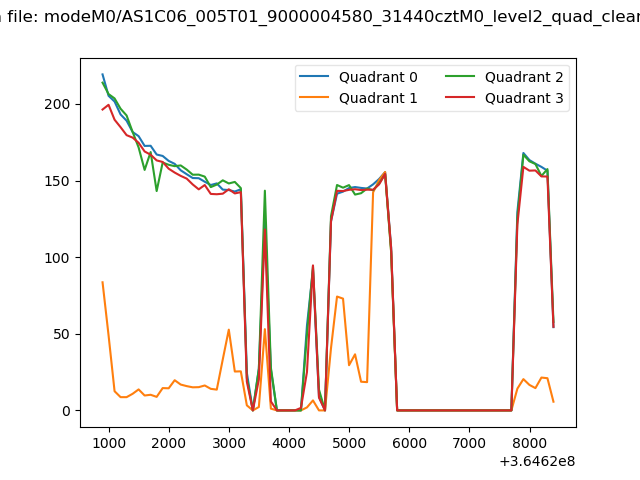 |
|
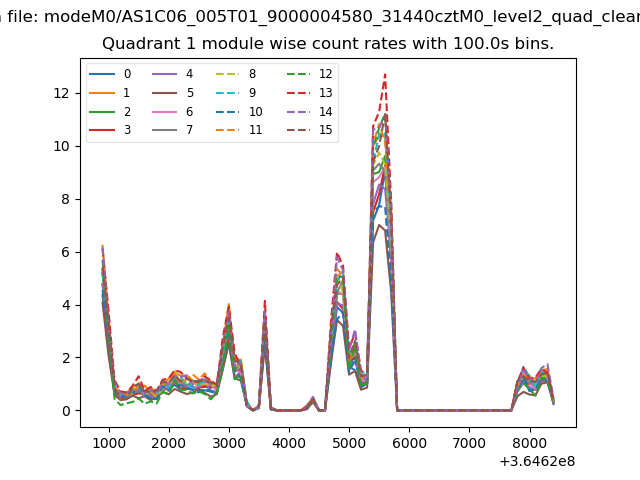
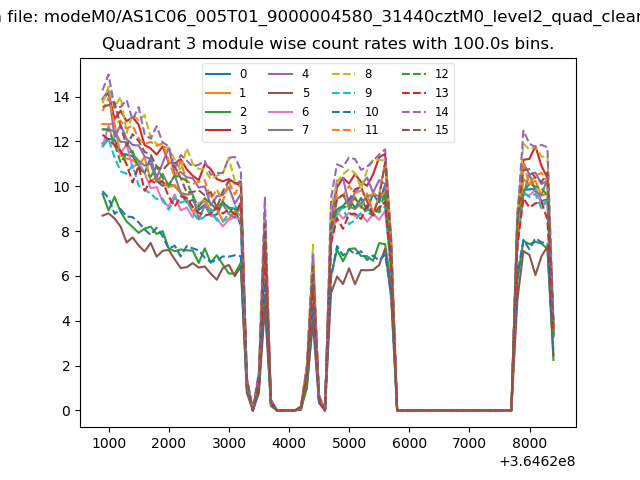
| Module-wise count rates for Quadrant A Data is divided into 100 sec bins |
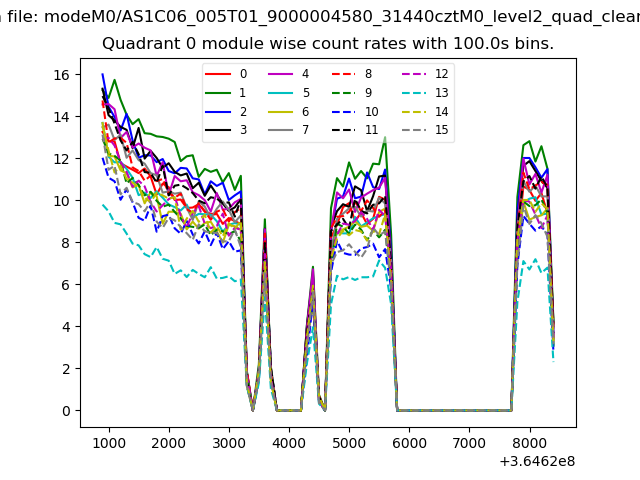 |
 |
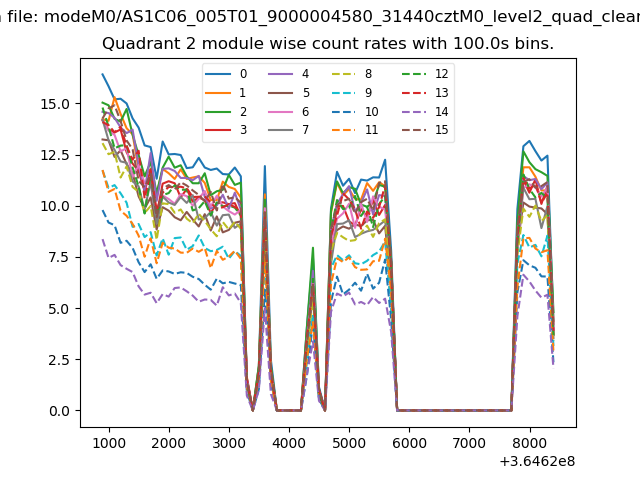
| Module-wise count rates for Quadrant B Data is divided into 100 sec bins |
 |
 |
| Module-wise count rates for Quadrant C Data is divided into 100 sec bins |
 |
 |
| Module-wise count rates for Quadrant D Data is divided into 100 sec bins |
 |
 |
| Parameter | Plot |
|---|---|
| CZT HV Monitor |  |
| D_VDD | 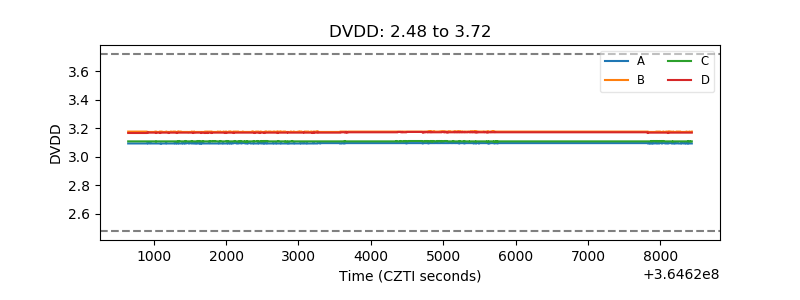 |
| Temperature 1 | 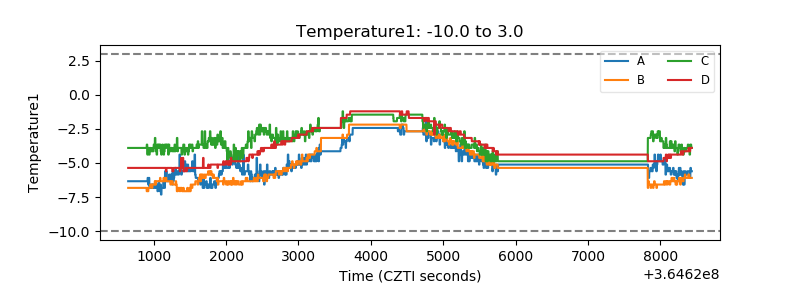 |
| Veto HV Monitor | 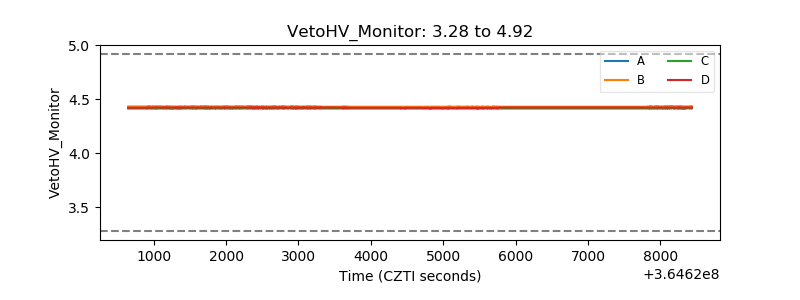 |
| Veto LLD | 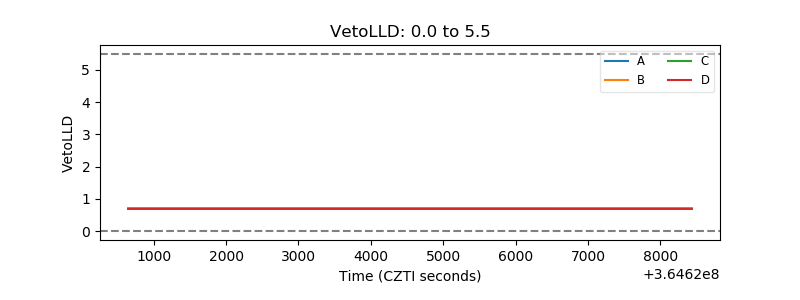 |
| Alpha Counter | 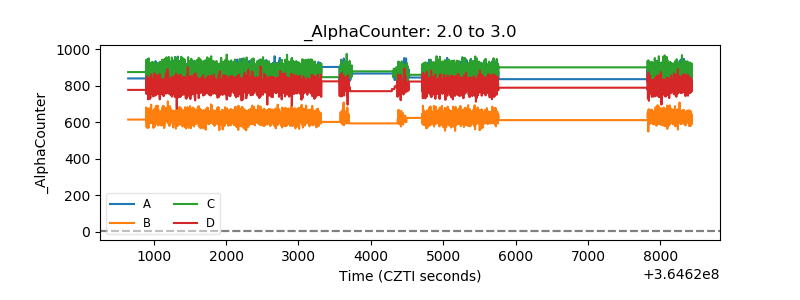 |
| _CPM_Rate | 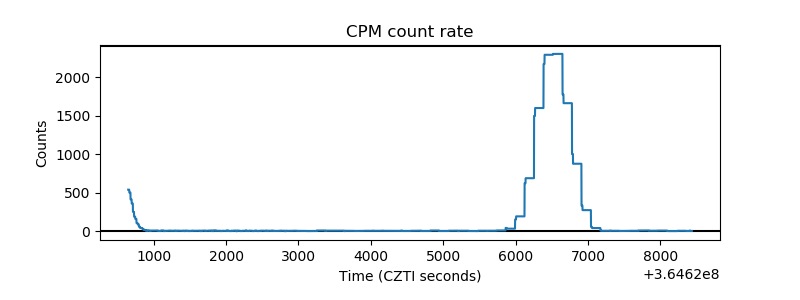 |
| CZT Counter | 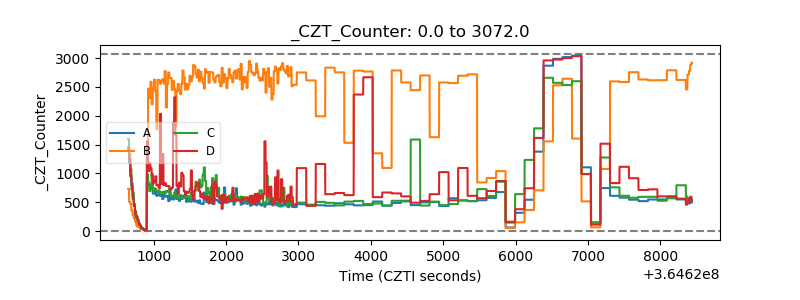 |
| +2.5 Volts monitor |  |
| +5 Volts monitor |  |
| _ROLL_ROT | 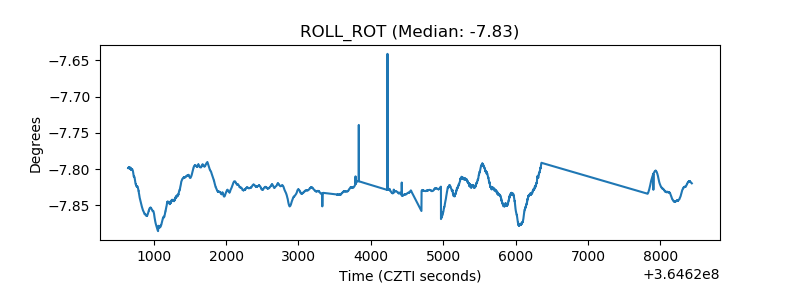 |
| _Roll_DEC | 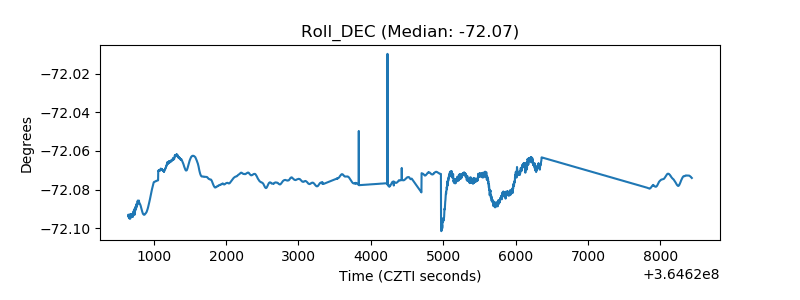 |
| _Roll_RA | 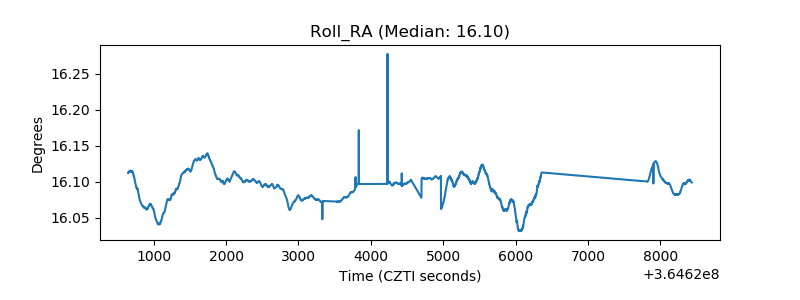 |
| Veto Counter | 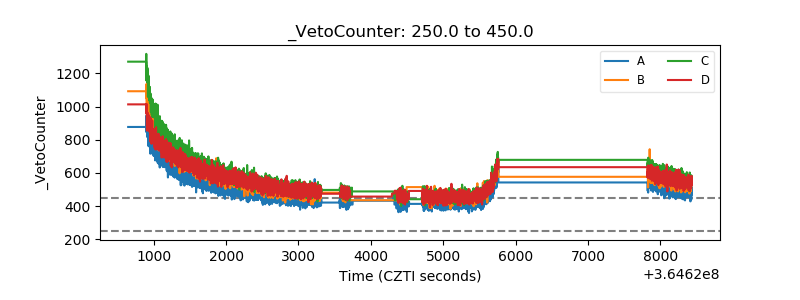 |