| Param | Original file | Final file |
|---|---|---|
| Filename | modeM0/AS1C06_005T01_9000004580_31443cztM0_level2.evt | modeM0/AS1C06_005T01_9000004580_31443cztM0_level2_quad_clean.evt |
| Size (bytes) | 2,523,168,000 | 386,930,880 |
| Size | 2.3 GB | 369.0 MB |
| Events in quadrant A | 9,974,465 | 2,935,656 |
| Events in quadrant B | 37,854,590 | 1,625,334 |
| Events in quadrant C | 12,119,470 | 2,908,583 |
| Events in quadrant D | 15,085,777 | 2,830,793 |
| Mode M0 | |||
|---|---|---|---|
| Quadrant | BADHDUFLAG | Total packets | Discarded packets |
| A | 0 | 42190 | 3 |
| B | 0 | 126931 | 3 |
| C | 0 | 48532 | 4 |
| D | 0 | 58408 | 3 |
| Mode M9 | |||
|---|---|---|---|
| Quadrant | BADHDUFLAG | Total packets | Discarded packets |
| A | 0 | 32 | 0 |
| B | 0 | 32 | 0 |
| C | 0 | 32 | 0 |
| D | 0 | 32 | 0 |
| Mode SS | |||
|---|---|---|---|
| Quadrant | BADHDUFLAG | Total packets | Discarded packets |
| A | 0 | 414 | 0 |
| B | 0 | 414 | 0 |
| C | 0 | 414 | 0 |
| D | 0 | 414 | 0 |
| Quadrant | Total seconds | Saturated seconds | Saturation percentage |
|---|---|---|---|
| A | 20550 | 221 | 1.075426% |
| B | 20551 | 11970 | 58.245341% |
| C | 20551 | 858 | 4.174979% |
| D | 20551 | 677 | 3.294244% |
Noise dominated data is calculated using 1-second bins in cleaned event files. If a bin has >2000 counts, and if more than 50% of those come from <1% of pixels, then it is considered to be noise-dominated and hence unusable.
| Quadrant | # 1 sec bins | Bins with >0 counts | Bins with >2000 counts | High rate bins dominated by noise | Noise dominated (total time) | Noise dominated (detector-on time) | Marked lightcurve |
|---|---|---|---|---|---|---|---|
| A | 25889 | 20554 | 0 | 0 | 0.00% | 0.00% | 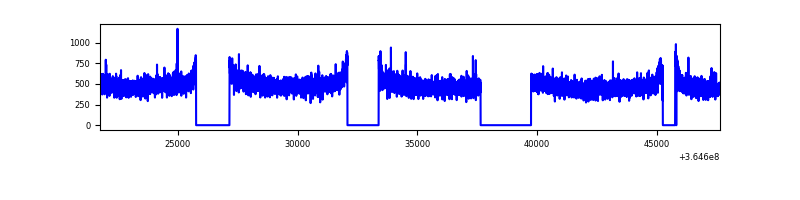 |
| B | 25890 | 20554 | 11284 | 11284 | 43.58% | 54.90% | 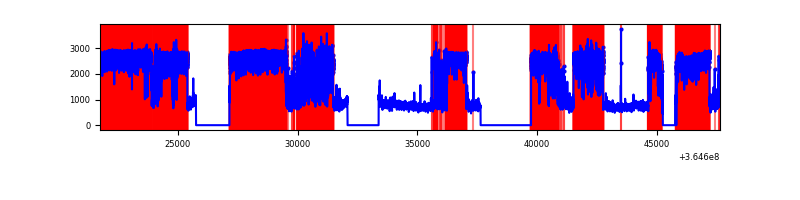 |
| C | 25890 | 20553 | 131 | 131 | 0.51% | 0.64% |  |
| D | 25890 | 20554 | 429 | 429 | 1.66% | 2.09% |  |
Top three noisy pixels from each quadrant. If the there are fewer than three noisy pixels in the level2.evt file, extra rows are filled as -1
| Pixel properties | Quadrant properties | ||||||
|---|---|---|---|---|---|---|---|
| Quadrant | DetID | PixID | Counts | Sigma | Mean | Median | Sigma |
| A | 13 | 254 | 38773 | 71.8 | 2580 | 2528 | 504.8 |
| A | 3 | 137 | 24660 | 43.84 | 2580 | 2528 | 504.8 |
| A | 0 | 226 | 21774 | 38.12 | 2580 | 2528 | 504.8 |
| B | 12 | 1 | 28001890 | 98273.79 | 1544 | 1504 | 284.9 |
| B | 6 | 159 | 3438336 | 12062.35 | 1544 | 1504 | 284.9 |
| B | 4 | 80 | 194168 | 676.2 | 1544 | 1504 | 284.9 |
| C | 3 | 233 | 1142426 | 1997.82 | 2502 | 2520 | 570.6 |
| C | 14 | 238 | 488063 | 850.97 | 2502 | 2520 | 570.6 |
| C | 0 | 10 | 435660 | 759.13 | 2502 | 2520 | 570.6 |
| D | 8 | 195 | 2066858 | 3508.85 | 2530 | 2471 | 588.3 |
| D | 12 | 218 | 1562433 | 2651.48 | 2530 | 2471 | 588.3 |
| D | 1 | 52 | 1176808 | 1996.03 | 2530 | 2471 | 588.3 |
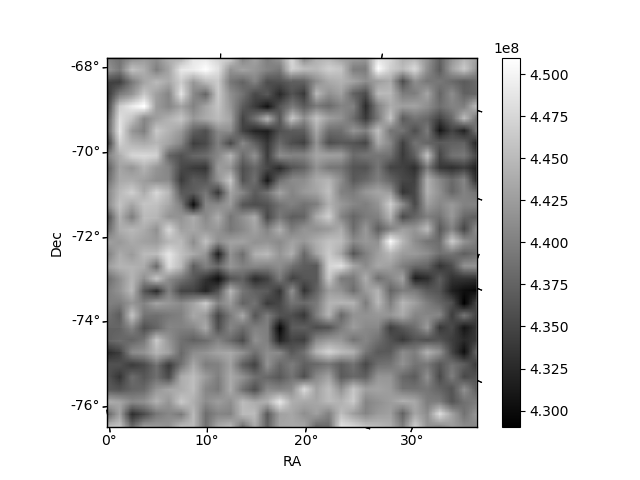
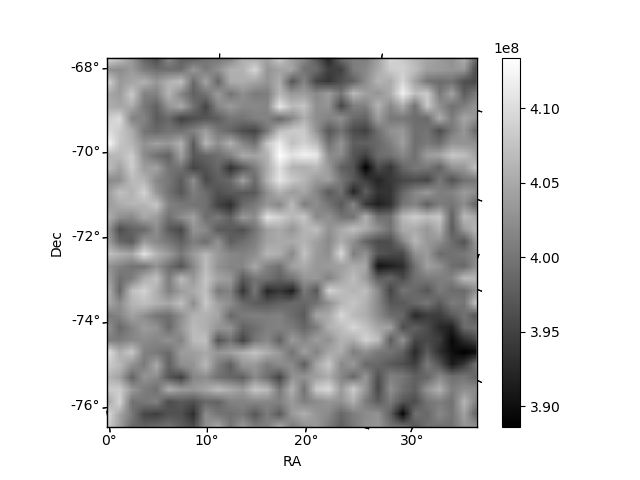
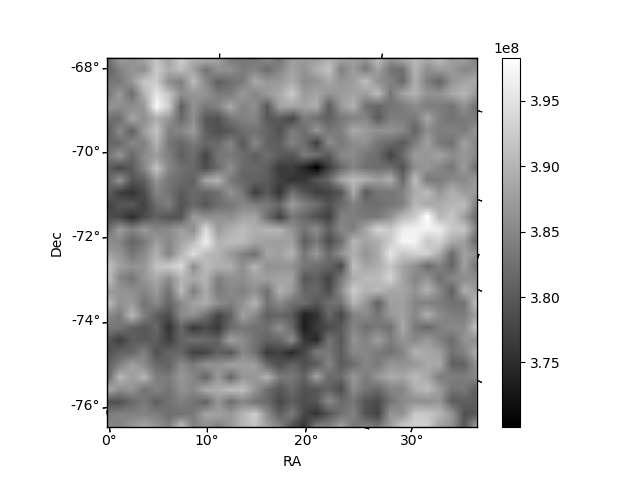
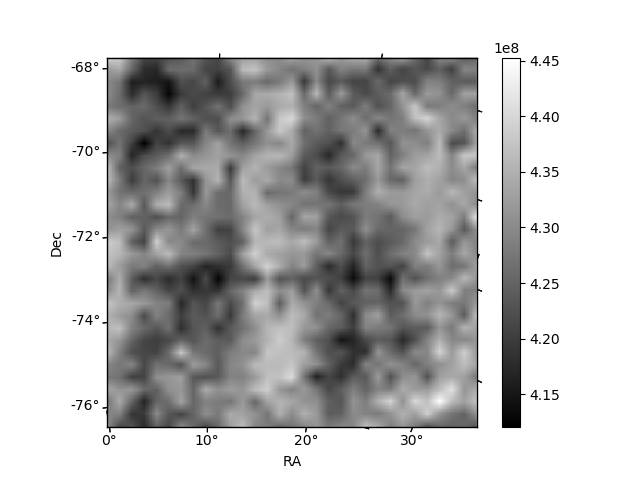
Histogram calculated using DETX and DETY for each event in the final _common_clean file
| Quadrant A | 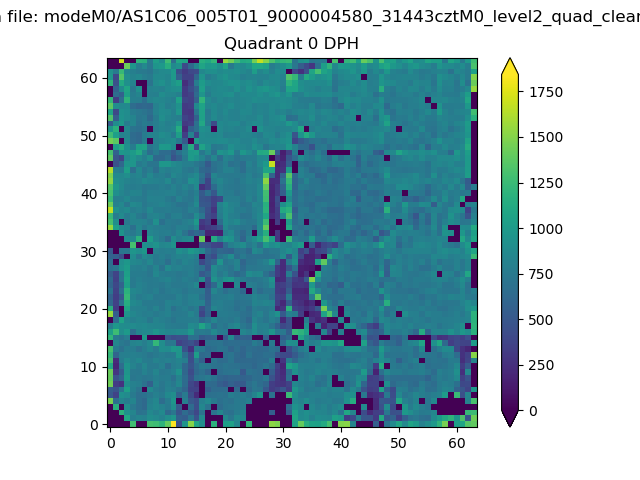 |
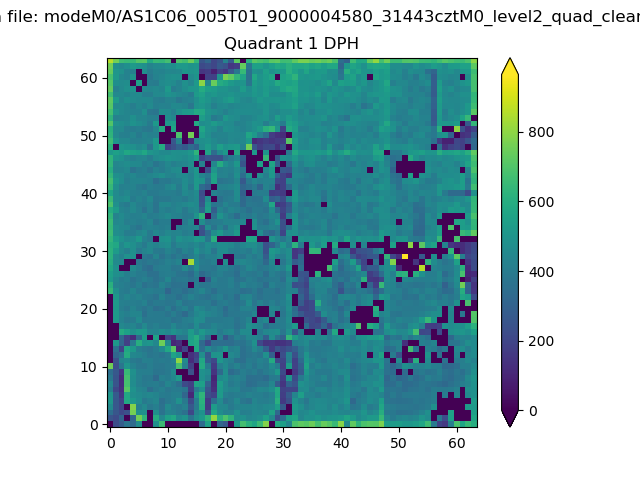 |
Quadrant B |
|---|---|---|---|
| Quadrant D | 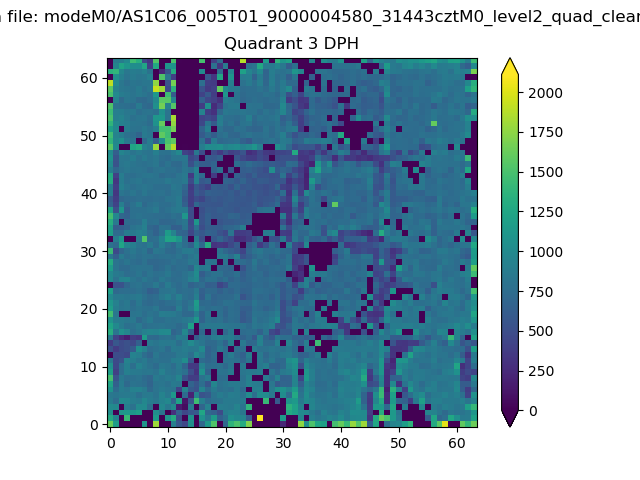 |
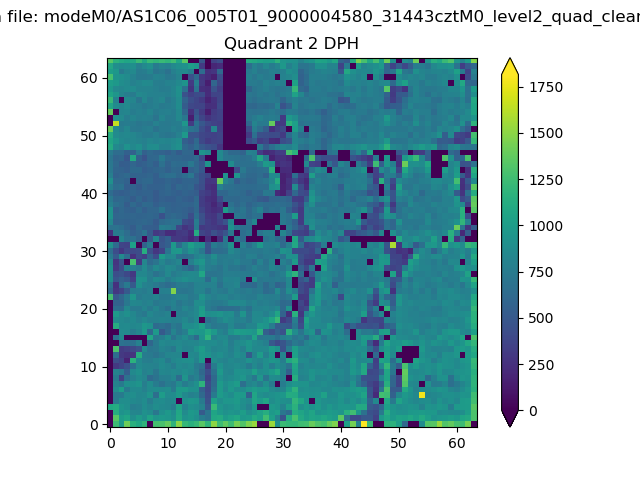 |
Quadrant C |
| Plot type | Count rate plots | Images |
|---|---|---|
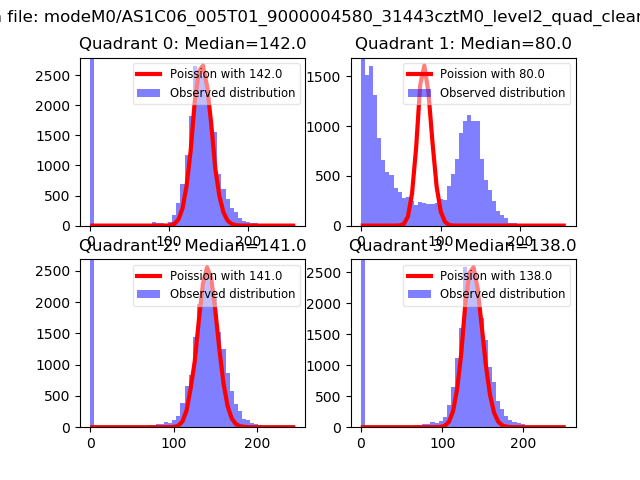
| Comparison with Poisson distribution Blue bars denote a histogram of data divided into 1 sec bins. Red curve is a Poisson curve with rate = median count rate of data. |
 |
 |
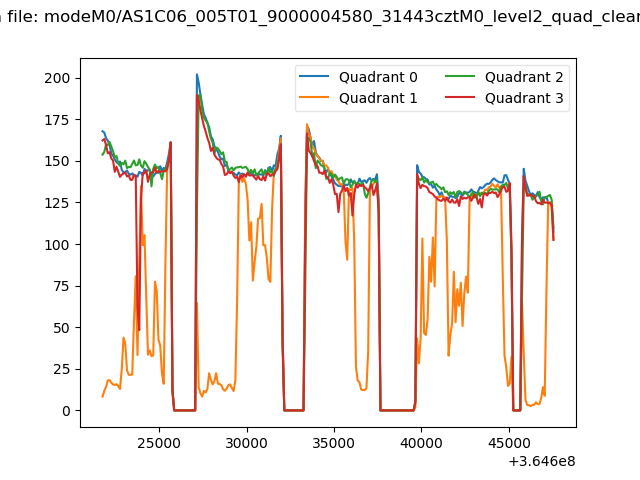
| Quadrant-wise count rates Data is divided into 100 sec bins |
 |
|
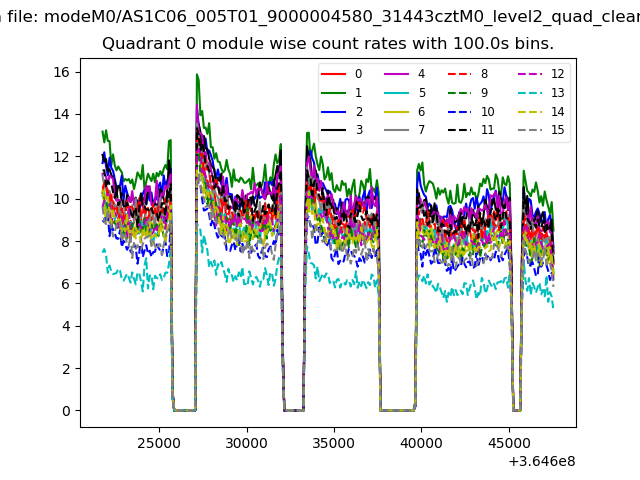
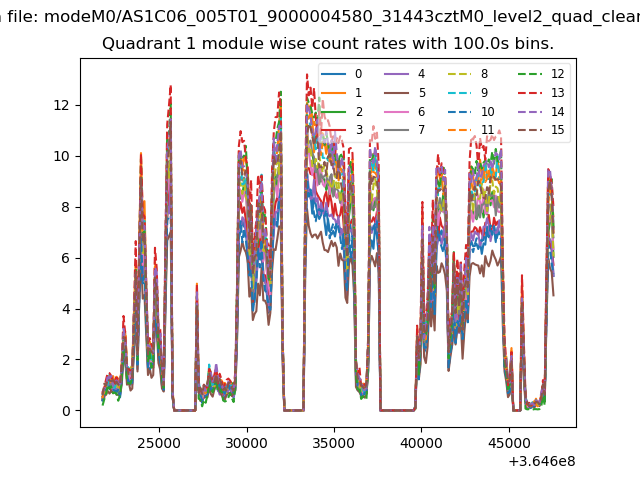
| Module-wise count rates for Quadrant A Data is divided into 100 sec bins |
 |
 |
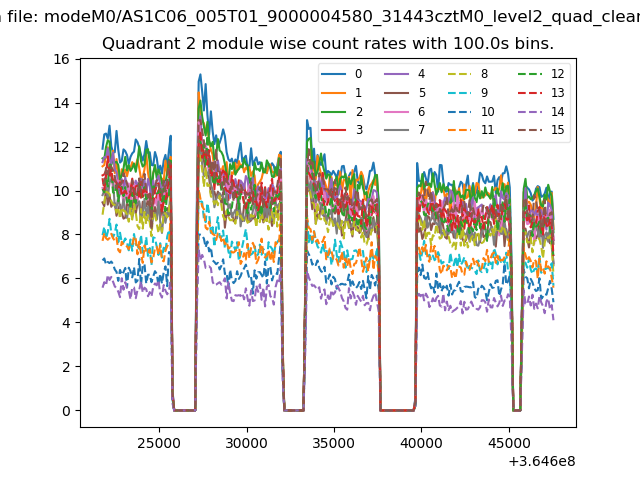
| Module-wise count rates for Quadrant B Data is divided into 100 sec bins |
 |
 |
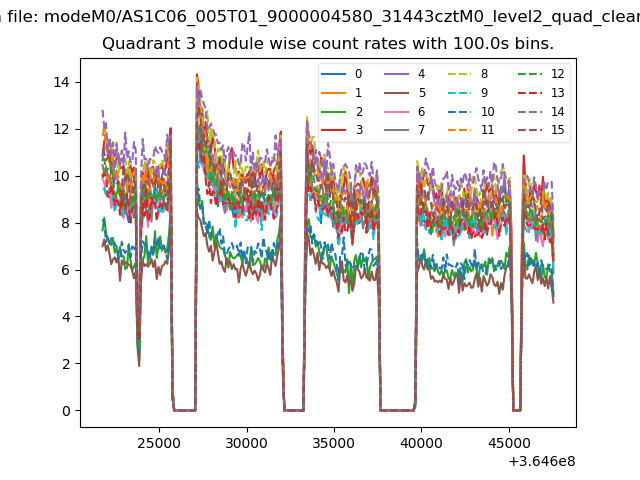
| Module-wise count rates for Quadrant C Data is divided into 100 sec bins |
 |
 |
| Module-wise count rates for Quadrant D Data is divided into 100 sec bins |
 |
 |
| Parameter | Plot |
|---|---|
| CZT HV Monitor | 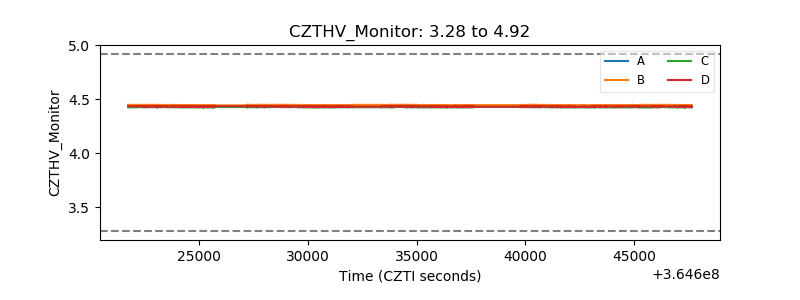 |
| D_VDD | 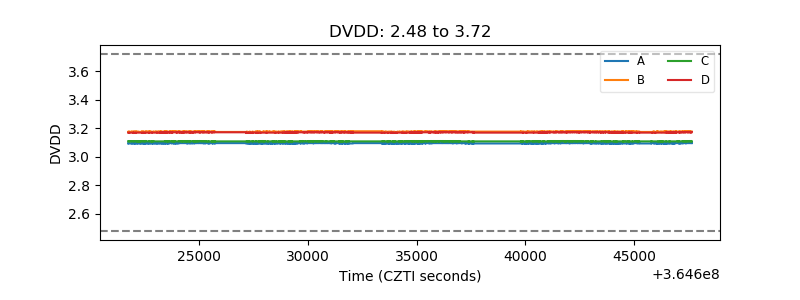 |
| Temperature 1 | 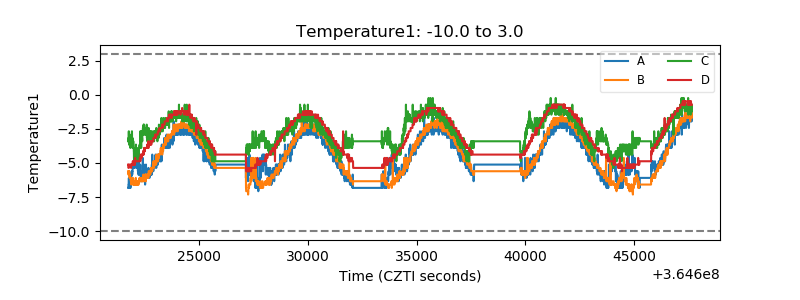 |
| Veto HV Monitor | 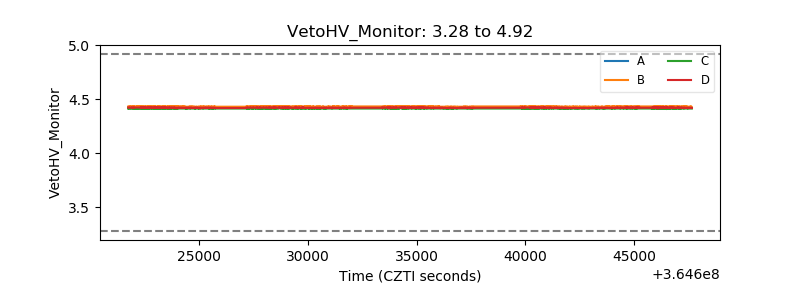 |
| Veto LLD | 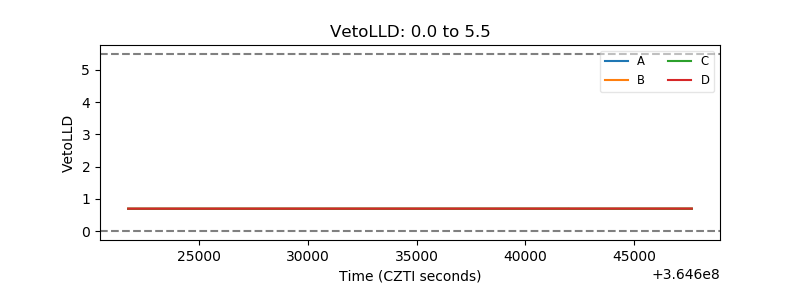 |
| Alpha Counter | 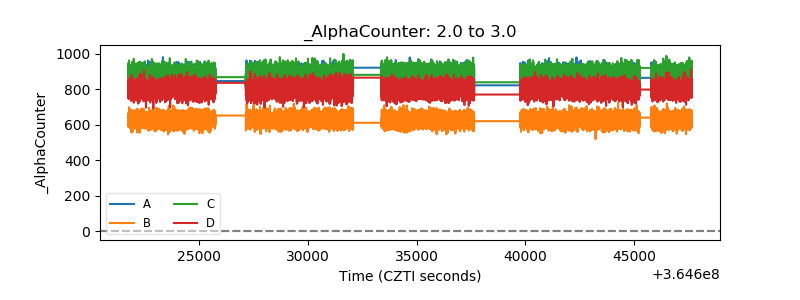 |
| _CPM_Rate | 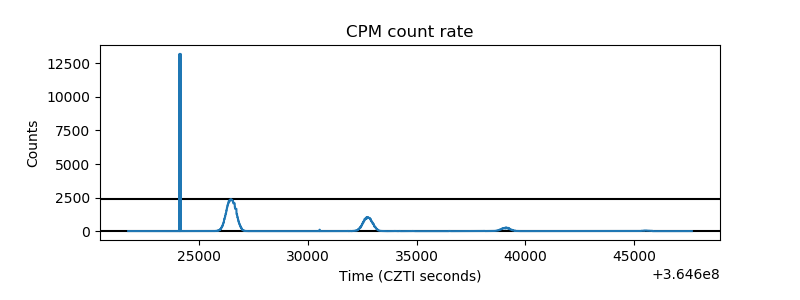 |
| CZT Counter | 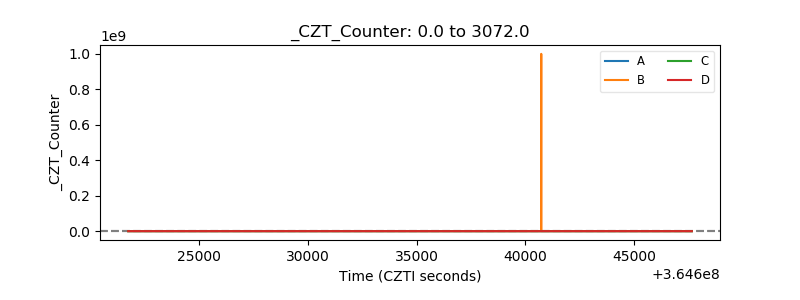 |
| +2.5 Volts monitor | 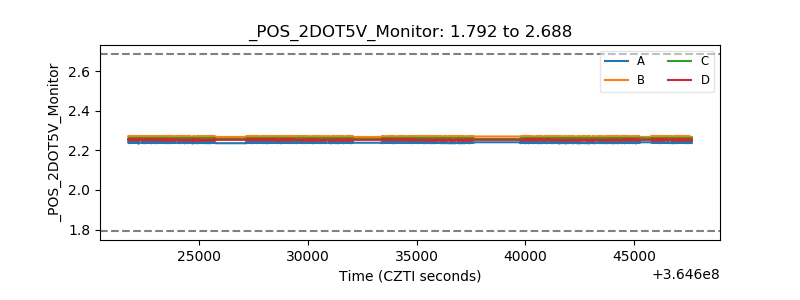 |
| +5 Volts monitor |  |
| _ROLL_ROT | 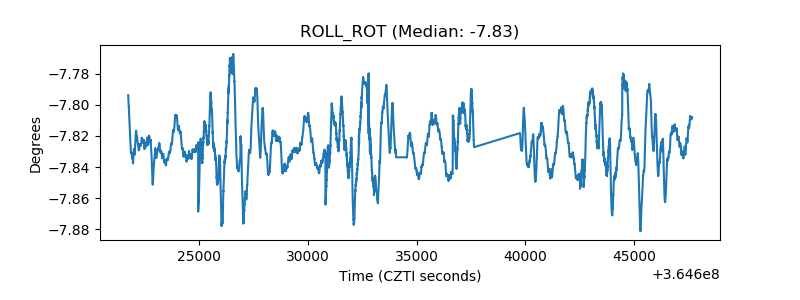 |
| _Roll_DEC | 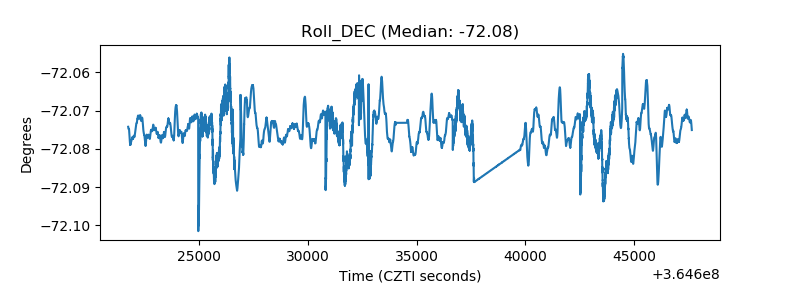 |
| _Roll_RA | 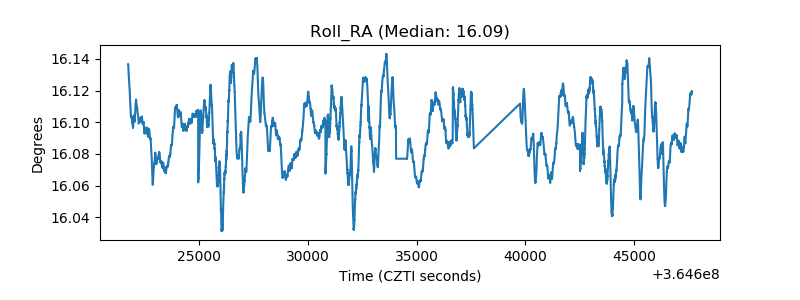 |
| Veto Counter | 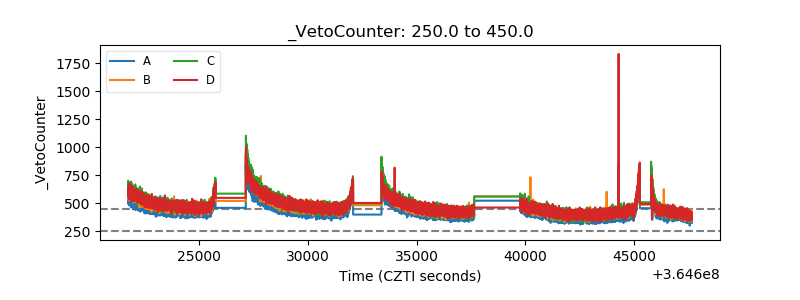 |