| Param | Original file | Final file |
|---|---|---|
| Filename | modeM0/AS1C06_005T01_9000004580_31444cztM0_level2.evt | modeM0/AS1C06_005T01_9000004580_31444cztM0_level2_quad_clean.evt |
| Size (bytes) | 683,608,320 | 128,119,680 |
| Size | 651.9 MB | 122.2 MB |
| Events in quadrant A | 3,258,738 | 892,772 |
| Events in quadrant B | 8,413,347 | 763,451 |
| Events in quadrant C | 3,864,852 | 879,777 |
| Events in quadrant D | 4,698,261 | 861,787 |
| Mode M0 | |||
|---|---|---|---|
| Quadrant | BADHDUFLAG | Total packets | Discarded packets |
| A | 0 | 14292 | 2 |
| B | 0 | 30013 | 2 |
| C | 0 | 15921 | 2 |
| D | 0 | 18458 | 2 |
| Mode M9 | |||
|---|---|---|---|
| Quadrant | BADHDUFLAG | Total packets | Discarded packets |
| A | 0 | 1 | 0 |
| B | 0 | 1 | 0 |
| C | 0 | 1 | 0 |
| D | 0 | 1 | 0 |
| Mode SS | |||
|---|---|---|---|
| Quadrant | BADHDUFLAG | Total packets | Discarded packets |
| A | 0 | 140 | 0 |
| B | 0 | 140 | 0 |
| C | 0 | 140 | 0 |
| D | 0 | 140 | 0 |
| Quadrant | Total seconds | Saturated seconds | Saturation percentage |
|---|---|---|---|
| A | 6914 | 219 | 3.167486% |
| B | 6914 | 1690 | 24.443159% |
| C | 6914 | 381 | 5.510558% |
| D | 6915 | 331 | 4.786696% |
Noise dominated data is calculated using 1-second bins in cleaned event files. If a bin has >2000 counts, and if more than 50% of those come from <1% of pixels, then it is considered to be noise-dominated and hence unusable.
| Quadrant | # 1 sec bins | Bins with >0 counts | Bins with >2000 counts | High rate bins dominated by noise | Noise dominated (total time) | Noise dominated (detector-on time) | Marked lightcurve |
|---|---|---|---|---|---|---|---|
| A | 7029 | 6914 | 0 | 0 | 0.00% | 0.00% | 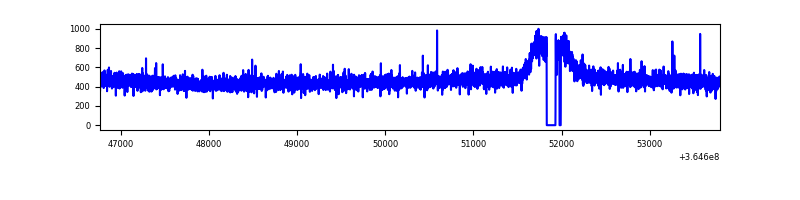 |
| B | 7029 | 6914 | 1176 | 1176 | 16.73% | 17.01% | 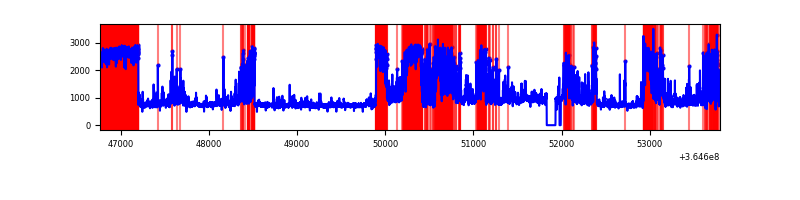 |
| C | 7029 | 6915 | 11 | 11 | 0.16% | 0.16% | 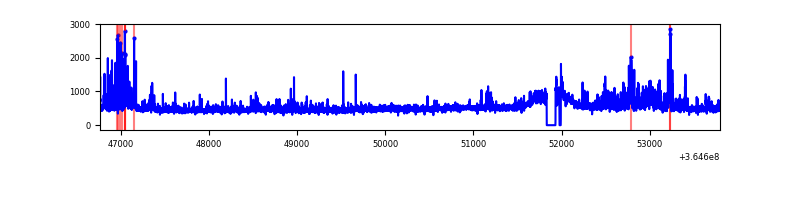 |
| D | 7030 | 6915 | 137 | 137 | 1.95% | 1.98% | 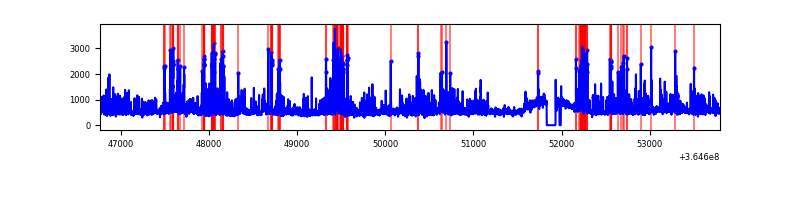 |
Top three noisy pixels from each quadrant. If the there are fewer than three noisy pixels in the level2.evt file, extra rows are filled as -1
| Pixel properties | Quadrant properties | ||||||
|---|---|---|---|---|---|---|---|
| Quadrant | DetID | PixID | Counts | Sigma | Mean | Median | Sigma |
| A | 13 | 254 | 13315 | 73.66 | 843 | 822 | 169.6 |
| A | 3 | 137 | 8792 | 46.99 | 843 | 822 | 169.6 |
| A | 0 | 226 | 7301 | 38.2 | 843 | 822 | 169.6 |
| B | 12 | 1 | 3540157 | 25173.42 | 729 | 710 | 140.6 |
| B | 6 | 159 | 1678811 | 11935.07 | 729 | 710 | 140.6 |
| B | 4 | 80 | 154924 | 1096.81 | 729 | 710 | 140.6 |
| C | 3 | 233 | 386735 | 2046.71 | 808 | 811 | 188.6 |
| C | 14 | 238 | 166649 | 879.51 | 808 | 811 | 188.6 |
| C | 0 | 10 | 58622 | 306.6 | 808 | 811 | 188.6 |
| D | 8 | 195 | 668773 | 3483.28 | 819 | 795 | 191.8 |
| D | 12 | 218 | 288487 | 1500.22 | 819 | 795 | 191.8 |
| D | 12 | 233 | 174284 | 904.69 | 819 | 795 | 191.8 |
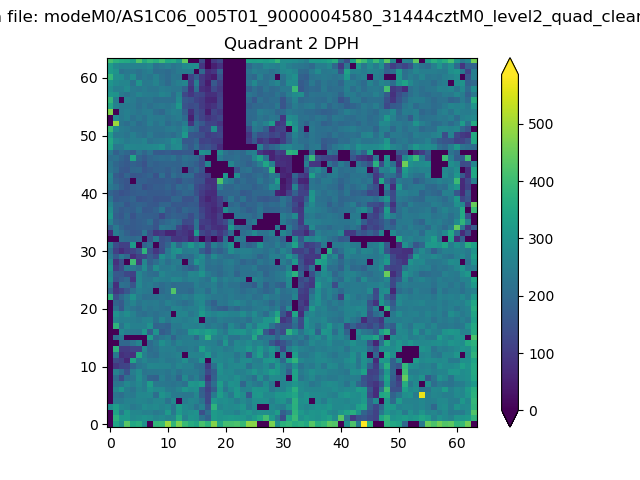
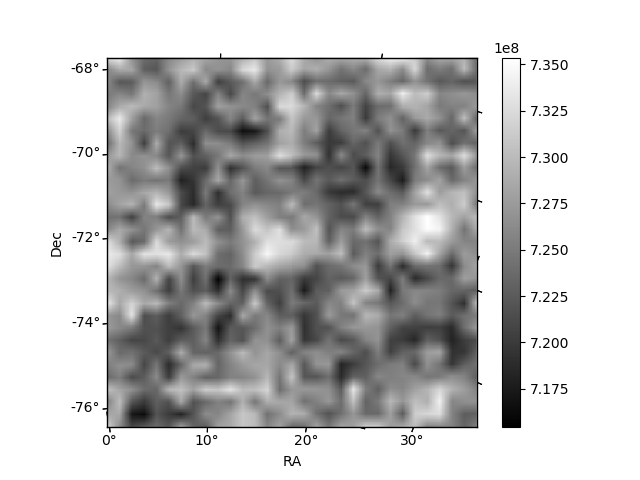
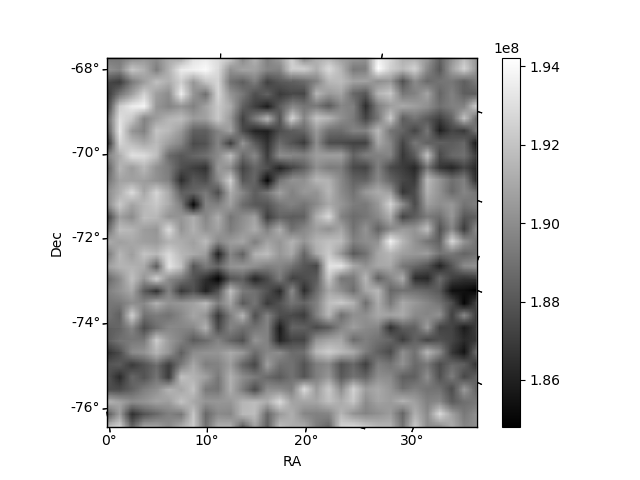
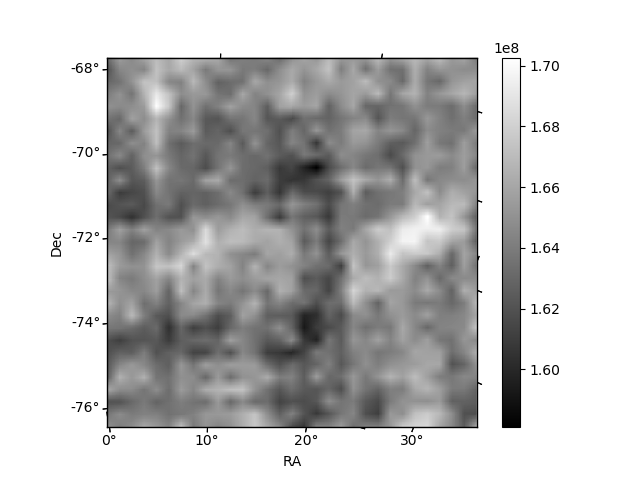
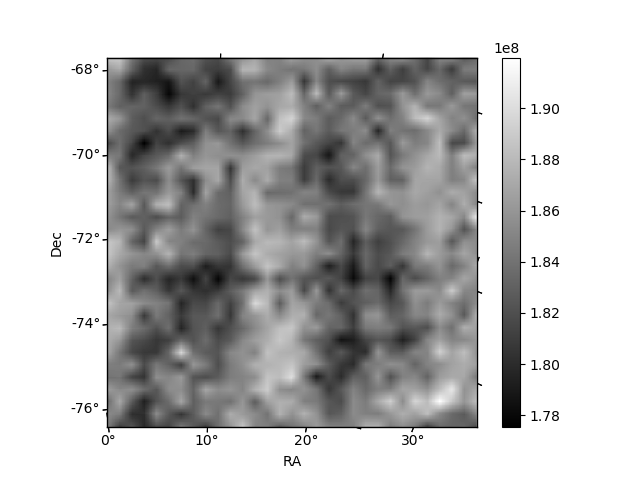
Histogram calculated using DETX and DETY for each event in the final _common_clean file
| Quadrant A | 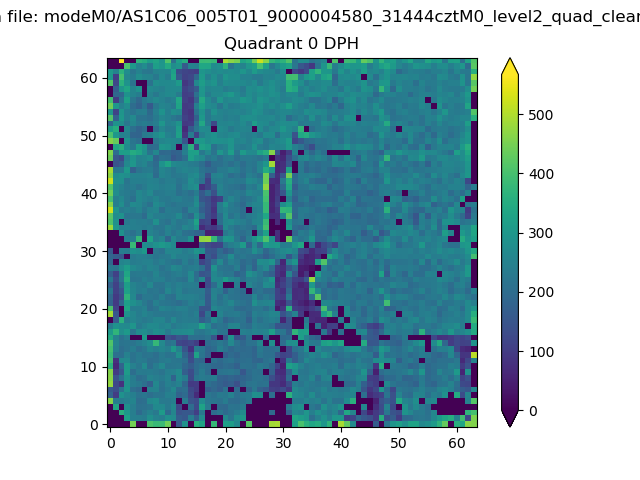 |
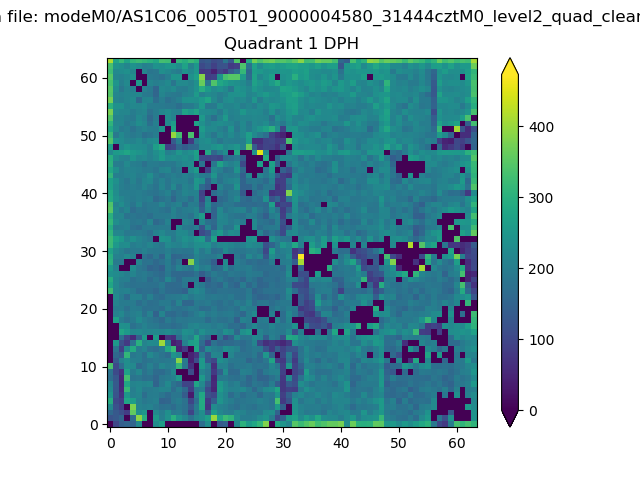 |
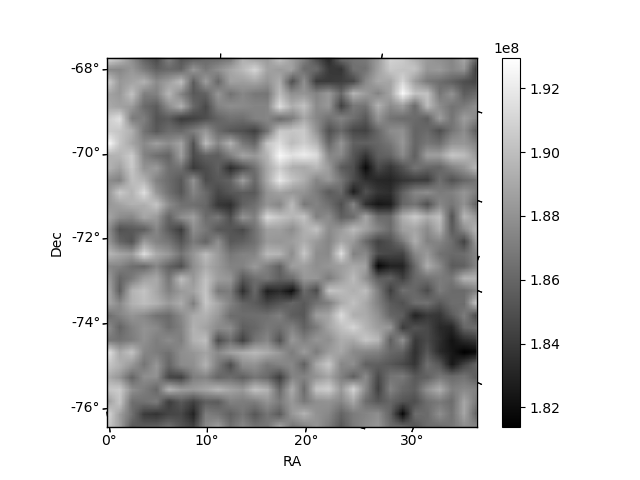
Quadrant B |
|---|---|---|---|
| Quadrant D | 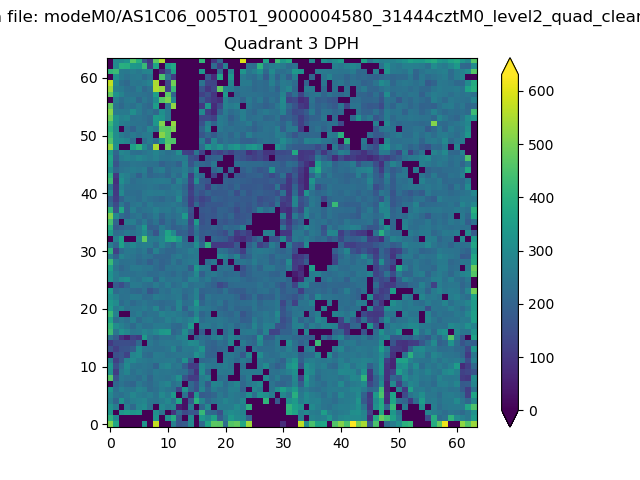 |
 |
Quadrant C |
| Plot type | Count rate plots | Images |
|---|---|---|
| Comparison with Poisson distribution Blue bars denote a histogram of data divided into 1 sec bins. Red curve is a Poisson curve with rate = median count rate of data. |
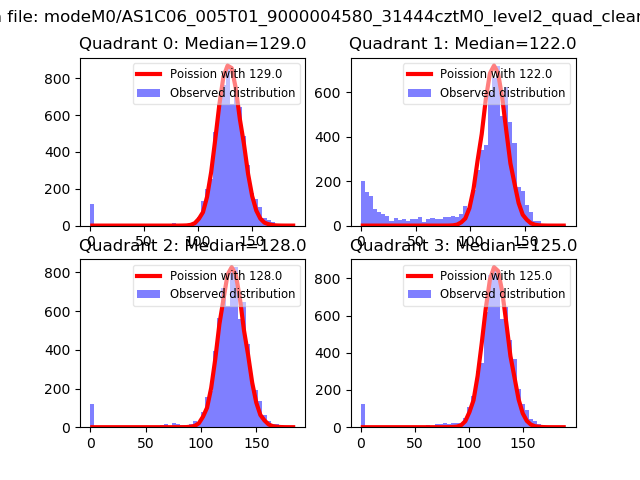 |
 |
| Quadrant-wise count rates Data is divided into 100 sec bins |
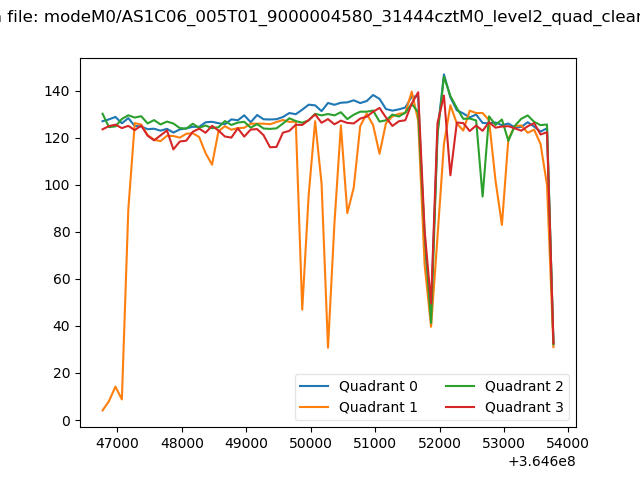 |
|
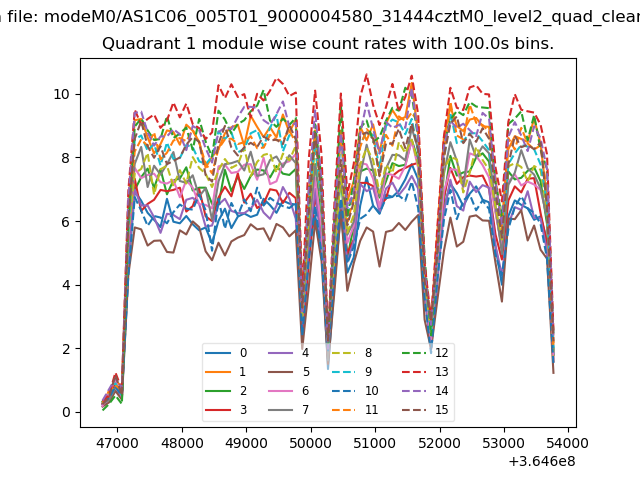
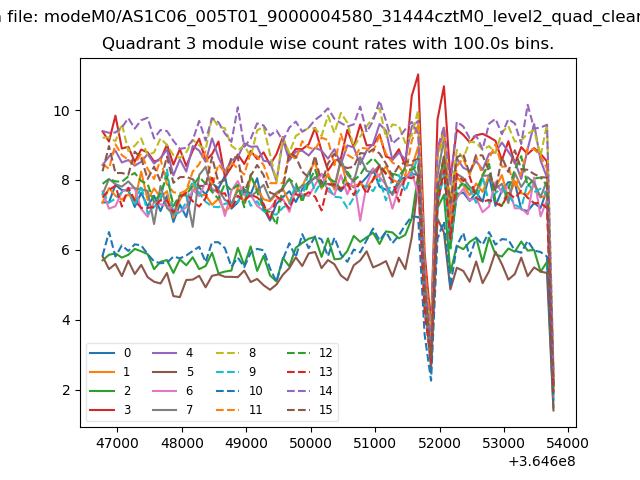
| Module-wise count rates for Quadrant A Data is divided into 100 sec bins |
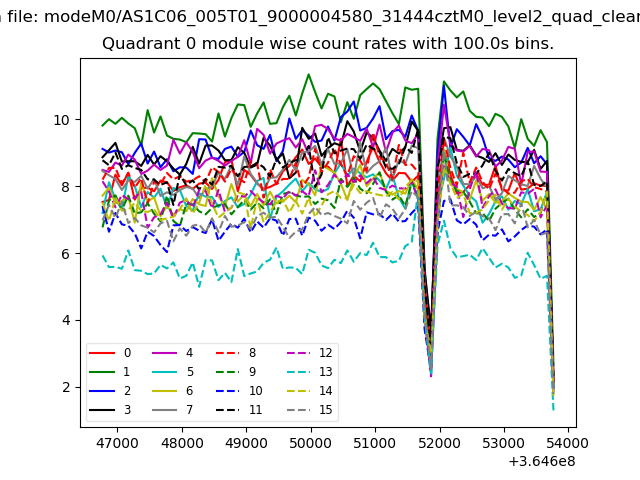 |
 |
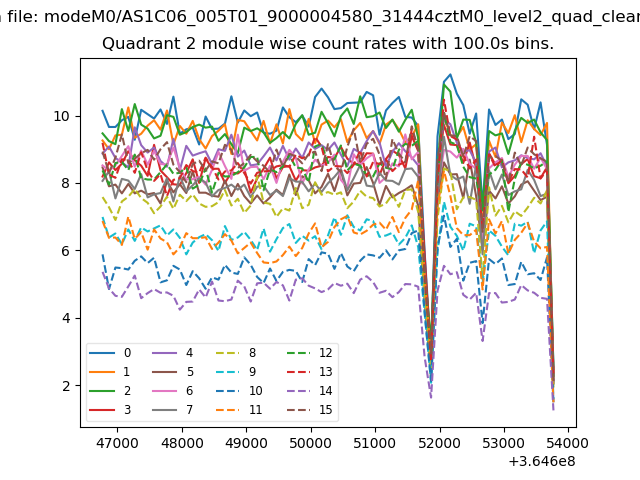
| Module-wise count rates for Quadrant B Data is divided into 100 sec bins |
 |
 |
| Module-wise count rates for Quadrant C Data is divided into 100 sec bins |
 |
 |
| Module-wise count rates for Quadrant D Data is divided into 100 sec bins |
 |
 |
| Parameter | Plot |
|---|---|
| CZT HV Monitor | 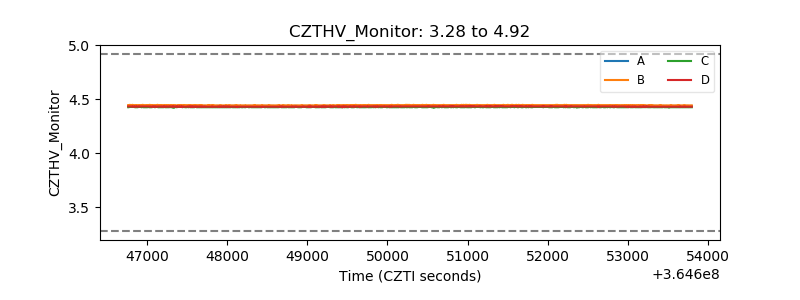 |
| D_VDD | 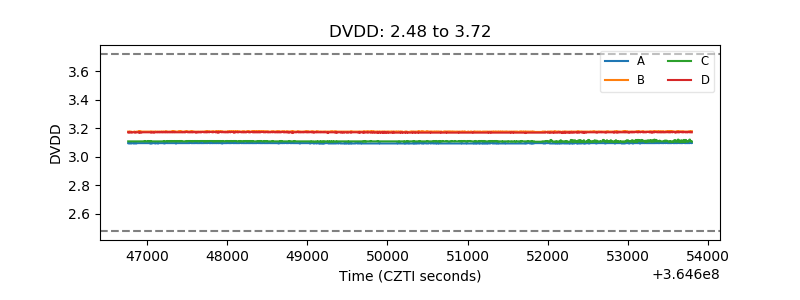 |
| Temperature 1 | 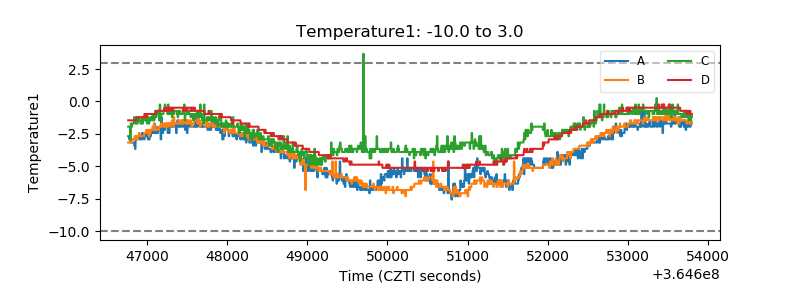 |
| Veto HV Monitor |  |
| Veto LLD | 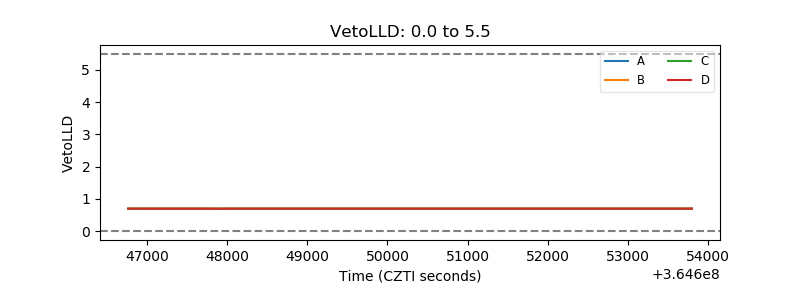 |
| Alpha Counter | 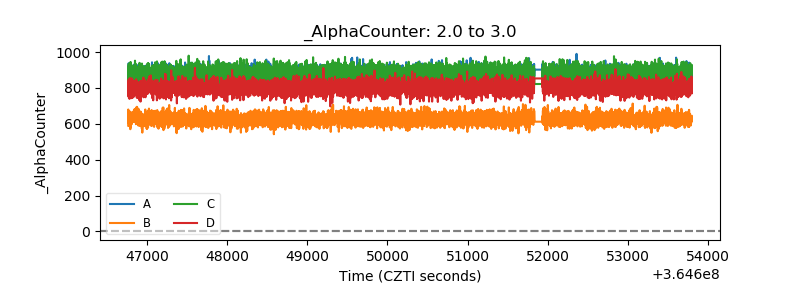 |
| _CPM_Rate | 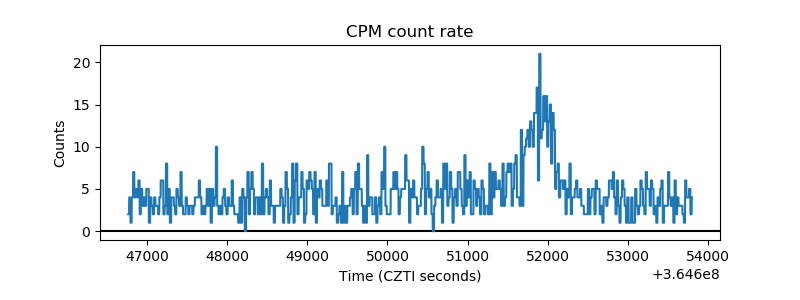 |
| CZT Counter | 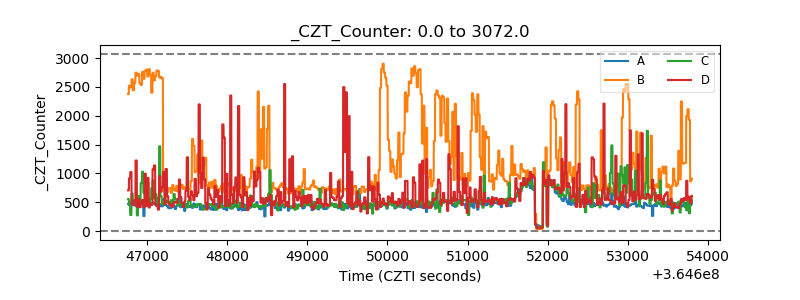 |
| +2.5 Volts monitor |  |
| +5 Volts monitor |  |
| _ROLL_ROT | 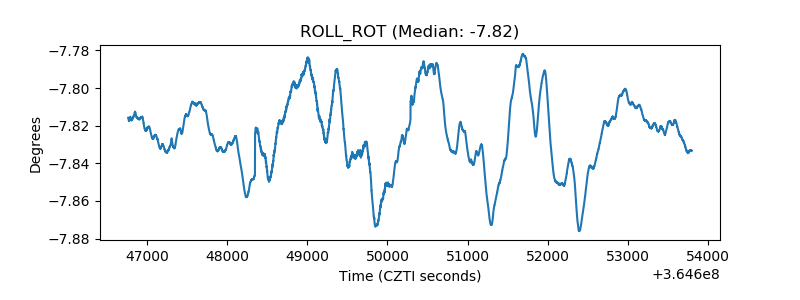 |
| _Roll_DEC | 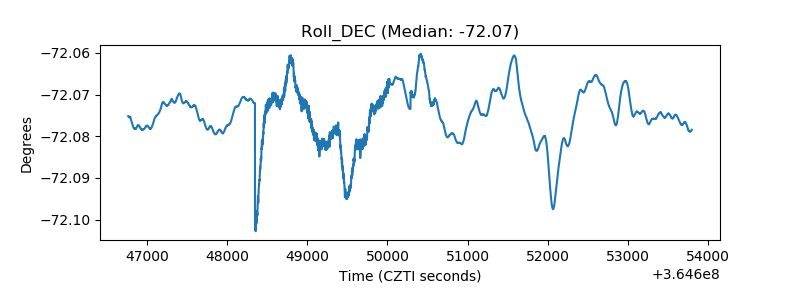 |
| _Roll_RA | 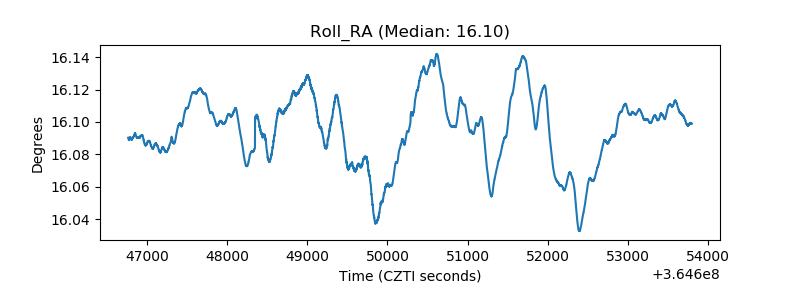 |
| Veto Counter | 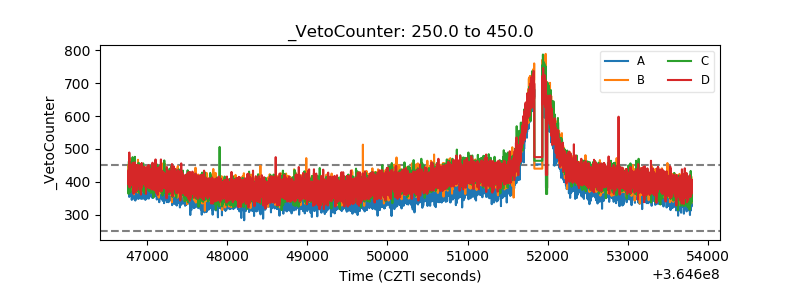 |