| Param | Original file | Final file |
|---|---|---|
| Filename | modeM0/AS1C06_005T01_9000004580_31445cztM0_level2.evt | modeM0/AS1C06_005T01_9000004580_31445cztM0_level2_quad_clean.evt |
| Size (bytes) | 703,546,560 | 139,020,480 |
| Size | 671.0 MB | 132.6 MB |
| Events in quadrant A | 3,486,250 | 953,461 |
| Events in quadrant B | 7,639,162 | 888,013 |
| Events in quadrant C | 4,906,160 | 925,881 |
| Events in quadrant D | 4,770,036 | 922,610 |
| Mode M0 | |||
|---|---|---|---|
| Quadrant | BADHDUFLAG | Total packets | Discarded packets |
| A | 0 | 15342 | 1 |
| B | 0 | 28162 | 1 |
| C | 0 | 19411 | 1 |
| D | 0 | 19074 | 1 |
| Mode M9 | |||
|---|---|---|---|
| Quadrant | BADHDUFLAG | Total packets | Discarded packets |
| A | 0 | 2 | 0 |
| B | 0 | 2 | 0 |
| C | 0 | 2 | 0 |
| D | 0 | 2 | 0 |
| Mode SS | |||
|---|---|---|---|
| Quadrant | BADHDUFLAG | Total packets | Discarded packets |
| A | 0 | 152 | 0 |
| B | 0 | 152 | 0 |
| C | 0 | 152 | 0 |
| D | 0 | 152 | 0 |
| Quadrant | Total seconds | Saturated seconds | Saturation percentage |
|---|---|---|---|
| A | 7469 | 151 | 2.021690% |
| B | 7469 | 1106 | 14.807873% |
| C | 7469 | 495 | 6.627393% |
| D | 7470 | 195 | 2.610442% |
Noise dominated data is calculated using 1-second bins in cleaned event files. If a bin has >2000 counts, and if more than 50% of those come from <1% of pixels, then it is considered to be noise-dominated and hence unusable.
| Quadrant | # 1 sec bins | Bins with >0 counts | Bins with >2000 counts | High rate bins dominated by noise | Noise dominated (total time) | Noise dominated (detector-on time) | Marked lightcurve |
|---|---|---|---|---|---|---|---|
| A | 7624 | 7470 | 0 | 0 | 0.00% | 0.00% |  |
| B | 7624 | 7469 | 703 | 703 | 9.22% | 9.41% | 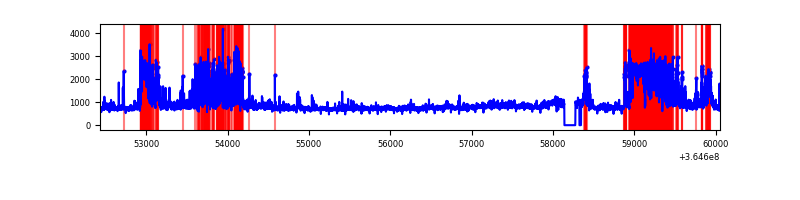 |
| C | 7624 | 7471 | 67 | 67 | 0.88% | 0.90% | 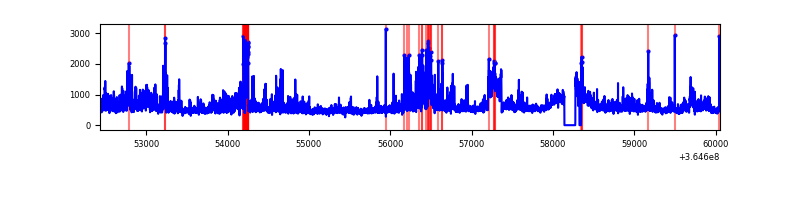 |
| D | 7625 | 7471 | 70 | 70 | 0.92% | 0.94% | 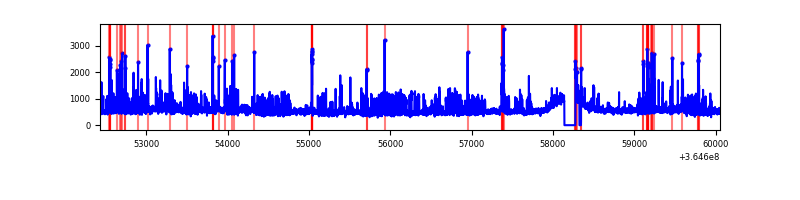 |
Top three noisy pixels from each quadrant. If the there are fewer than three noisy pixels in the level2.evt file, extra rows are filled as -1
| Pixel properties | Quadrant properties | ||||||
|---|---|---|---|---|---|---|---|
| Quadrant | DetID | PixID | Counts | Sigma | Mean | Median | Sigma |
| A | 13 | 254 | 15624 | 81.2 | 901 | 880 | 181.6 |
| A | 3 | 137 | 9376 | 46.79 | 901 | 880 | 181.6 |
| A | 0 | 226 | 7708 | 37.6 | 901 | 880 | 181.6 |
| B | 6 | 159 | 1984775 | 12384.01 | 840 | 818 | 160.2 |
| B | 12 | 1 | 1829037 | 11411.88 | 840 | 818 | 160.2 |
| B | 4 | 80 | 189868 | 1180.06 | 840 | 818 | 160.2 |
| C | 3 | 233 | 1207142 | 6068.88 | 854 | 859 | 198.8 |
| C | 14 | 238 | 180340 | 902.98 | 854 | 859 | 198.8 |
| C | 0 | 10 | 60015 | 297.61 | 854 | 859 | 198.8 |
| D | 8 | 195 | 838523 | 4046.01 | 878 | 854 | 207.0 |
| D | 12 | 233 | 177428 | 852.87 | 878 | 854 | 207.0 |
| D | 12 | 218 | 103860 | 497.53 | 878 | 854 | 207.0 |
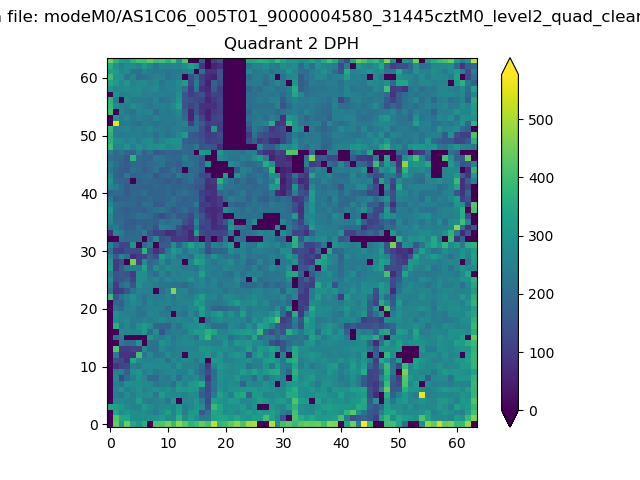
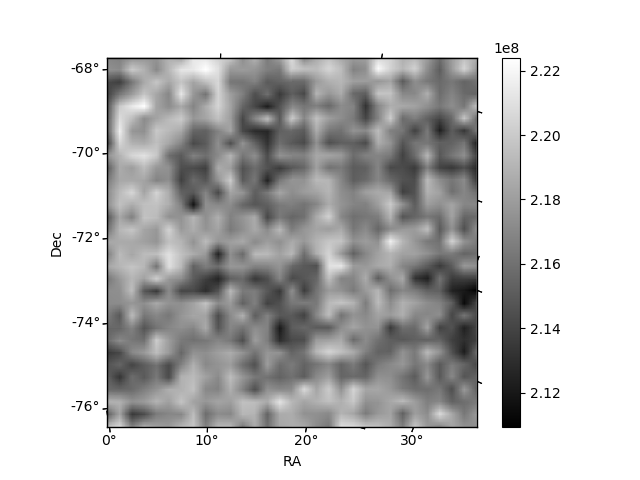
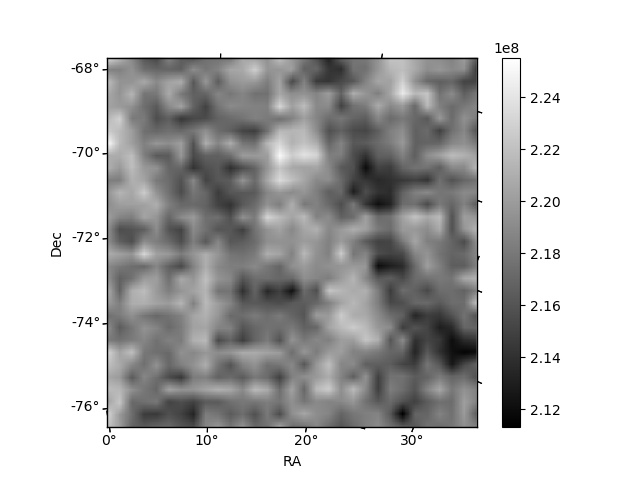
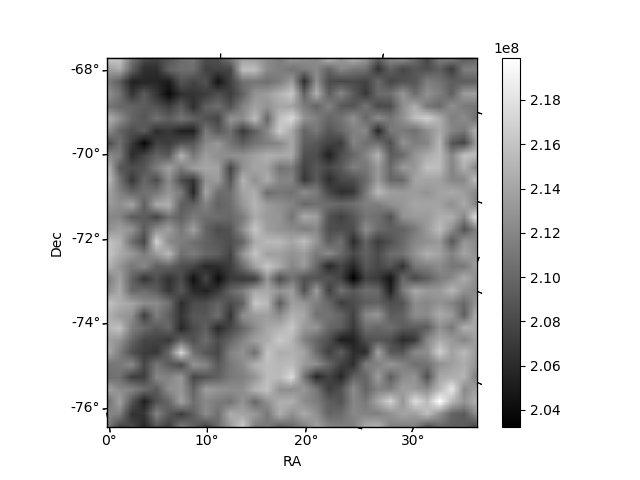
Histogram calculated using DETX and DETY for each event in the final _common_clean file
| Quadrant A | 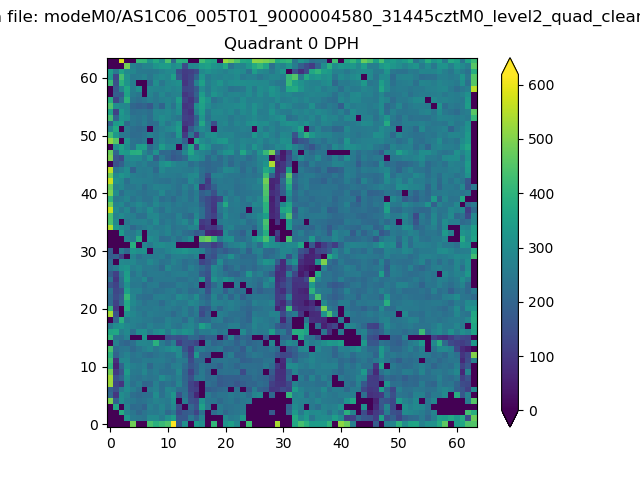 |
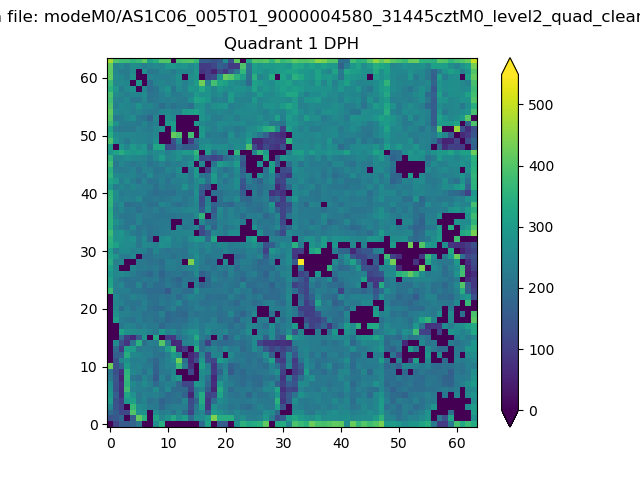 |
Quadrant B |
|---|---|---|---|
| Quadrant D | 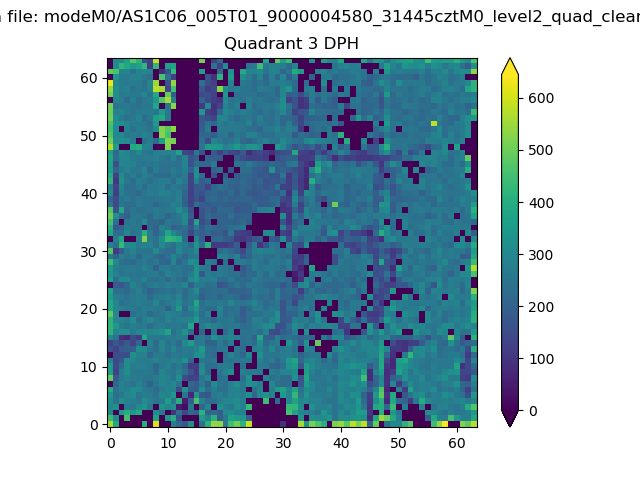 |
 |
Quadrant C |
| Plot type | Count rate plots | Images |
|---|---|---|
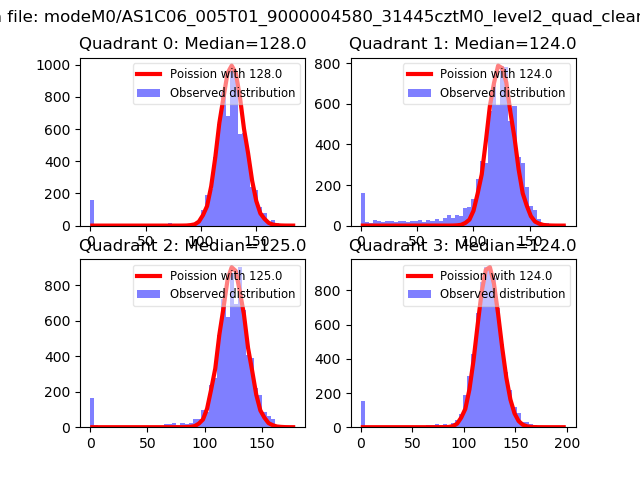
| Comparison with Poisson distribution Blue bars denote a histogram of data divided into 1 sec bins. Red curve is a Poisson curve with rate = median count rate of data. |
 |
 |
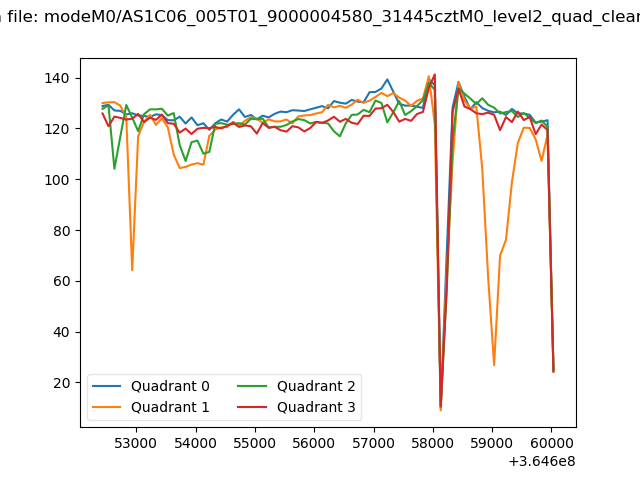
| Quadrant-wise count rates Data is divided into 100 sec bins |
 |
|
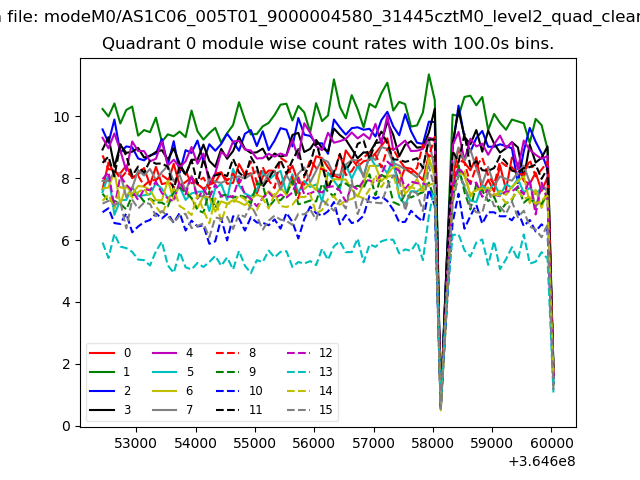
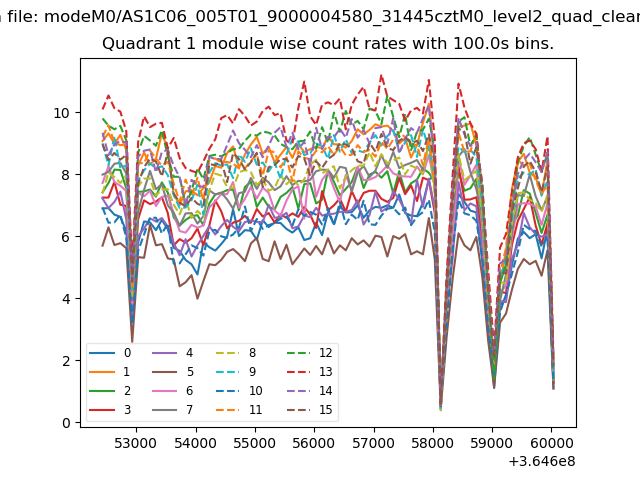
| Module-wise count rates for Quadrant A Data is divided into 100 sec bins |
 |
 |
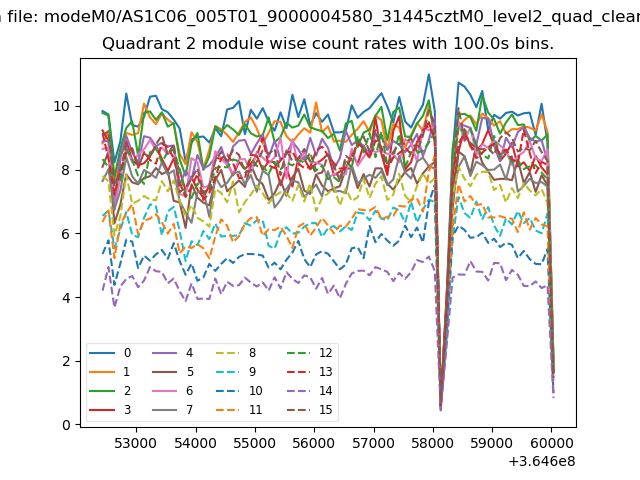
| Module-wise count rates for Quadrant B Data is divided into 100 sec bins |
 |
 |
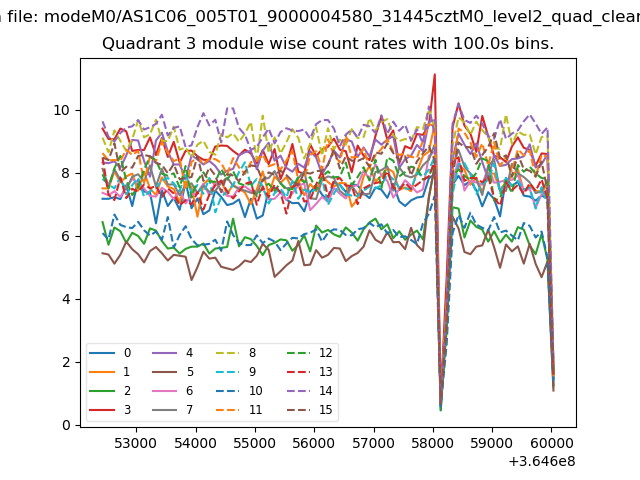
| Module-wise count rates for Quadrant C Data is divided into 100 sec bins |
 |
 |
| Module-wise count rates for Quadrant D Data is divided into 100 sec bins |
 |
 |
| Parameter | Plot |
|---|---|
| CZT HV Monitor | 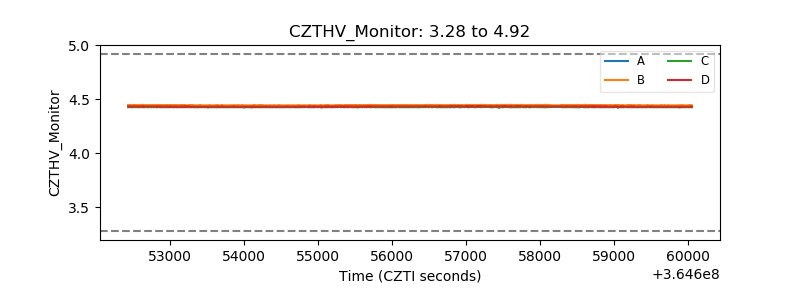 |
| D_VDD | 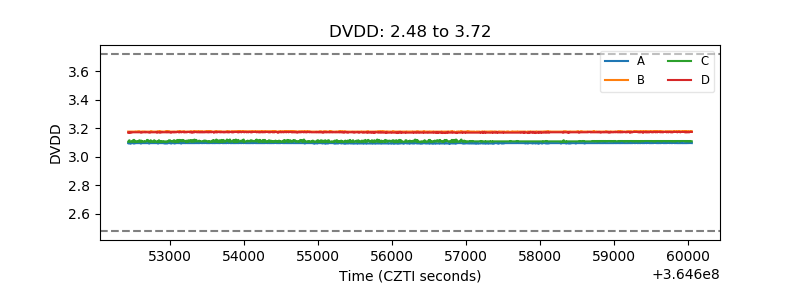 |
| Temperature 1 | 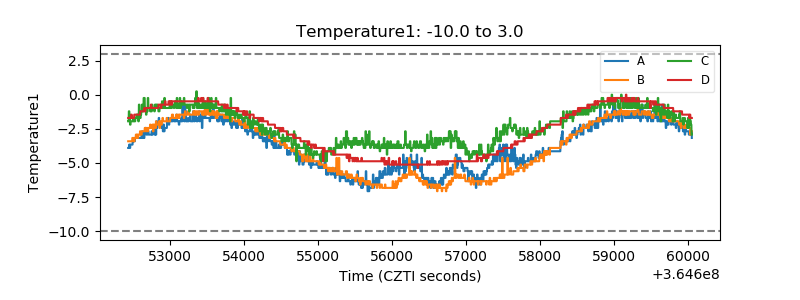 |
| Veto HV Monitor | 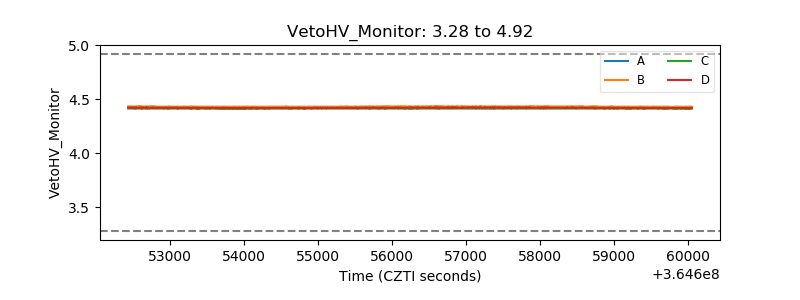 |
| Veto LLD | 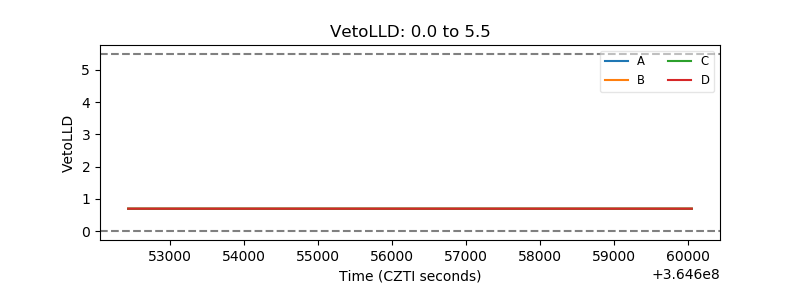 |
| Alpha Counter | 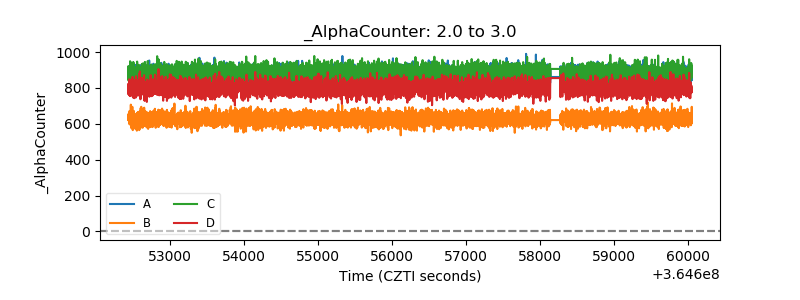 |
| _CPM_Rate | 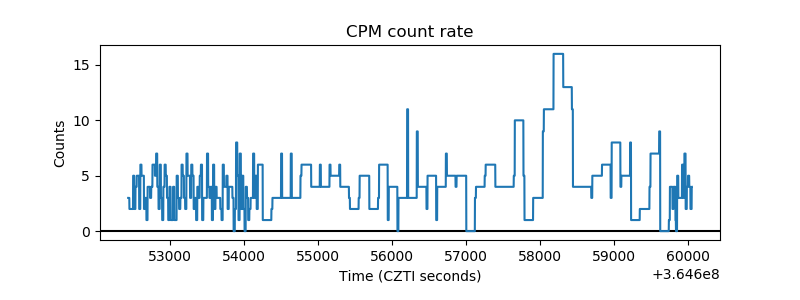 |
| CZT Counter | 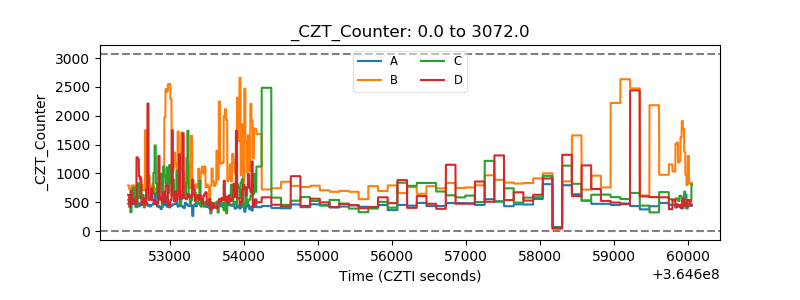 |
| +2.5 Volts monitor |  |
| +5 Volts monitor |  |
| _ROLL_ROT | 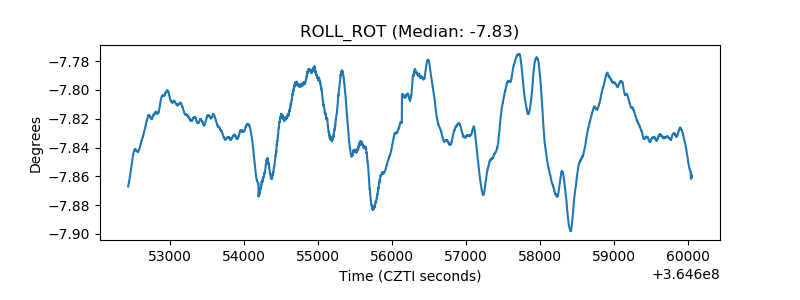 |
| _Roll_DEC | 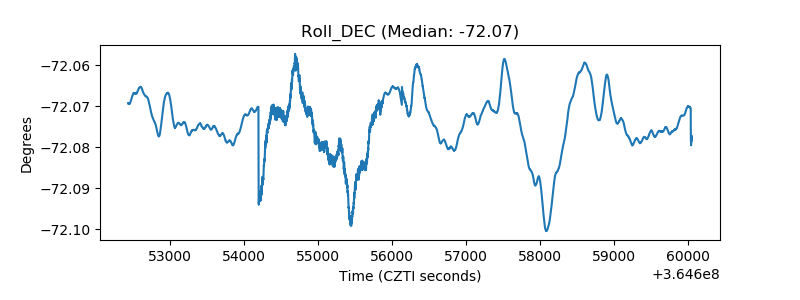 |
| _Roll_RA | 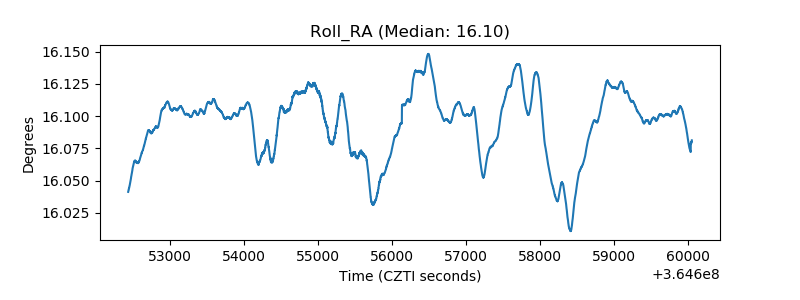 |
| Veto Counter | 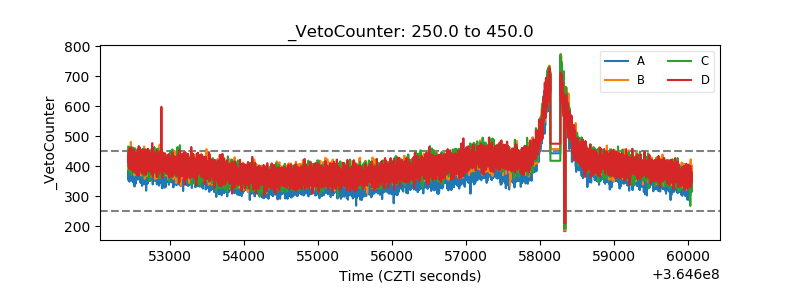 |