| Param | Original file | Final file |
|---|---|---|
| Filename | modeM0/AS1C06_005T01_9000004580_31448cztM0_level2.evt | modeM0/AS1C06_005T01_9000004580_31448cztM0_level2_quad_clean.evt |
| Size (bytes) | 1,245,461,760 | 249,799,680 |
| Size | 1.2 GB | 238.2 MB |
| Events in quadrant A | 6,202,084 | 1,732,897 |
| Events in quadrant B | 14,749,236 | 1,541,799 |
| Events in quadrant C | 7,349,606 | 1,686,765 |
| Events in quadrant D | 8,496,301 | 1,660,045 |
| Mode M0 | |||
|---|---|---|---|
| Quadrant | BADHDUFLAG | Total packets | Discarded packets |
| A | 0 | 27723 | 2 |
| B | 0 | 53920 | 2 |
| C | 0 | 30493 | 2 |
| D | 0 | 34275 | 2 |
| Mode M9 | |||
|---|---|---|---|
| Quadrant | BADHDUFLAG | Total packets | Discarded packets |
| A | 0 | 10 | 0 |
| B | 0 | 10 | 0 |
| C | 0 | 10 | 0 |
| D | 0 | 10 | 0 |
| Mode SS | |||
|---|---|---|---|
| Quadrant | BADHDUFLAG | Total packets | Discarded packets |
| A | 0 | 278 | 0 |
| B | 0 | 278 | 0 |
| C | 0 | 278 | 0 |
| D | 0 | 278 | 0 |
| Quadrant | Total seconds | Saturated seconds | Saturation percentage |
|---|---|---|---|
| A | 13661 | 122 | 0.893053% |
| B | 13662 | 2352 | 17.215635% |
| C | 13662 | 425 | 3.110818% |
| D | 13662 | 312 | 2.283707% |
Noise dominated data is calculated using 1-second bins in cleaned event files. If a bin has >2000 counts, and if more than 50% of those come from <1% of pixels, then it is considered to be noise-dominated and hence unusable.
| Quadrant | # 1 sec bins | Bins with >0 counts | Bins with >2000 counts | High rate bins dominated by noise | Noise dominated (total time) | Noise dominated (detector-on time) | Marked lightcurve |
|---|---|---|---|---|---|---|---|
| A | 14626 | 13661 | 0 | 0 | 0.00% | 0.00% | 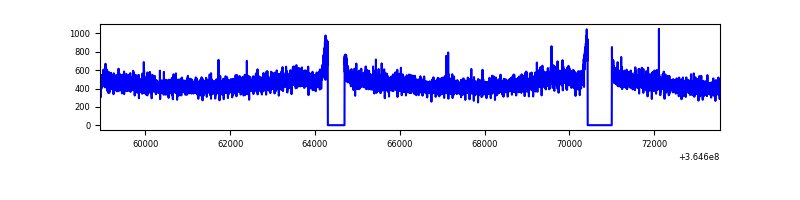 |
| B | 14627 | 13662 | 1860 | 1860 | 12.72% | 13.61% |  |
| C | 14627 | 13662 | 51 | 51 | 0.35% | 0.37% | 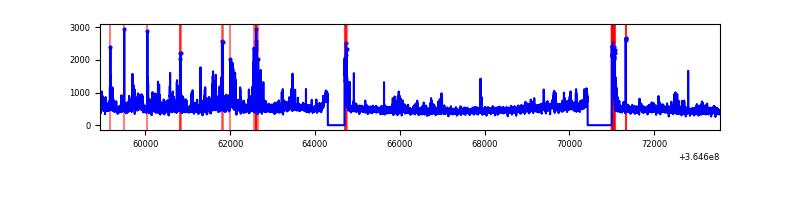 |
| D | 14627 | 13662 | 211 | 211 | 1.44% | 1.54% | 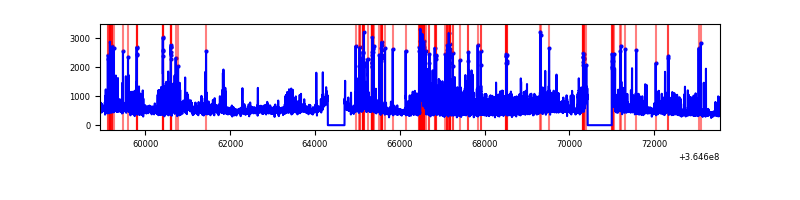 |
Top three noisy pixels from each quadrant. If the there are fewer than three noisy pixels in the level2.evt file, extra rows are filled as -1
| Pixel properties | Quadrant properties | ||||||
|---|---|---|---|---|---|---|---|
| Quadrant | DetID | PixID | Counts | Sigma | Mean | Median | Sigma |
| A | 13 | 254 | 29123 | 86.24 | 1605 | 1574 | 319.4 |
| A | 3 | 137 | 16424 | 46.49 | 1605 | 1574 | 319.4 |
| A | 0 | 226 | 13559 | 37.52 | 1605 | 1574 | 319.4 |
| B | 12 | 1 | 4395380 | 15809.32 | 1452 | 1413 | 277.9 |
| B | 6 | 159 | 3614907 | 13001.21 | 1452 | 1413 | 277.9 |
| B | 5 | 172 | 440514 | 1579.87 | 1452 | 1413 | 277.9 |
| C | 3 | 233 | 742228 | 2088.03 | 1532 | 1543 | 354.7 |
| C | 14 | 238 | 295349 | 828.26 | 1532 | 1543 | 354.7 |
| C | 0 | 10 | 212580 | 594.93 | 1532 | 1543 | 354.7 |
| D | 8 | 195 | 1547544 | 4176.51 | 1553 | 1509 | 370.2 |
| D | 12 | 218 | 398434 | 1072.27 | 1553 | 1509 | 370.2 |
| D | 13 | 249 | 175117 | 468.99 | 1553 | 1509 | 370.2 |
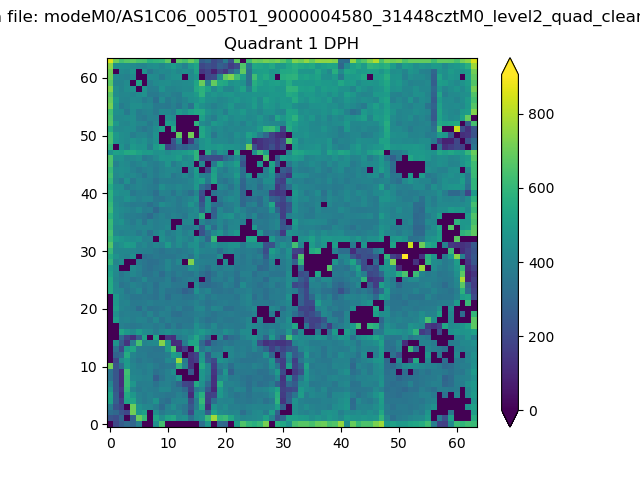
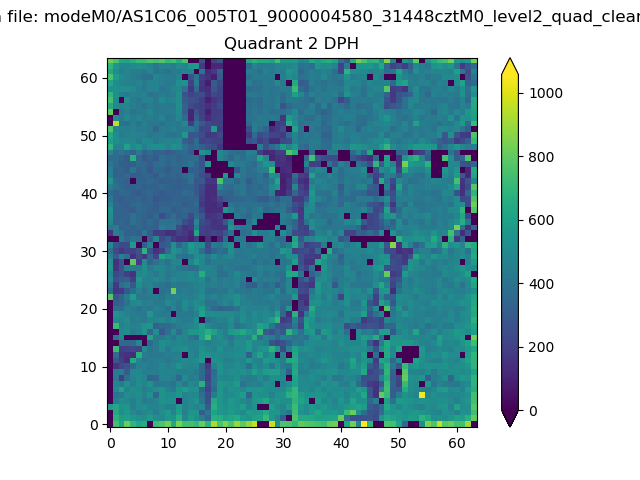
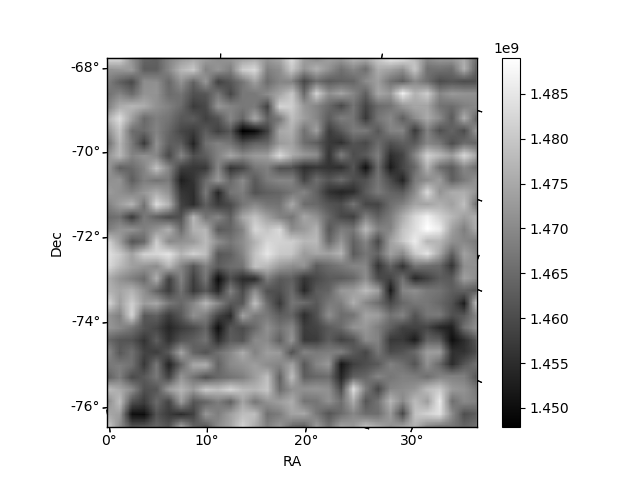
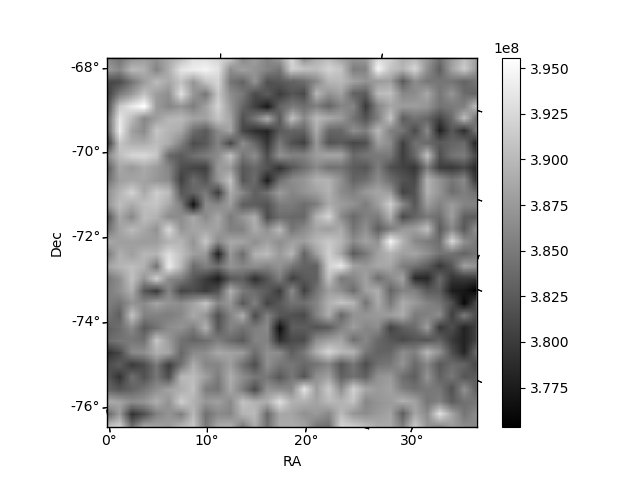
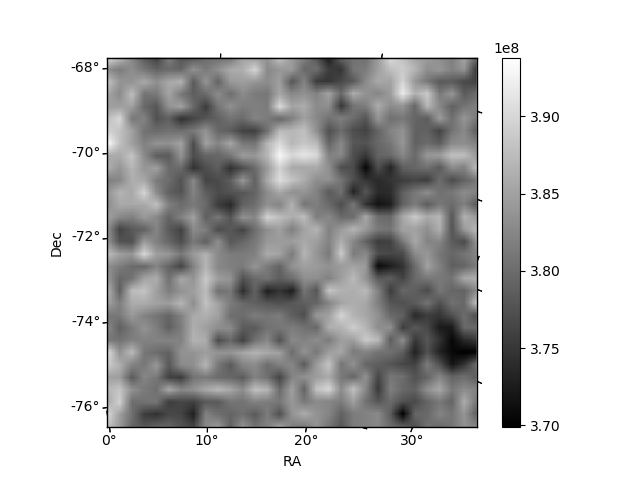
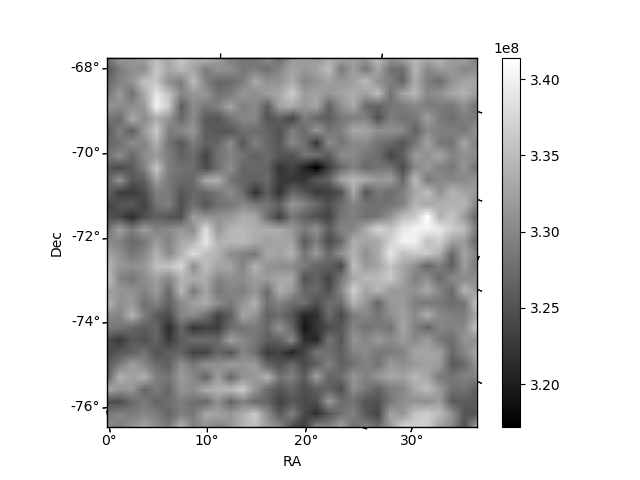
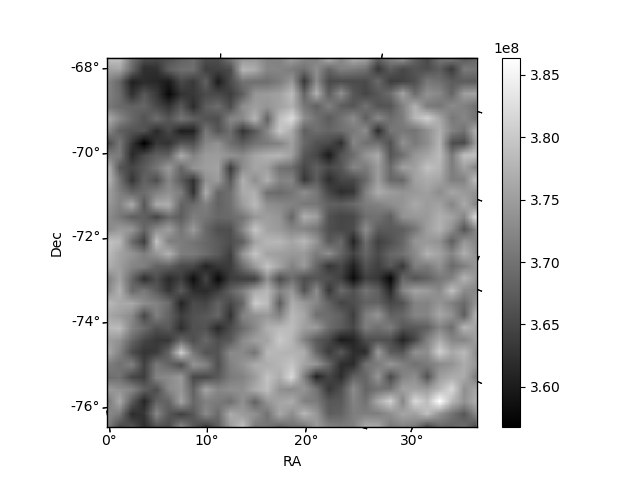
Histogram calculated using DETX and DETY for each event in the final _common_clean file
| Quadrant A | 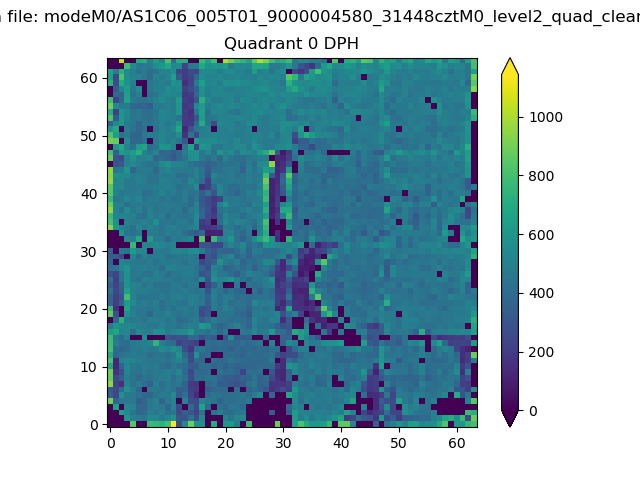 |
 |
Quadrant B |
|---|---|---|---|
| Quadrant D | 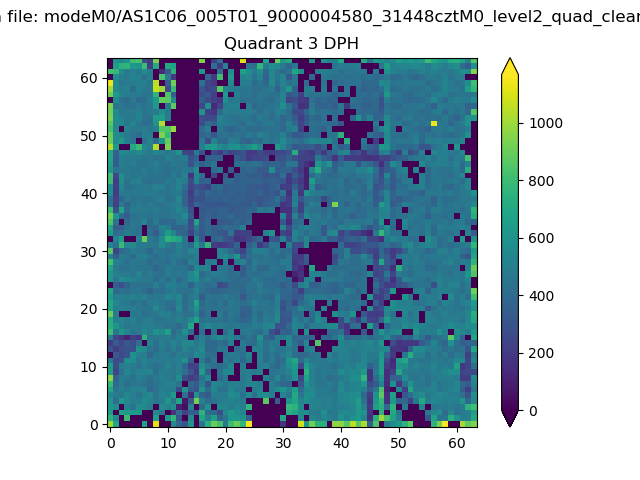 |
 |
Quadrant C |
| Plot type | Count rate plots | Images |
|---|---|---|
| Comparison with Poisson distribution Blue bars denote a histogram of data divided into 1 sec bins. Red curve is a Poisson curve with rate = median count rate of data. |
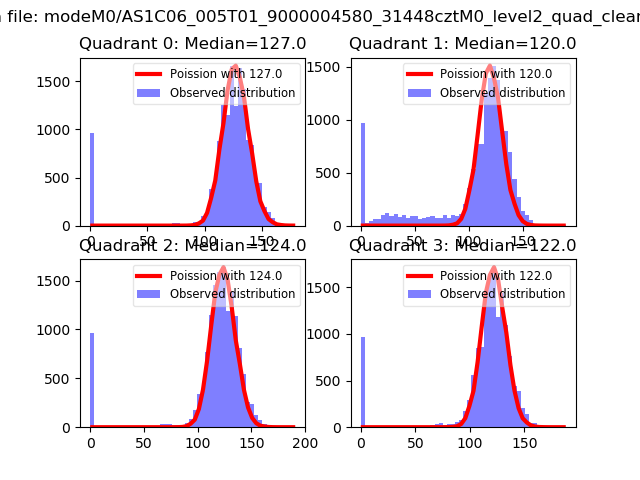 |
 |
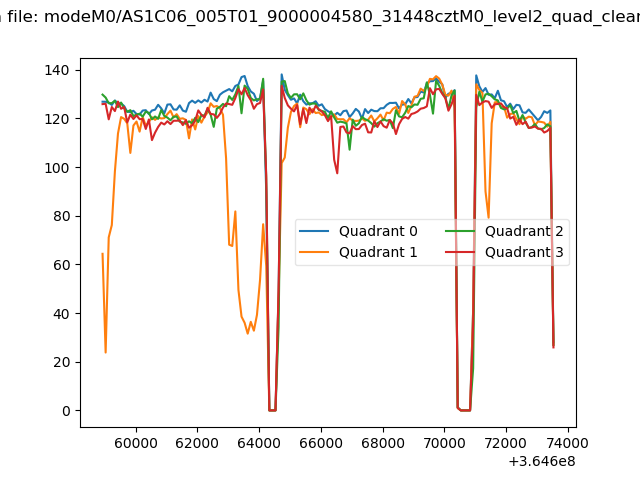
| Quadrant-wise count rates Data is divided into 100 sec bins |
 |
|
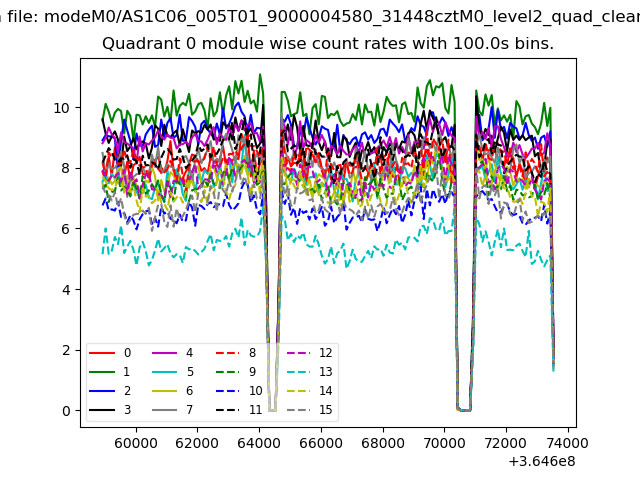
| Module-wise count rates for Quadrant A Data is divided into 100 sec bins |
 |
 |
| Module-wise count rates for Quadrant B Data is divided into 100 sec bins |
 |
 |
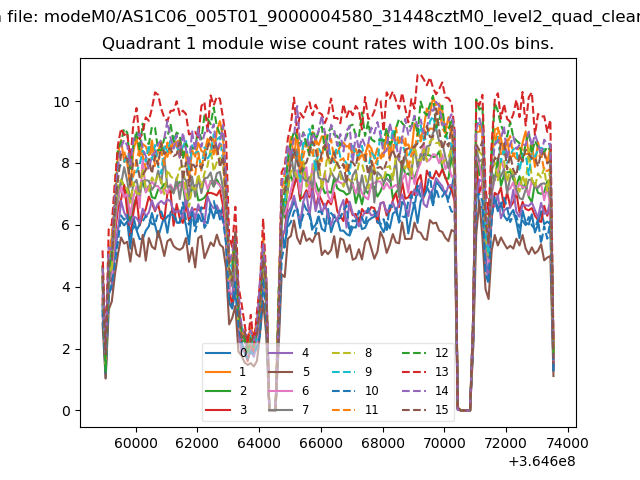
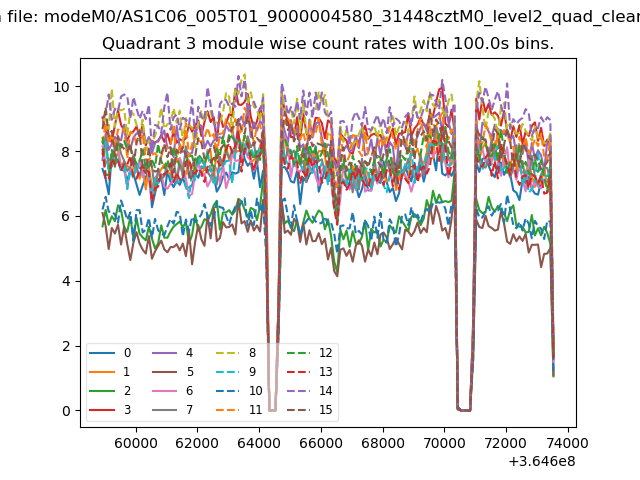
| Module-wise count rates for Quadrant C Data is divided into 100 sec bins |
 |
 |
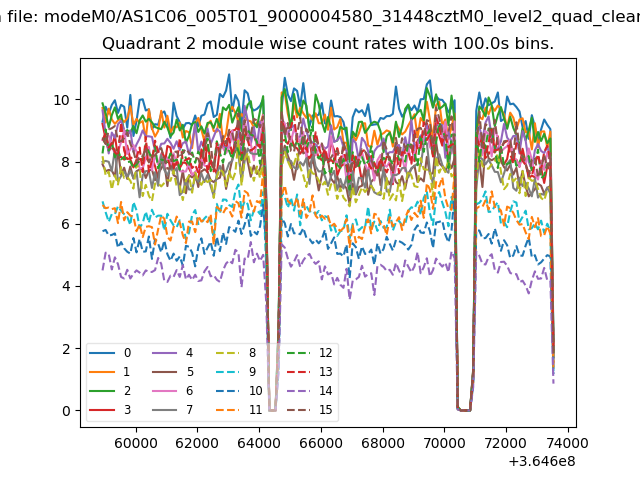
| Module-wise count rates for Quadrant D Data is divided into 100 sec bins |
 |
 |
| Parameter | Plot |
|---|---|
| CZT HV Monitor | 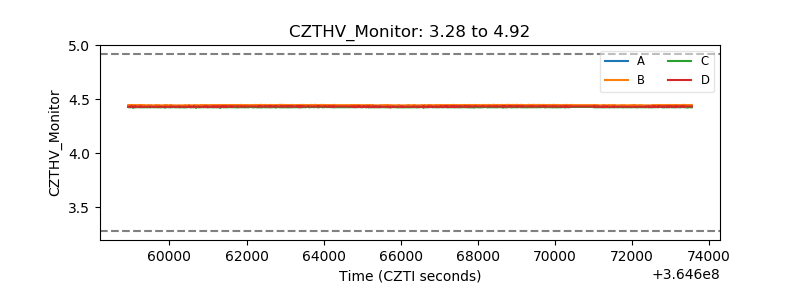 |
| D_VDD |  |
| Temperature 1 | 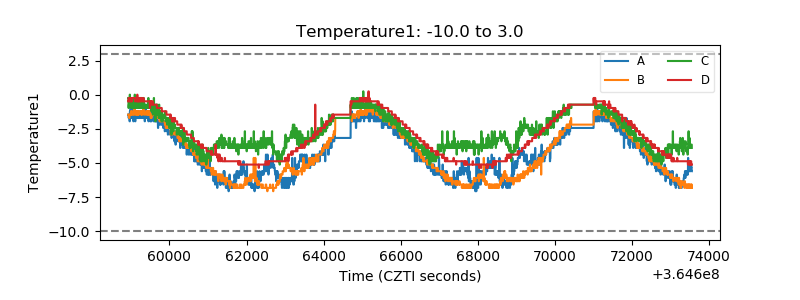 |
| Veto HV Monitor | 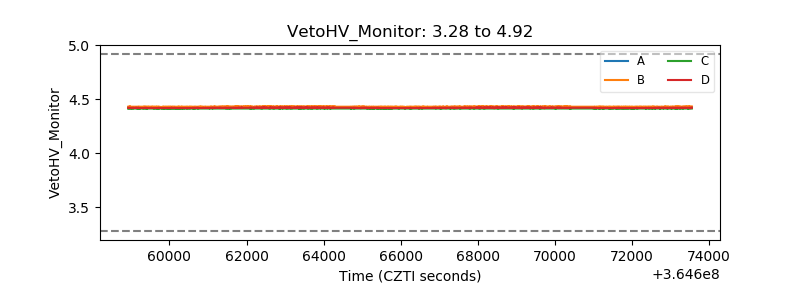 |
| Veto LLD | 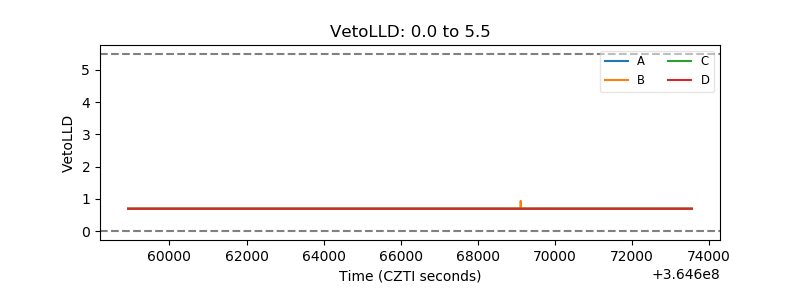 |
| Alpha Counter | 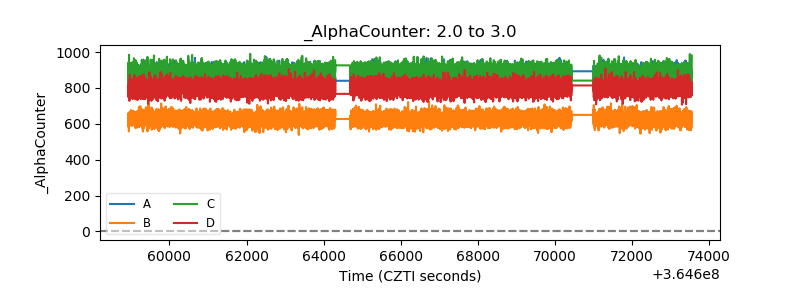 |
| _CPM_Rate | 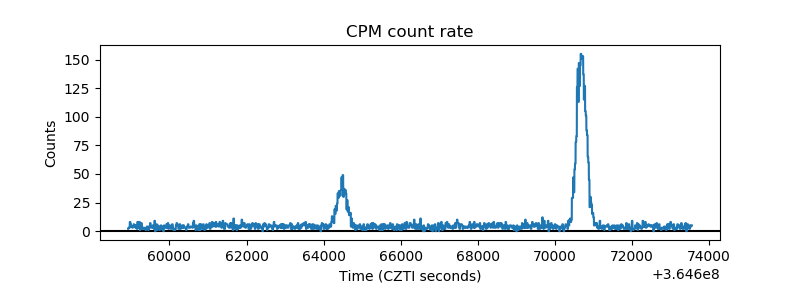 |
| CZT Counter | 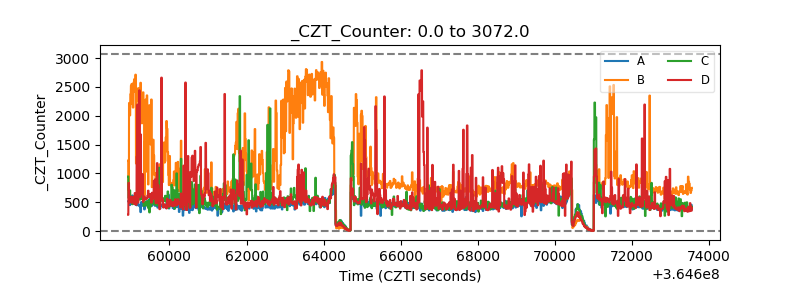 |
| +2.5 Volts monitor |  |
| +5 Volts monitor |  |
| _ROLL_ROT | 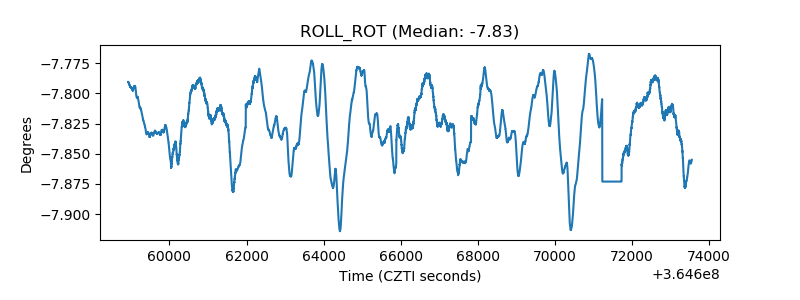 |
| _Roll_DEC | 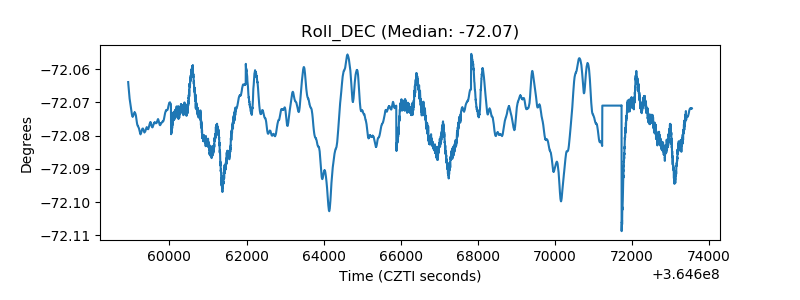 |
| _Roll_RA | 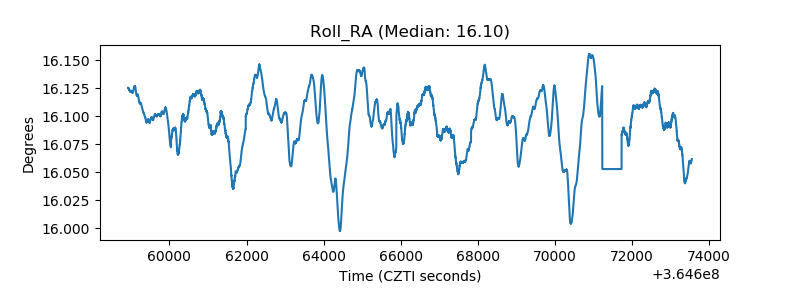 |
| Veto Counter | 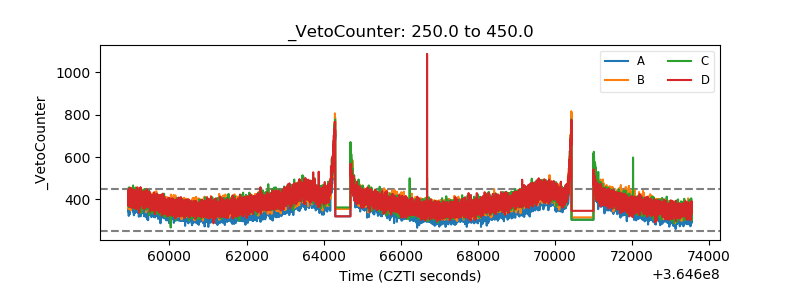 |