| Param | Original file | Final file |
|---|---|---|
| Filename | modeM0/AS1T04_029T01_9000004582cztM0_level2.fits | modeM0/AS1T04_029T01_9000004582cztM0_level2_quad_clean.evt |
| Size (bytes) | 1,354,037,760 | 970,718,400 |
| Size | 1.3 GB | 925.7 MB |
| Events in quadrant A | 8,568,412 | 5,400,900 |
| Events in quadrant B | 7,887,930 | 5,049,828 |
| Events in quadrant C | 8,092,632 | 5,065,770 |
| Events in quadrant D | 7,230,264 | 4,653,732 |
| Mode SS | |||
|---|---|---|---|
| Quadrant | BADHDUFLAG | Total packets | Discarded packets |
| A | 0 | 2726 | 0 |
| B | 0 | 2730 | 0 |
| C | 0 | 2742 | 0 |
| D | 0 | 2740 | 0 |
| Mode M9 | |||
|---|---|---|---|
| Quadrant | BADHDUFLAG | Total packets | Discarded packets |
| A | 0 | 221 | 0 |
| B | 0 | 221 | 0 |
| C | 0 | 221 | 0 |
| D | 0 | 221 | 0 |
| Mode M0 | |||
|---|---|---|---|
| Quadrant | BADHDUFLAG | Total packets | Discarded packets |
| A | 0 | 279895 | 0 |
| B | 0 | 431311 | 0 |
| C | 0 | 311292 | 0 |
| D | 0 | 318672 | 0 |
| Quadrant | Total seconds | Saturated seconds | Saturation percentage |
|---|---|---|---|
| A | 134754 | 1847 | 1.370646% |
| B | 134342 | 7019 | 5.224725% |
| C | 134720 | 5217 | 3.872476% |
| D | 134699 | 2428 | 1.802538% |
Noise dominated data is calculated using 1-second bins in cleaned event files. If a bin has >2000 counts, and if more than 50% of those come from <1% of pixels, then it is considered to be noise-dominated and hence unusable.
| Quadrant | # 1 sec bins | Bins with >0 counts | Bins with >2000 counts | High rate bins dominated by noise | Noise dominated (total time) | Noise dominated (detector-on time) | Marked lightcurve |
|---|---|---|---|---|---|---|---|
| A | 161551 | 135352 | 0 | 0 | 0.00% | 0.00% |  |
| B | 161551 | 134834 | 0 | 0 | 0.00% | 0.00% |  |
| C | 161551 | 135323 | 0 | 0 | 0.00% | 0.00% | 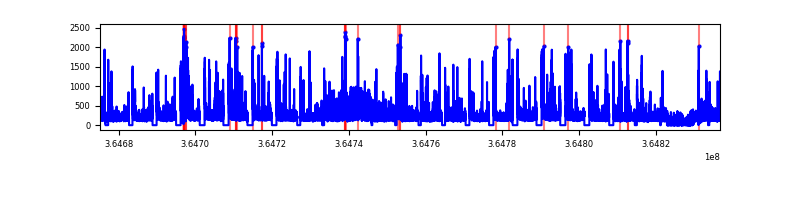 |
| D | 161551 | 135262 | 0 | 0 | 0.00% | 0.00% |  |
Top three noisy pixels from each quadrant. If the there are fewer than three noisy pixels in the level2.evt file, extra rows are filled as -1
| Pixel properties | Quadrant properties | ||||||
|---|---|---|---|---|---|---|---|
| Quadrant | DetID | PixID | Counts | Sigma | Mean | Median | Sigma |
| A | 0 | 29 | 8390 | 11.63 | 2229 | 2094 | 541.5 |
| A | 7 | 110 | 6767 | 8.63 | 2229 | 2094 | 541.5 |
| A | 0 | 30 | 6581 | 8.29 | 2229 | 2094 | 541.5 |
| B | 2 | 9 | 6266 | 10.41 | 2084 | 1992 | 410.7 |
| B | 2 | 8 | 5292 | 8.04 | 2084 | 1992 | 410.7 |
| B | 3 | 80 | 5200 | 7.81 | 2084 | 1992 | 410.7 |
| C | 1 | 80 | 6134 | 7.58 | 2142 | 2002 | 545.1 |
| C | 1 | 81 | 6129 | 7.57 | 2142 | 2002 | 545.1 |
| C | 12 | 241 | 5628 | 6.65 | 2142 | 2002 | 545.1 |
| D | 3 | 14 | 5153 | 6.09 | 2063 | 1882 | 537.5 |
| D | 7 | 3 | 5087 | 5.96 | 2063 | 1882 | 537.5 |
| D | 6 | 231 | 5081 | 5.95 | 2063 | 1882 | 537.5 |
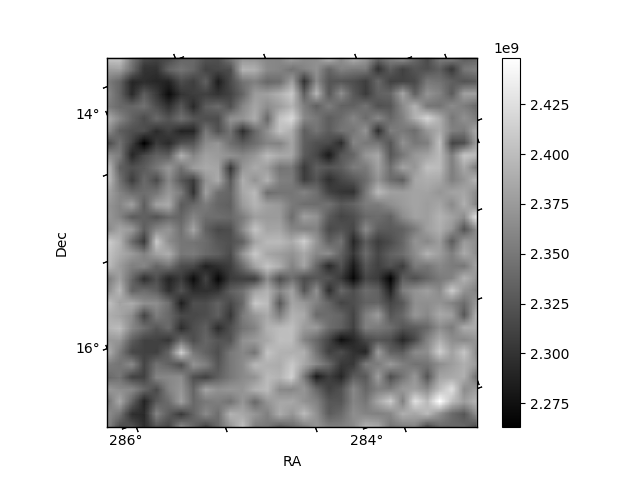
Histogram calculated using DETX and DETY for each event in the final _common_clean file
| Quadrant A | 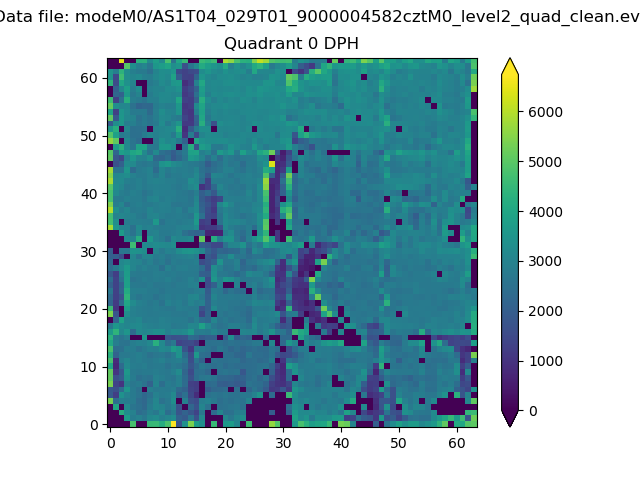 |
 |
Quadrant B |
|---|---|---|---|
| Quadrant D |  |
 |
Quadrant C |
| Plot type | Count rate plots | Images |
|---|---|---|
| Comparison with Poisson distribution Blue bars denote a histogram of data divided into 1 sec bins. Red curve is a Poisson curve with rate = median count rate of data. |
 |
 |
| Quadrant-wise count rates Data is divided into 100 sec bins |
 |
|
| Module-wise count rates for Quadrant A Data is divided into 100 sec bins |
 |
 |
| Module-wise count rates for Quadrant B Data is divided into 100 sec bins |
 |
 |
| Module-wise count rates for Quadrant C Data is divided into 100 sec bins |
 |
 |
| Module-wise count rates for Quadrant D Data is divided into 100 sec bins |
 |
 |
| Parameter | Plot |
|---|---|
| CZT HV Monitor | 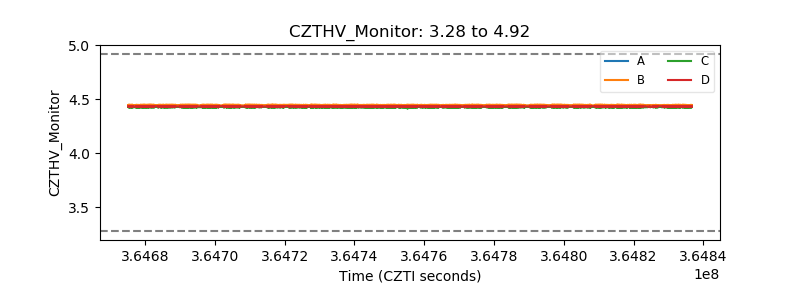 |
| D_VDD |  |
| Temperature 1 |  |
| Veto HV Monitor |  |
| Veto LLD | 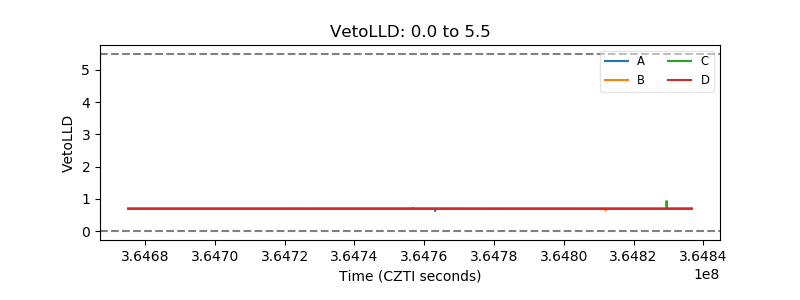 |
| Alpha Counter |  |
| _CPM_Rate |  |
| CZT Counter |  |
| +2.5 Volts monitor |  |
| +5 Volts monitor |  |
| _ROLL_ROT |  |
| _Roll_DEC |  |
| _Roll_RA | 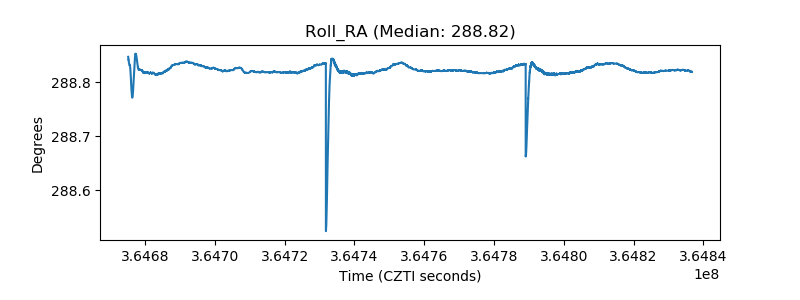 |
| Veto Counter |  |