| Param | Original file | Final file |
|---|---|---|
| Filename | modeM0/AS1T04_029T01_9000004582_31448cztM0_level2.evt | modeM0/AS1T04_029T01_9000004582_31448cztM0_level2_quad_clean.evt |
| Size (bytes) | 271,540,800 | 34,911,360 |
| Size | 259.0 MB | 33.3 MB |
| Events in quadrant A | 1,524,569 | 217,725 |
| Events in quadrant B | 2,377,434 | 217,753 |
| Events in quadrant C | 1,679,066 | 205,166 |
| Events in quadrant D | 2,438,121 | 202,990 |
| Mode SS | |||
|---|---|---|---|
| Quadrant | BADHDUFLAG | Total packets | Discarded packets |
| A | 0 | 62 | 0 |
| B | 0 | 62 | 0 |
| C | 0 | 62 | 0 |
| D | 0 | 62 | 0 |
| Mode M9 | |||
|---|---|---|---|
| Quadrant | BADHDUFLAG | Total packets | Discarded packets |
| A | 0 | 7 | 0 |
| B | 0 | 7 | 0 |
| C | 0 | 7 | 0 |
| D | 0 | 7 | 0 |
| Mode M0 | |||
|---|---|---|---|
| Quadrant | BADHDUFLAG | Total packets | Discarded packets |
| A | 0 | 6268 | 1 |
| B | 0 | 9168 | 1 |
| C | 0 | 6756 | 2 |
| D | 0 | 9142 | 1 |
| Quadrant | Total seconds | Saturated seconds | Saturation percentage |
|---|---|---|---|
| A | 2989 | 46 | 1.538976% |
| B | 2989 | 108 | 3.613249% |
| C | 2988 | 196 | 6.559572% |
| D | 2988 | 227 | 7.597055% |
Noise dominated data is calculated using 1-second bins in cleaned event files. If a bin has >2000 counts, and if more than 50% of those come from <1% of pixels, then it is considered to be noise-dominated and hence unusable.
| Quadrant | # 1 sec bins | Bins with >0 counts | Bins with >2000 counts | High rate bins dominated by noise | Noise dominated (total time) | Noise dominated (detector-on time) | Marked lightcurve |
|---|---|---|---|---|---|---|---|
| A | 3714 | 2989 | 0 | 0 | 0.00% | 0.00% | 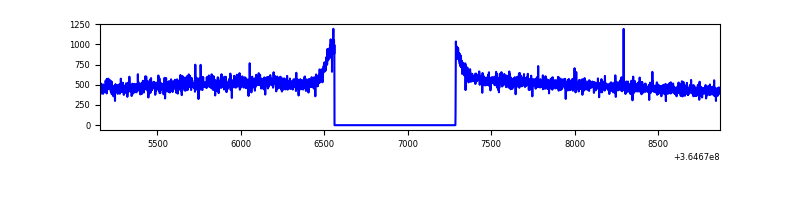 |
| B | 3714 | 2989 | 2 | 2 | 0.05% | 0.07% | 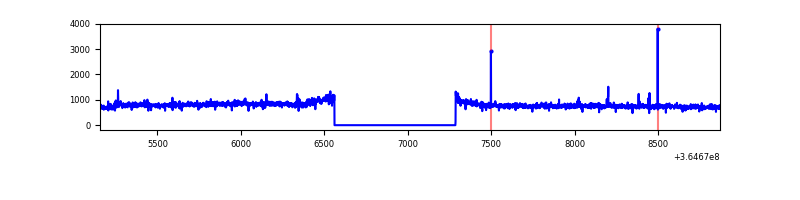 |
| C | 3713 | 2988 | 13 | 13 | 0.35% | 0.44% | 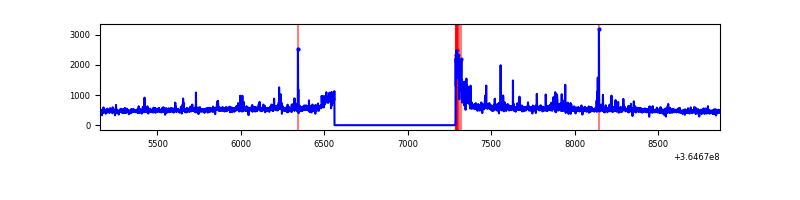 |
| D | 3713 | 2988 | 174 | 174 | 4.69% | 5.82% | 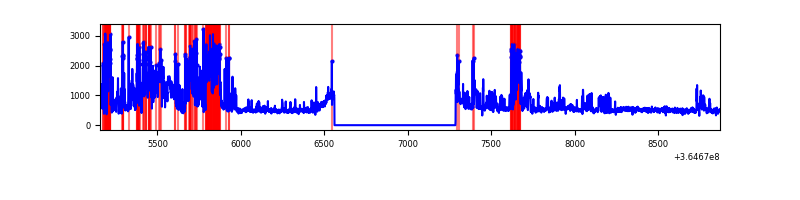 |
Top three noisy pixels from each quadrant. If the there are fewer than three noisy pixels in the level2.evt file, extra rows are filled as -1
| Pixel properties | Quadrant properties | ||||||
|---|---|---|---|---|---|---|---|
| Quadrant | DetID | PixID | Counts | Sigma | Mean | Median | Sigma |
| A | 13 | 254 | 5307 | 60.65 | 395 | 386 | 81.1 |
| A | 3 | 137 | 4330 | 48.61 | 395 | 386 | 81.1 |
| A | 0 | 226 | 3340 | 36.41 | 395 | 386 | 81.1 |
| B | 6 | 159 | 783427 | 10155.42 | 387 | 376 | 77.1 |
| B | 4 | 80 | 26999 | 345.27 | 387 | 376 | 77.1 |
| B | 0 | 190 | 19717 | 250.83 | 387 | 376 | 77.1 |
| C | 0 | 10 | 88777 | 991.75 | 370 | 371 | 89.1 |
| C | 14 | 238 | 77564 | 865.96 | 370 | 371 | 89.1 |
| C | 14 | 254 | 26969 | 298.38 | 370 | 371 | 89.1 |
| D | 12 | 218 | 650326 | 7062.32 | 377 | 368 | 92.0 |
| D | 8 | 195 | 211434 | 2293.4 | 377 | 368 | 92.0 |
| D | 5 | 233 | 99471 | 1076.84 | 377 | 368 | 92.0 |
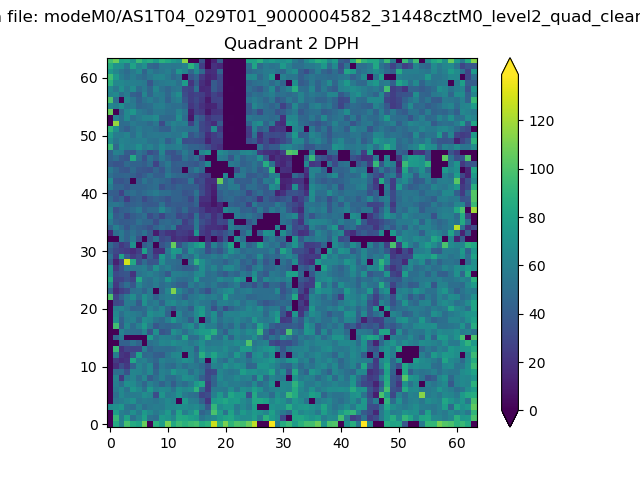
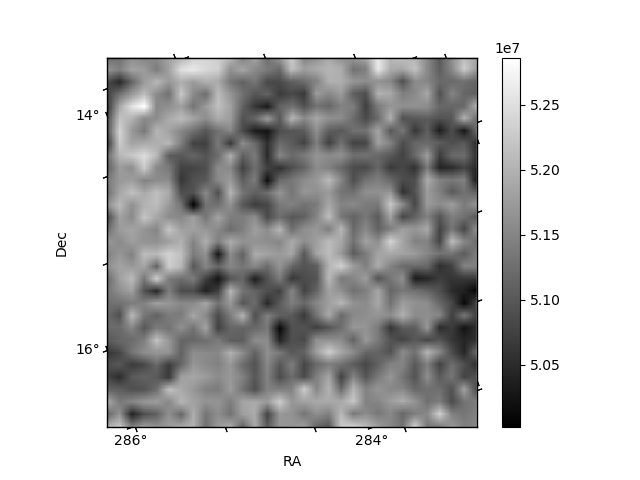
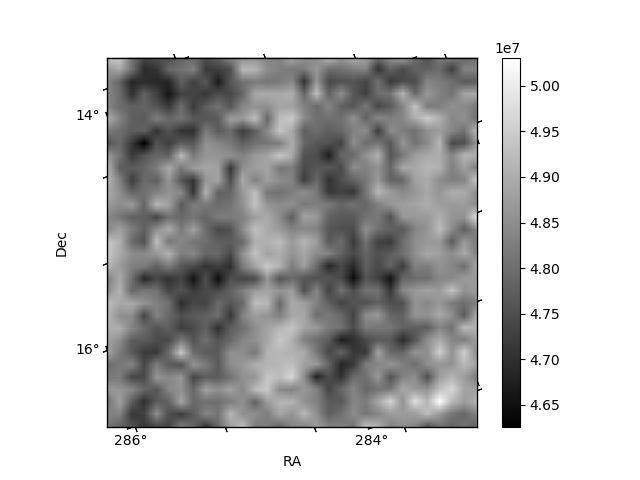
Histogram calculated using DETX and DETY for each event in the final _common_clean file
| Quadrant A |  |
 |
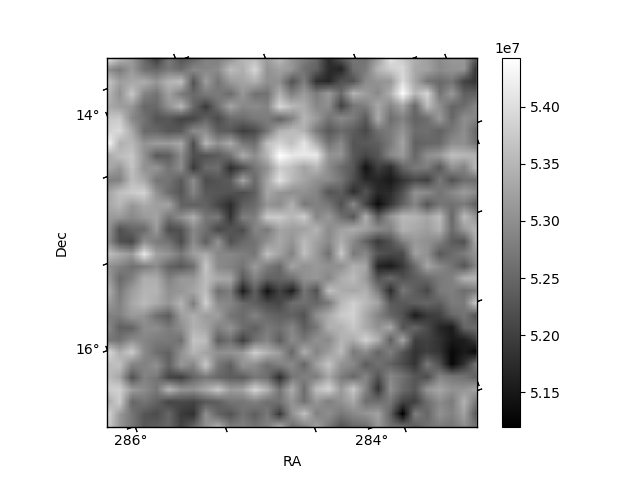
Quadrant B |
|---|---|---|---|
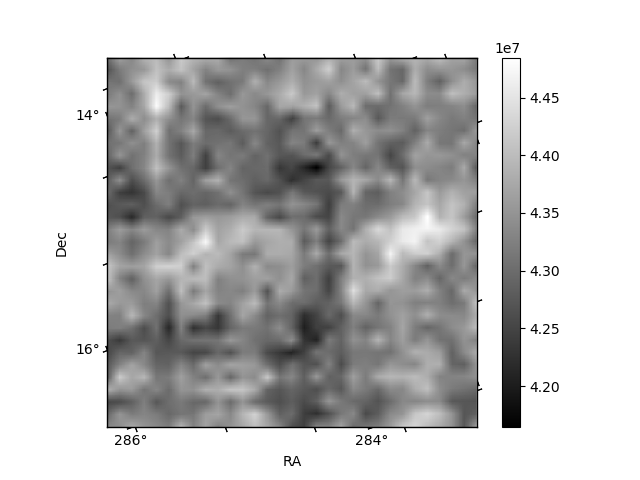
| Quadrant D |  |
 |
Quadrant C |
| Plot type | Count rate plots | Images |
|---|---|---|
| Comparison with Poisson distribution Blue bars denote a histogram of data divided into 1 sec bins. Red curve is a Poisson curve with rate = median count rate of data. |
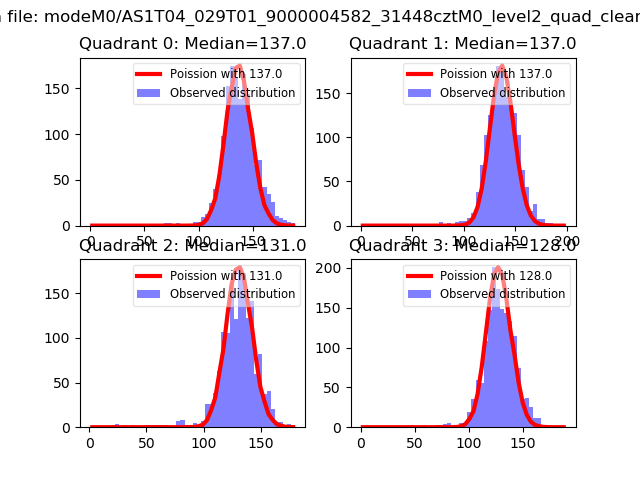 |
 |
| Quadrant-wise count rates Data is divided into 100 sec bins |
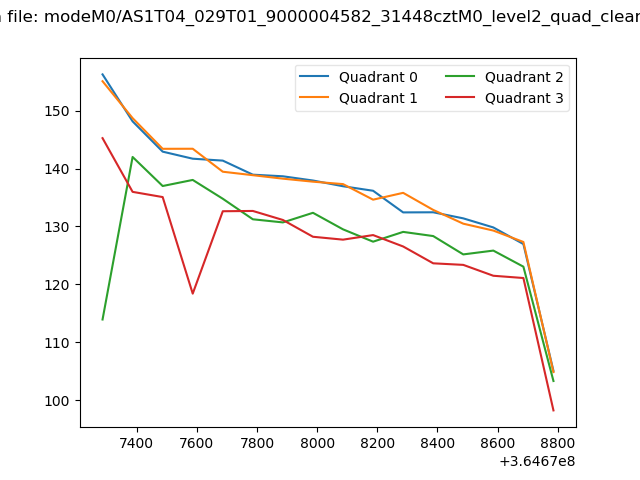 |
|
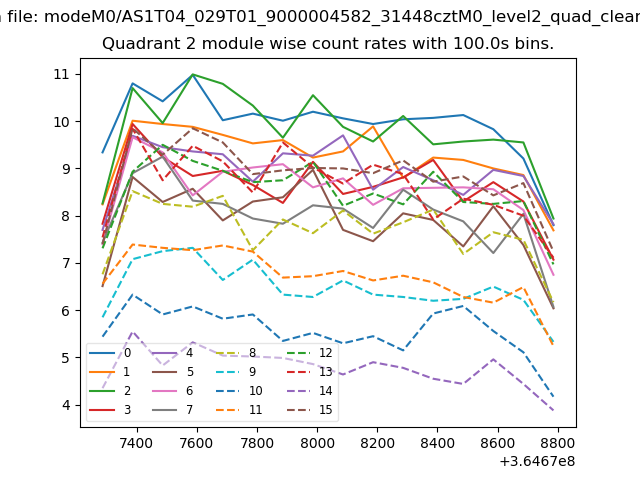
| Module-wise count rates for Quadrant A Data is divided into 100 sec bins |
 |
 |
| Module-wise count rates for Quadrant B Data is divided into 100 sec bins |
 |
 |
| Module-wise count rates for Quadrant C Data is divided into 100 sec bins |
 |
 |
| Module-wise count rates for Quadrant D Data is divided into 100 sec bins |
 |
 |
| Parameter | Plot |
|---|---|
| CZT HV Monitor |  |
| D_VDD | 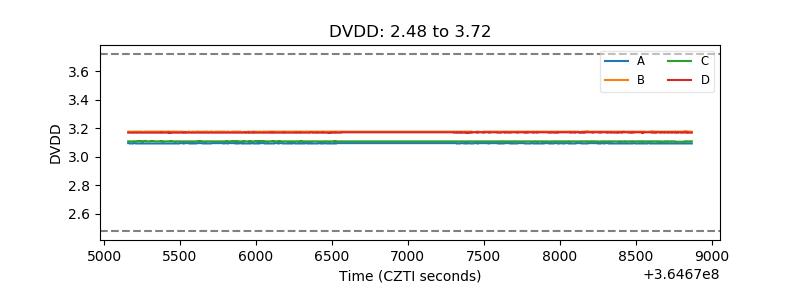 |
| Temperature 1 | 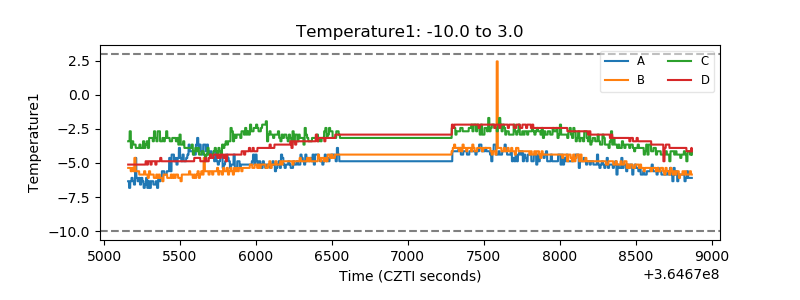 |
| Veto HV Monitor | 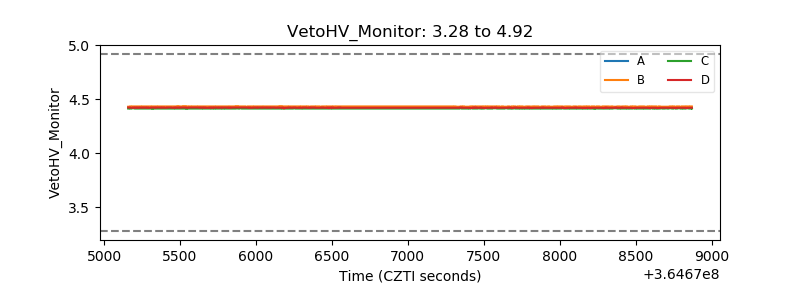 |
| Veto LLD | 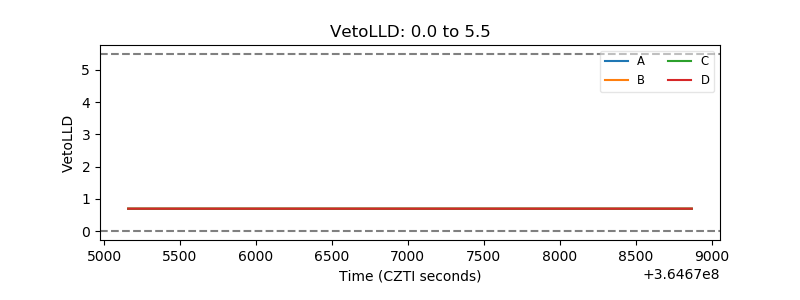 |
| Alpha Counter | 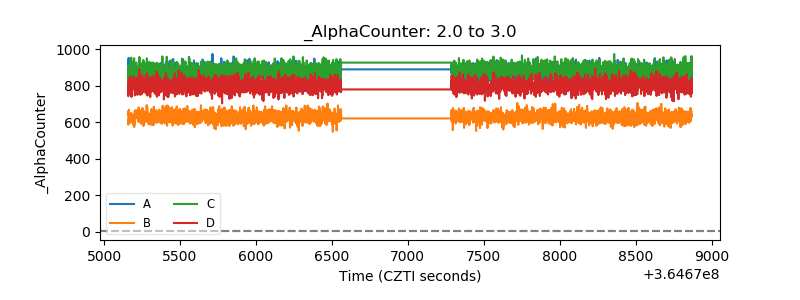 |
| _CPM_Rate | 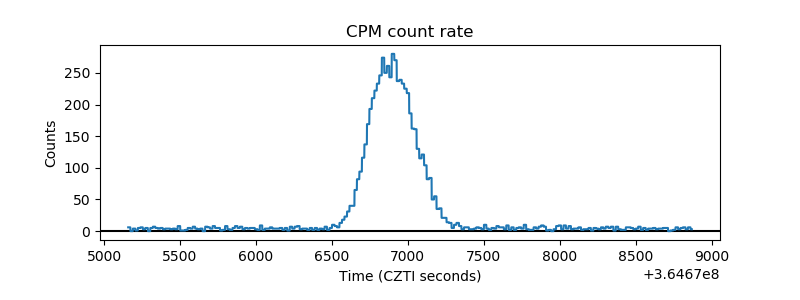 |
| CZT Counter | 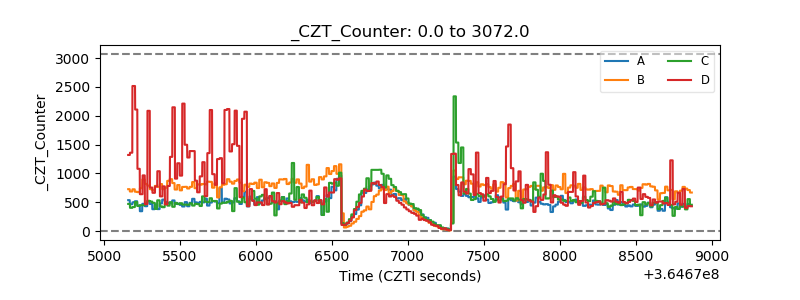 |
| +2.5 Volts monitor |  |
| +5 Volts monitor | 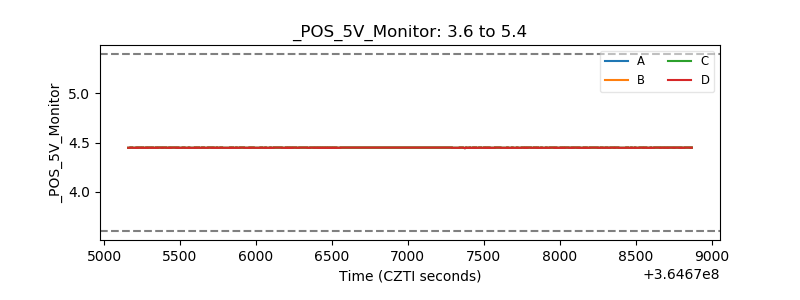 |
| _ROLL_ROT | 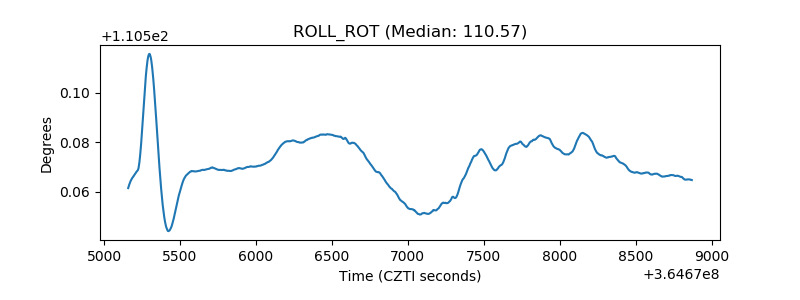 |
| _Roll_DEC | 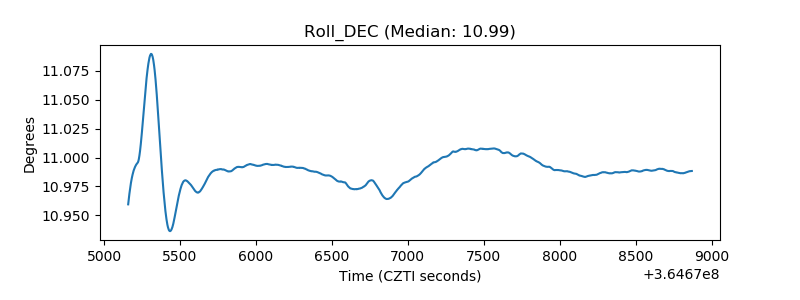 |
| _Roll_RA | 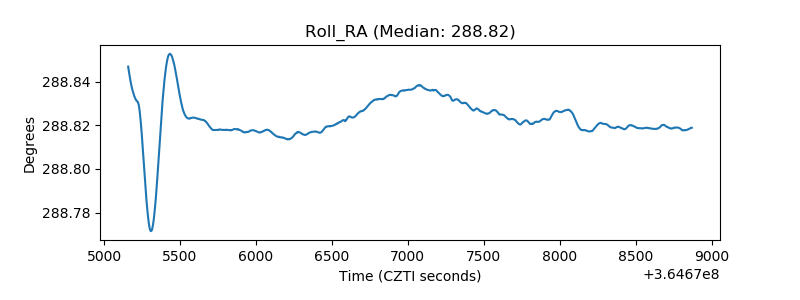 |
| Veto Counter | 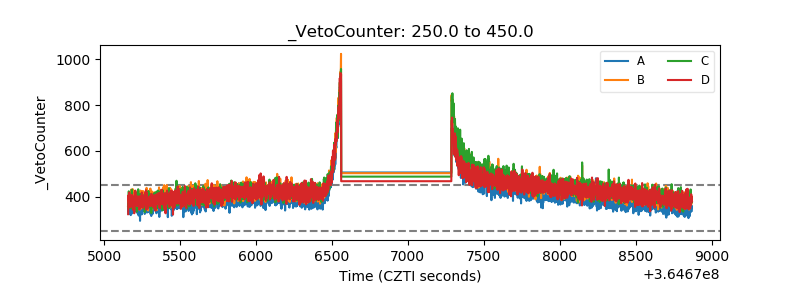 |