| Param | Original file | Final file |
|---|---|---|
| Filename | modeM0/AS1T04_029T01_9000004582_31449cztM0_level2.evt | modeM0/AS1T04_029T01_9000004582_31449cztM0_level2_quad_clean.evt |
| Size (bytes) | 547,632,000 | 92,903,040 |
| Size | 522.3 MB | 88.6 MB |
| Events in quadrant A | 3,212,486 | 601,317 |
| Events in quadrant B | 5,247,420 | 601,382 |
| Events in quadrant C | 3,578,744 | 576,156 |
| Events in quadrant D | 4,089,869 | 564,994 |
| Mode SS | |||
|---|---|---|---|
| Quadrant | BADHDUFLAG | Total packets | Discarded packets |
| A | 0 | 136 | 0 |
| B | 0 | 136 | 0 |
| C | 0 | 136 | 0 |
| D | 0 | 136 | 0 |
| Mode M9 | |||
|---|---|---|---|
| Quadrant | BADHDUFLAG | Total packets | Discarded packets |
| A | 0 | 13 | 0 |
| B | 0 | 14 | 0 |
| C | 0 | 14 | 0 |
| D | 0 | 14 | 0 |
| Mode M0 | |||
|---|---|---|---|
| Quadrant | BADHDUFLAG | Total packets | Discarded packets |
| A | 0 | 13947 | 2 |
| B | 0 | 20396 | 2 |
| C | 0 | 14970 | 3 |
| D | 0 | 16687 | 2 |
| Quadrant | Total seconds | Saturated seconds | Saturation percentage |
|---|---|---|---|
| A | 6740 | 61 | 0.905045% |
| B | 6740 | 117 | 1.735905% |
| C | 6739 | 239 | 3.546520% |
| D | 6739 | 136 | 2.018104% |
Noise dominated data is calculated using 1-second bins in cleaned event files. If a bin has >2000 counts, and if more than 50% of those come from <1% of pixels, then it is considered to be noise-dominated and hence unusable.
| Quadrant | # 1 sec bins | Bins with >0 counts | Bins with >2000 counts | High rate bins dominated by noise | Noise dominated (total time) | Noise dominated (detector-on time) | Marked lightcurve |
|---|---|---|---|---|---|---|---|
| A | 7645 | 6740 | 0 | 0 | 0.00% | 0.00% | 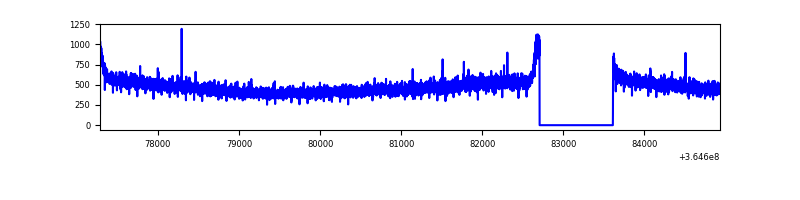 |
| B | 7645 | 6740 | 3 | 3 | 0.04% | 0.04% | 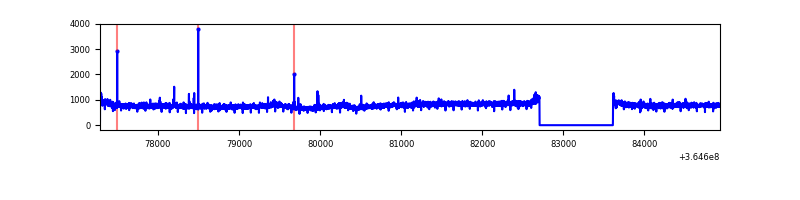 |
| C | 7644 | 6739 | 32 | 32 | 0.42% | 0.47% |  |
| D | 7644 | 6739 | 65 | 65 | 0.85% | 0.96% | 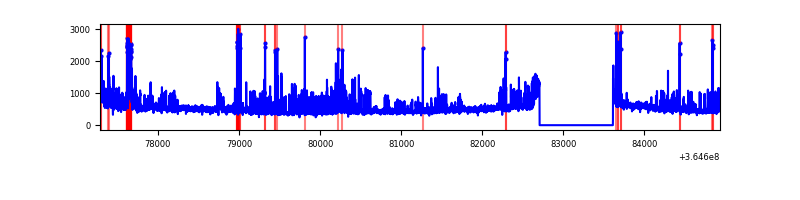 |
Top three noisy pixels from each quadrant. If the there are fewer than three noisy pixels in the level2.evt file, extra rows are filled as -1
| Pixel properties | Quadrant properties | ||||||
|---|---|---|---|---|---|---|---|
| Quadrant | DetID | PixID | Counts | Sigma | Mean | Median | Sigma |
| A | 13 | 254 | 12156 | 67.36 | 832 | 815 | 168.4 |
| A | 3 | 137 | 8662 | 46.6 | 832 | 815 | 168.4 |
| A | 0 | 226 | 6962 | 36.51 | 832 | 815 | 168.4 |
| B | 6 | 159 | 1942095 | 12117.99 | 821 | 800 | 160.2 |
| B | 4 | 80 | 44482 | 272.67 | 821 | 800 | 160.2 |
| B | 12 | 111 | 19915 | 119.32 | 821 | 800 | 160.2 |
| C | 0 | 10 | 169517 | 895.32 | 795 | 801 | 188.4 |
| C | 14 | 238 | 141908 | 748.81 | 795 | 801 | 188.4 |
| C | 10 | 22 | 73810 | 387.44 | 795 | 801 | 188.4 |
| D | 8 | 195 | 646579 | 3344.95 | 807 | 786 | 193.1 |
| D | 12 | 233 | 144757 | 745.71 | 807 | 786 | 193.1 |
| D | 5 | 233 | 116103 | 597.3 | 807 | 786 | 193.1 |
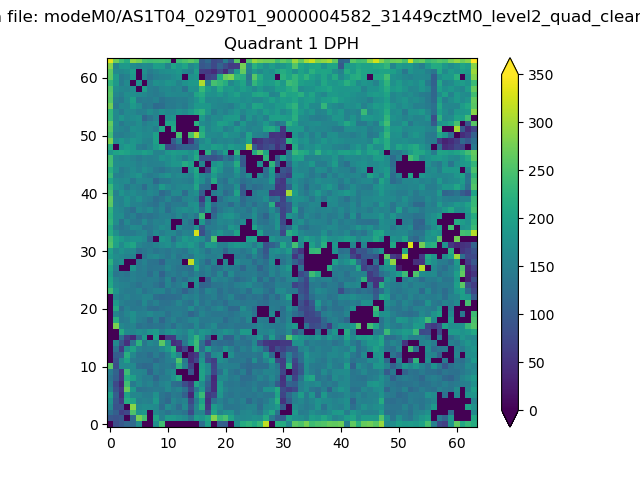
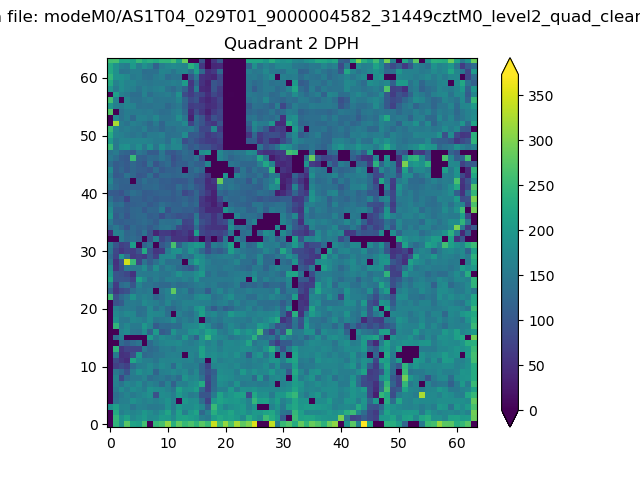
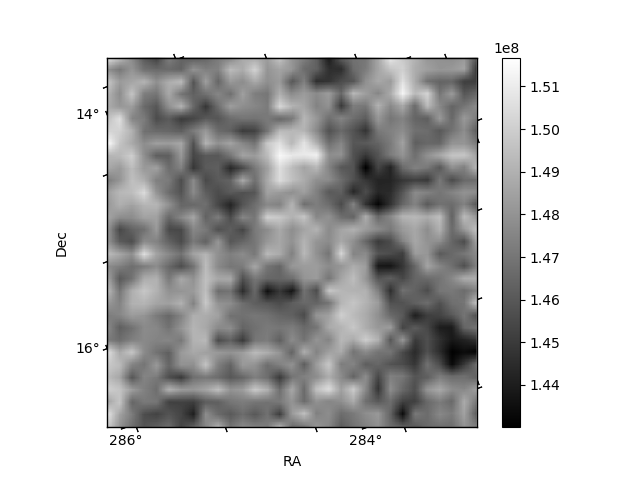
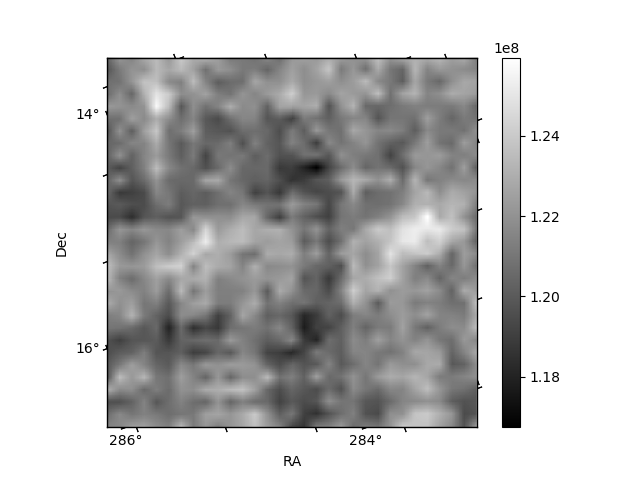
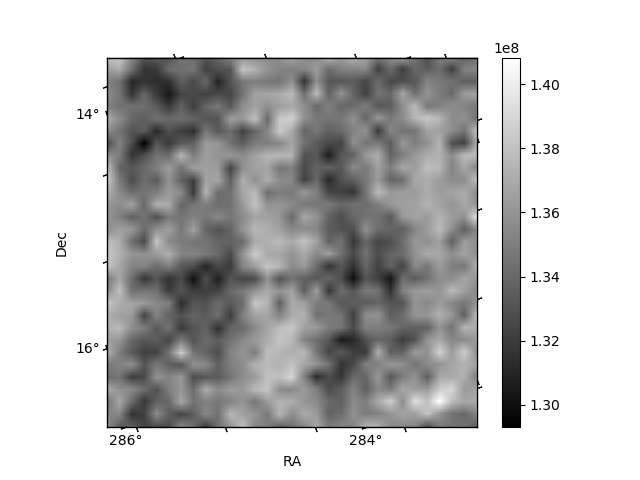
Histogram calculated using DETX and DETY for each event in the final _common_clean file
| Quadrant A |  |
 |
Quadrant B |
|---|---|---|---|
| Quadrant D |  |
 |
Quadrant C |
| Plot type | Count rate plots | Images |
|---|---|---|
| Comparison with Poisson distribution Blue bars denote a histogram of data divided into 1 sec bins. Red curve is a Poisson curve with rate = median count rate of data. |
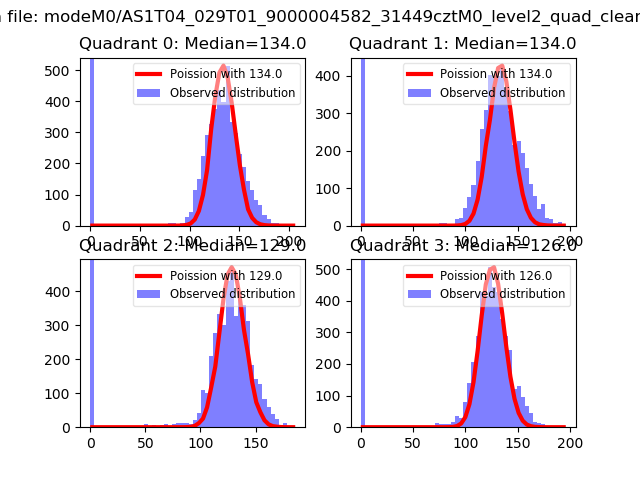 |
 |
| Quadrant-wise count rates Data is divided into 100 sec bins |
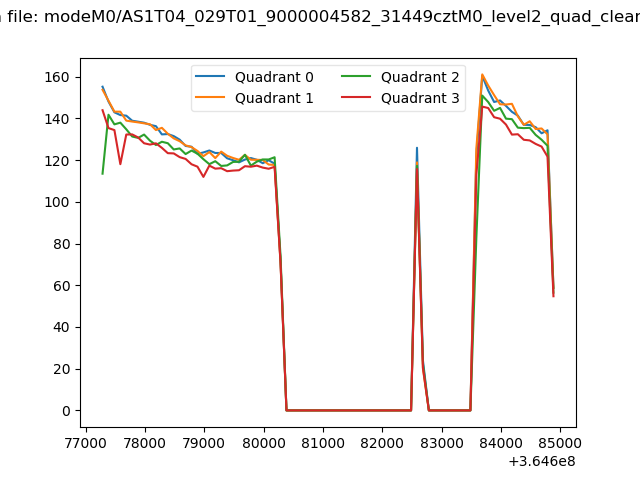 |
|
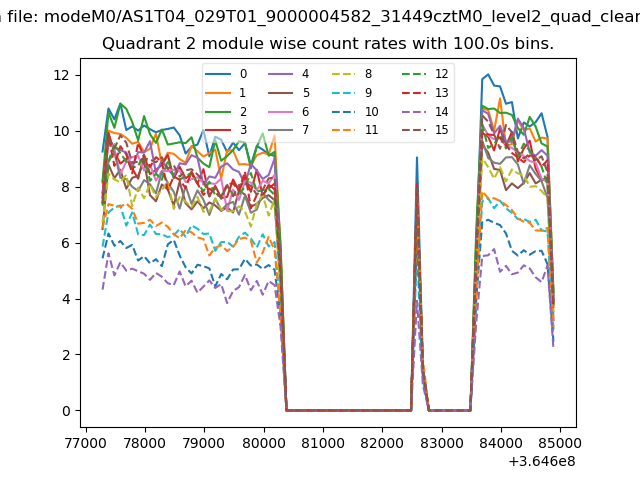
| Module-wise count rates for Quadrant A Data is divided into 100 sec bins |
 |
 |
| Module-wise count rates for Quadrant B Data is divided into 100 sec bins |
 |
 |
| Module-wise count rates for Quadrant C Data is divided into 100 sec bins |
 |
 |
| Module-wise count rates for Quadrant D Data is divided into 100 sec bins |
 |
 |
| Parameter | Plot |
|---|---|
| CZT HV Monitor |  |
| D_VDD | 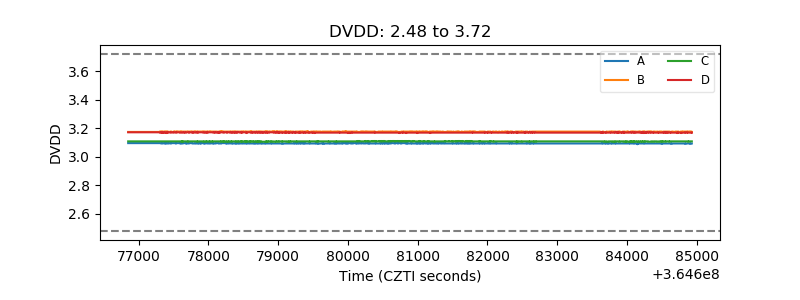 |
| Temperature 1 | 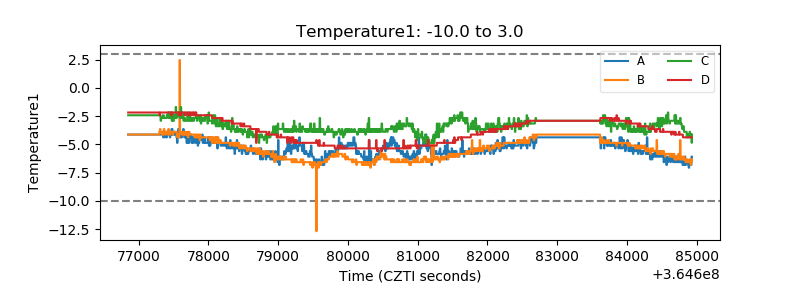 |
| Veto HV Monitor | 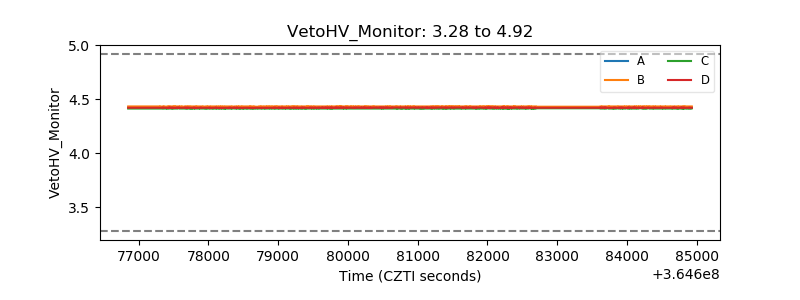 |
| Veto LLD | 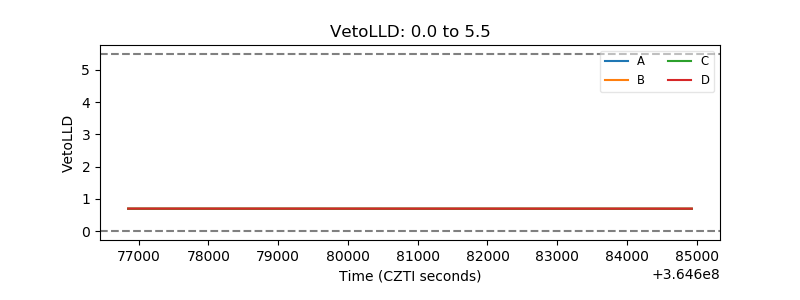 |
| Alpha Counter | 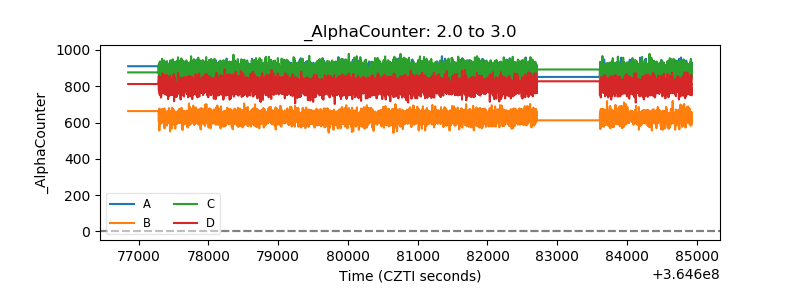 |
| _CPM_Rate | 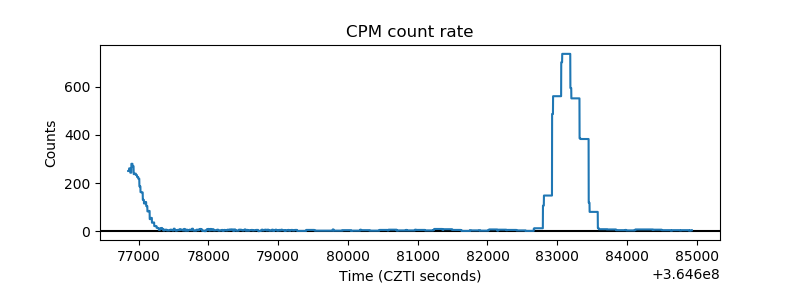 |
| CZT Counter | 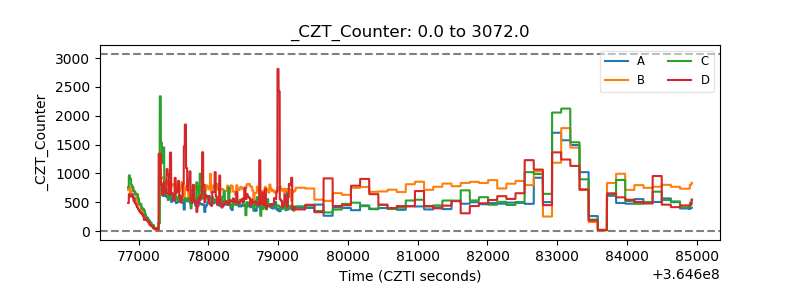 |
| +2.5 Volts monitor |  |
| +5 Volts monitor | 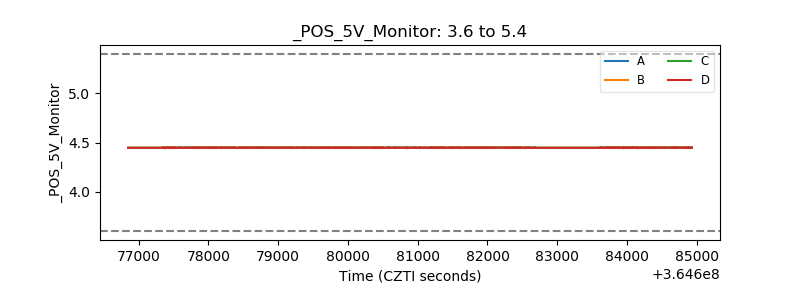 |
| _ROLL_ROT | 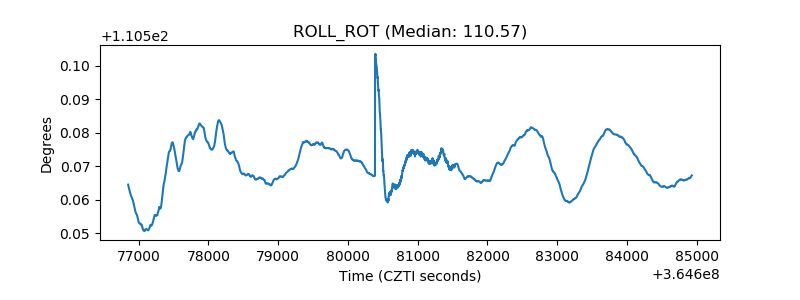 |
| _Roll_DEC | 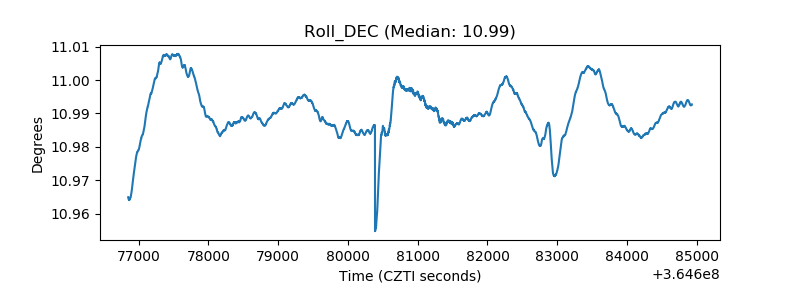 |
| _Roll_RA | 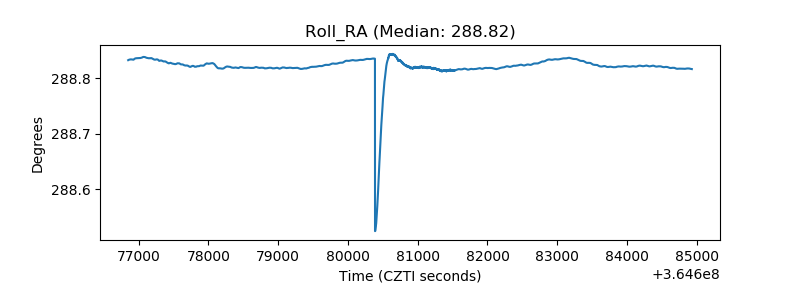 |
| Veto Counter | 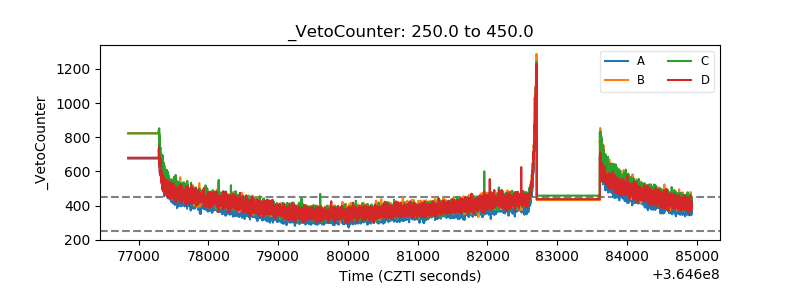 |