| Param | Original file | Final file |
|---|---|---|
| Filename | modeM0/AS1T04_029T01_9000004582_31451cztM0_level2.evt | modeM0/AS1T04_029T01_9000004582_31451cztM0_level2_quad_clean.evt |
| Size (bytes) | 524,315,520 | 91,607,040 |
| Size | 500.0 MB | 87.4 MB |
| Events in quadrant A | 3,103,686 | 593,588 |
| Events in quadrant B | 5,003,047 | 600,717 |
| Events in quadrant C | 3,493,870 | 568,255 |
| Events in quadrant D | 3,840,012 | 560,450 |
| Mode SS | |||
|---|---|---|---|
| Quadrant | BADHDUFLAG | Total packets | Discarded packets |
| A | 0 | 132 | 0 |
| B | 0 | 132 | 0 |
| C | 0 | 132 | 0 |
| D | 0 | 132 | 0 |
| Mode M9 | |||
|---|---|---|---|
| Quadrant | BADHDUFLAG | Total packets | Discarded packets |
| A | 0 | 12 | 0 |
| B | 0 | 13 | 0 |
| C | 0 | 13 | 0 |
| D | 0 | 13 | 0 |
| Mode M0 | |||
|---|---|---|---|
| Quadrant | BADHDUFLAG | Total packets | Discarded packets |
| A | 0 | 13439 | 3 |
| B | 0 | 19507 | 2 |
| C | 0 | 14542 | 2 |
| D | 0 | 15860 | 2 |
| Quadrant | Total seconds | Saturated seconds | Saturation percentage |
|---|---|---|---|
| A | 6465 | 41 | 0.634184% |
| B | 6465 | 82 | 1.268368% |
| C | 6465 | 208 | 3.217324% |
| D | 6465 | 90 | 1.392111% |
Noise dominated data is calculated using 1-second bins in cleaned event files. If a bin has >2000 counts, and if more than 50% of those come from <1% of pixels, then it is considered to be noise-dominated and hence unusable.
| Quadrant | # 1 sec bins | Bins with >0 counts | Bins with >2000 counts | High rate bins dominated by noise | Noise dominated (total time) | Noise dominated (detector-on time) | Marked lightcurve |
|---|---|---|---|---|---|---|---|
| A | 7536 | 6465 | 0 | 0 | 0.00% | 0.00% | 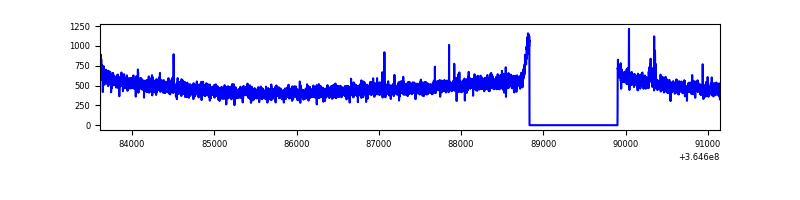 |
| B | 7536 | 6465 | 1 | 1 | 0.01% | 0.02% | 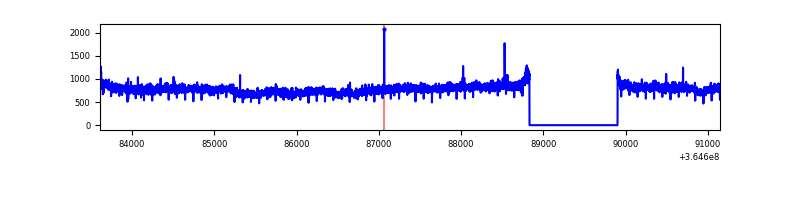 |
| C | 7536 | 6465 | 48 | 48 | 0.64% | 0.74% | 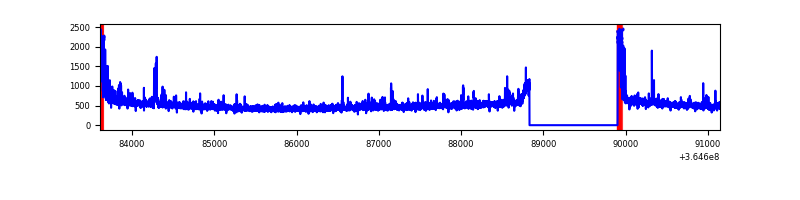 |
| D | 7536 | 6465 | 43 | 43 | 0.57% | 0.67% | 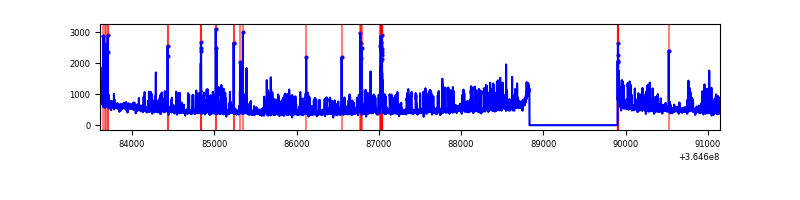 |
Top three noisy pixels from each quadrant. If the there are fewer than three noisy pixels in the level2.evt file, extra rows are filled as -1
| Pixel properties | Quadrant properties | ||||||
|---|---|---|---|---|---|---|---|
| Quadrant | DetID | PixID | Counts | Sigma | Mean | Median | Sigma |
| A | 0 | 230 | 12362 | 72.34 | 801 | 786 | 160.0 |
| A | 13 | 254 | 11205 | 65.11 | 801 | 786 | 160.0 |
| A | 3 | 137 | 8188 | 46.25 | 801 | 786 | 160.0 |
| B | 6 | 159 | 1840558 | 12046.83 | 795 | 776 | 152.7 |
| B | 12 | 111 | 18941 | 118.94 | 795 | 776 | 152.7 |
| B | 11 | 111 | 17507 | 109.55 | 795 | 776 | 152.7 |
| C | 0 | 10 | 217330 | 1195.85 | 768 | 774 | 181.1 |
| C | 14 | 238 | 133795 | 734.56 | 768 | 774 | 181.1 |
| C | 10 | 22 | 89480 | 489.85 | 768 | 774 | 181.1 |
| D | 8 | 195 | 630145 | 3413.81 | 776 | 759 | 184.4 |
| D | 12 | 218 | 101195 | 544.77 | 776 | 759 | 184.4 |
| D | 2 | 250 | 60226 | 322.55 | 776 | 759 | 184.4 |
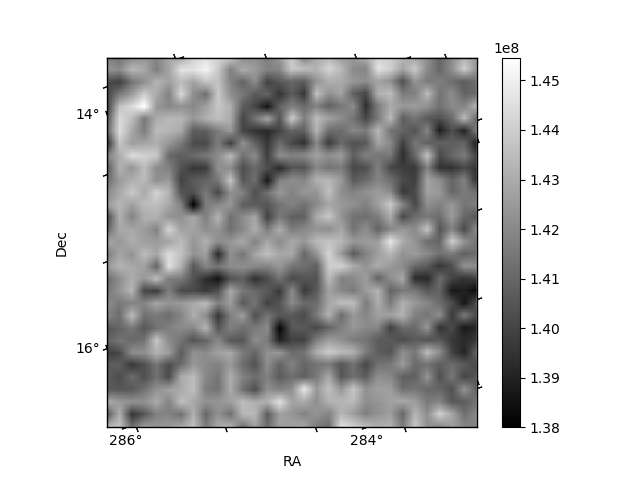
Histogram calculated using DETX and DETY for each event in the final _common_clean file
| Quadrant A | 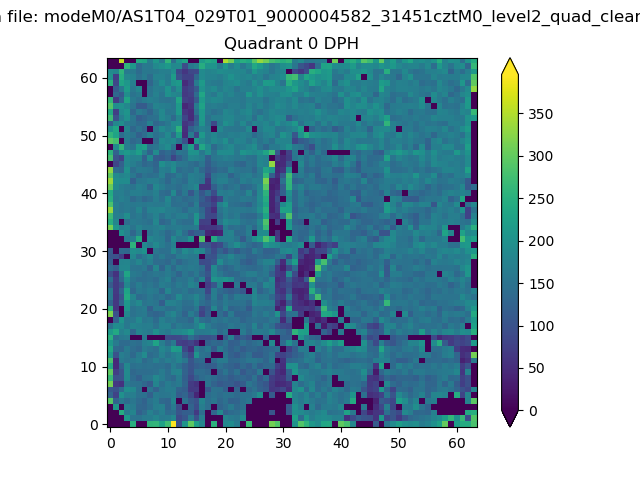 |
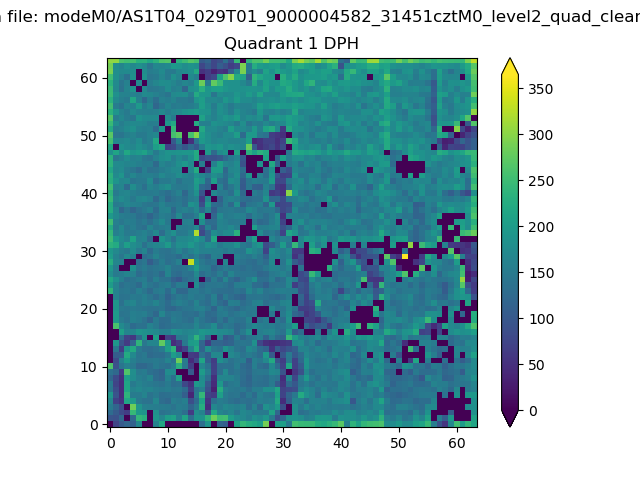 |
Quadrant B |
|---|---|---|---|
| Quadrant D | 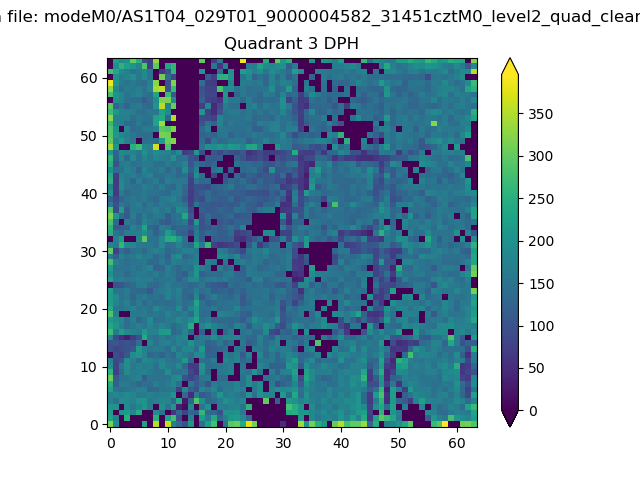 |
 |
Quadrant C |
| Plot type | Count rate plots | Images |
|---|---|---|
| Comparison with Poisson distribution Blue bars denote a histogram of data divided into 1 sec bins. Red curve is a Poisson curve with rate = median count rate of data. |
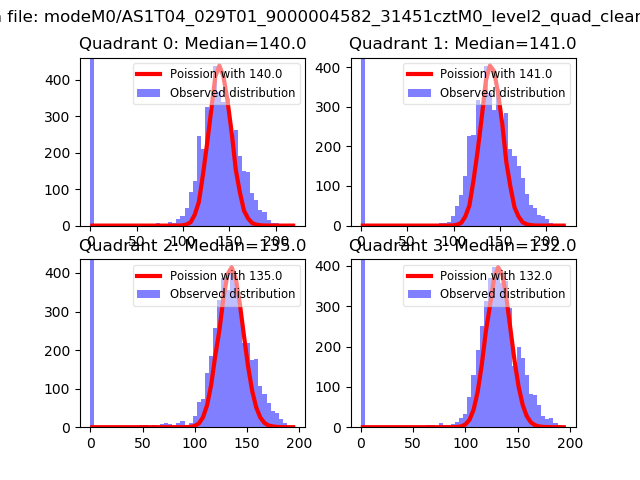 |
 |
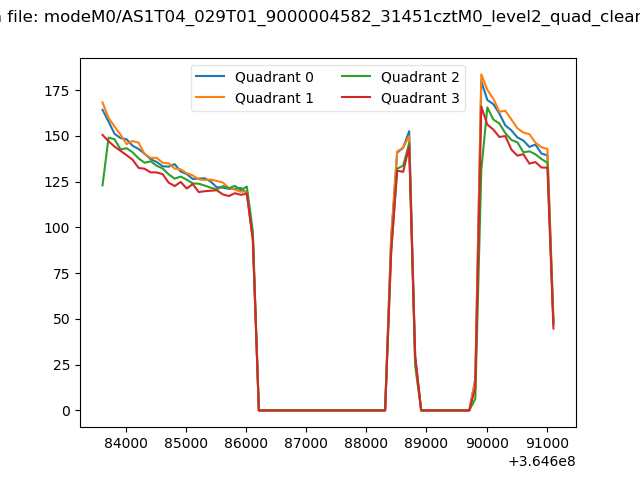
| Quadrant-wise count rates Data is divided into 100 sec bins |
 |
|
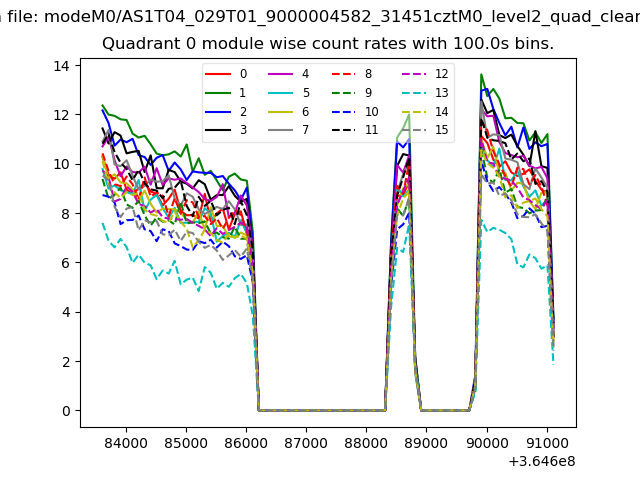
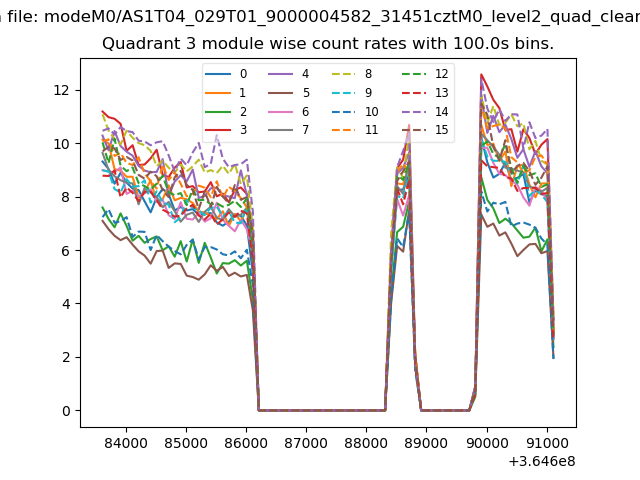
| Module-wise count rates for Quadrant A Data is divided into 100 sec bins |
 |
 |
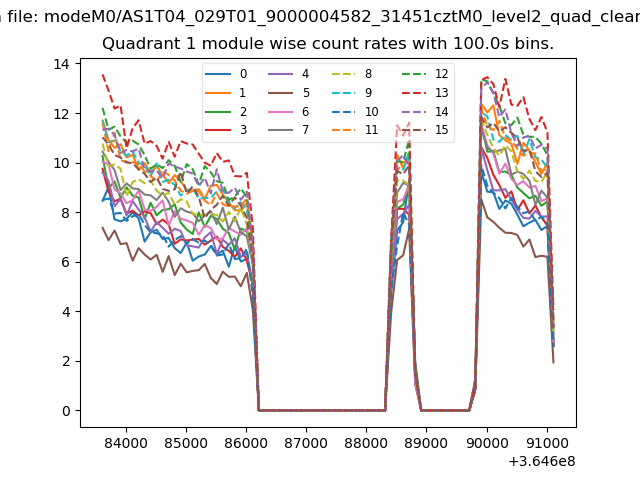
| Module-wise count rates for Quadrant B Data is divided into 100 sec bins |
 |
 |
| Module-wise count rates for Quadrant C Data is divided into 100 sec bins |
 |
 |
| Module-wise count rates for Quadrant D Data is divided into 100 sec bins |
 |
 |
| Parameter | Plot |
|---|---|
| CZT HV Monitor | 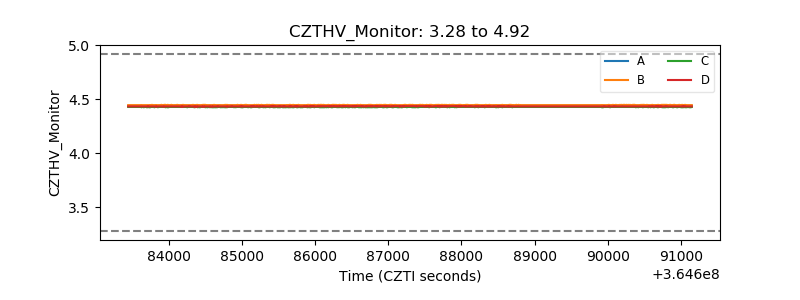 |
| D_VDD | 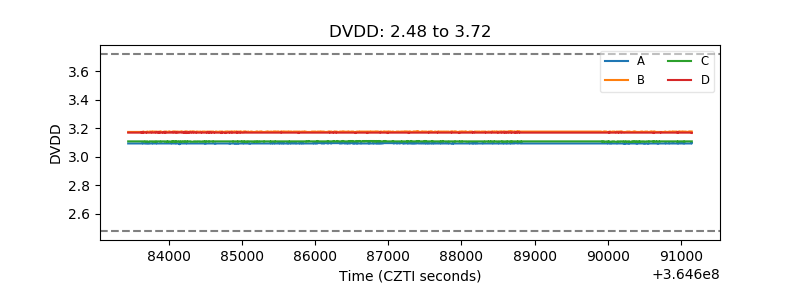 |
| Temperature 1 | 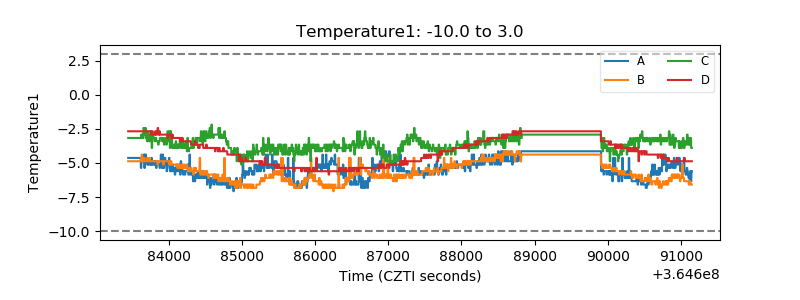 |
| Veto HV Monitor | 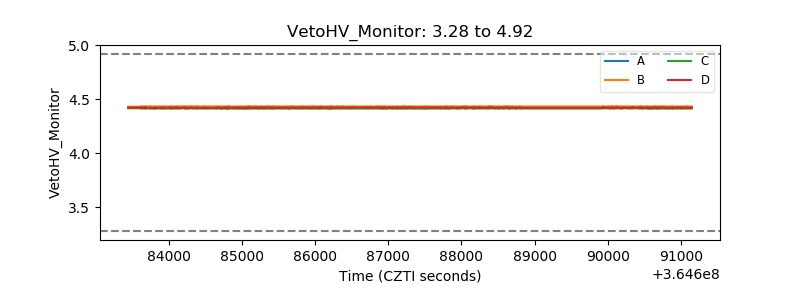 |
| Veto LLD | 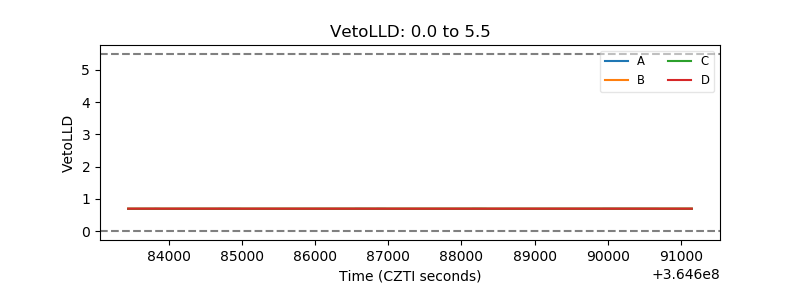 |
| Alpha Counter | 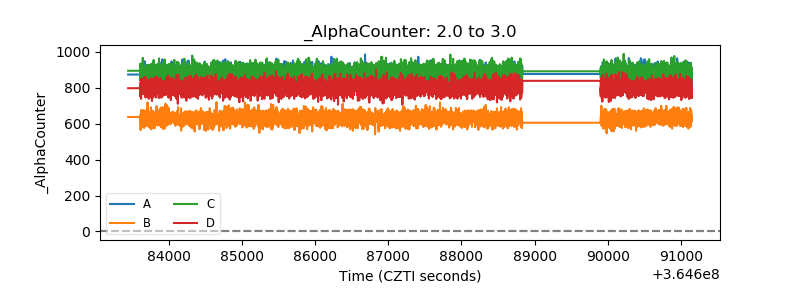 |
| _CPM_Rate | 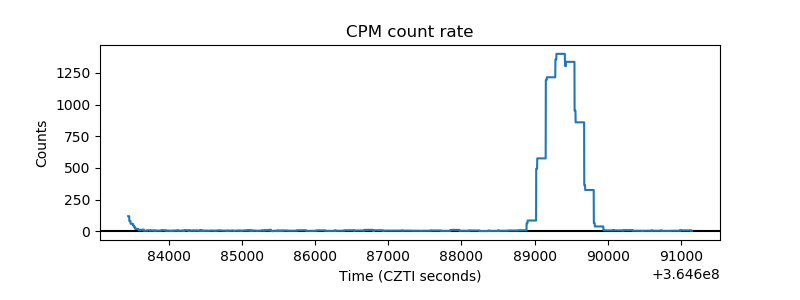 |
| CZT Counter | 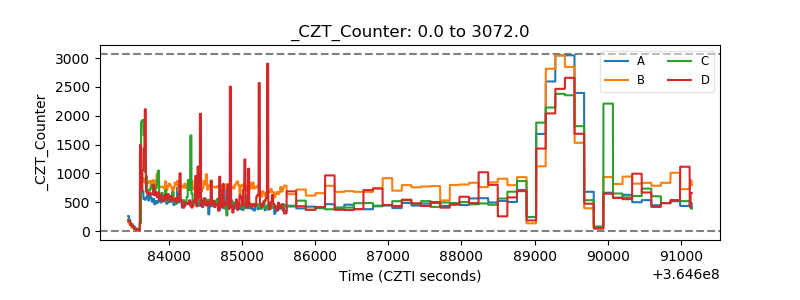 |
| +2.5 Volts monitor |  |
| +5 Volts monitor | 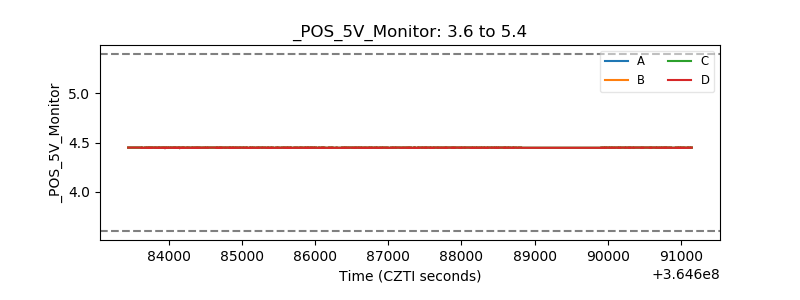 |
| _ROLL_ROT | 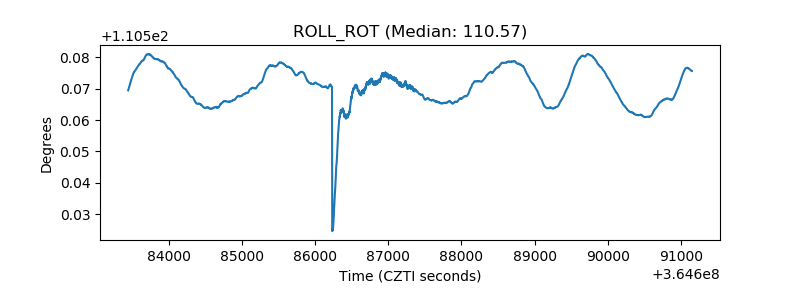 |
| _Roll_DEC | 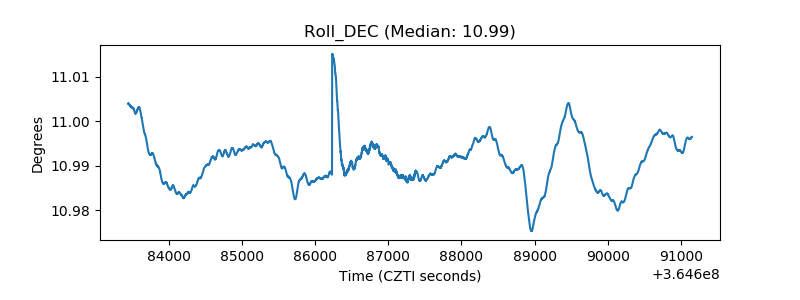 |
| _Roll_RA | 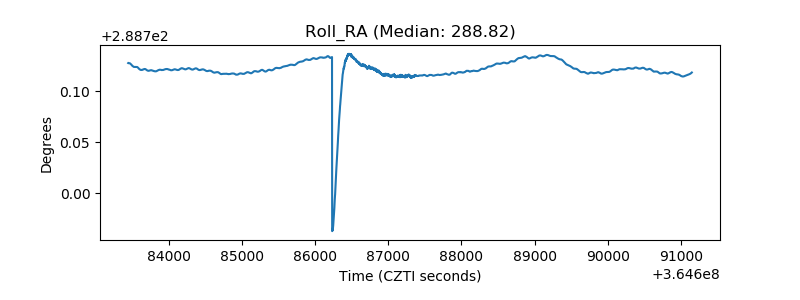 |
| Veto Counter | 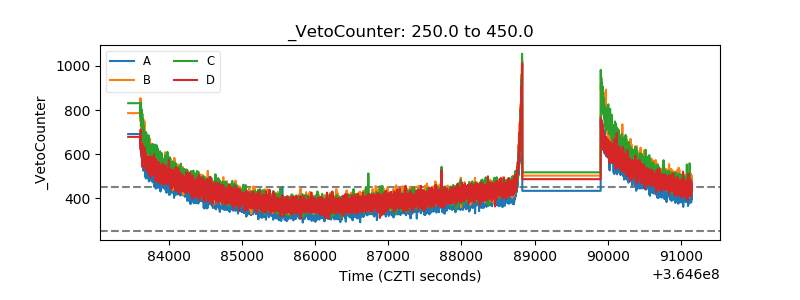 |