| Param | Original file | Final file |
|---|---|---|
| Filename | modeM0/AS1T04_029T01_9000004582_31452cztM0_level2.evt | modeM0/AS1T04_029T01_9000004582_31452cztM0_level2_quad_clean.evt |
| Size (bytes) | 562,510,080 | 93,090,240 |
| Size | 536.5 MB | 88.8 MB |
| Events in quadrant A | 3,143,513 | 622,898 |
| Events in quadrant B | 5,568,984 | 599,866 |
| Events in quadrant C | 4,093,102 | 571,861 |
| Events in quadrant D | 3,799,640 | 580,716 |
| Mode SS | |||
|---|---|---|---|
| Quadrant | BADHDUFLAG | Total packets | Discarded packets |
| A | 0 | 130 | 0 |
| B | 0 | 130 | 0 |
| C | 0 | 130 | 0 |
| D | 0 | 130 | 0 |
| Mode M9 | |||
|---|---|---|---|
| Quadrant | BADHDUFLAG | Total packets | Discarded packets |
| A | 0 | 21 | 0 |
| B | 0 | 22 | 0 |
| C | 0 | 22 | 0 |
| D | 0 | 22 | 0 |
| Mode M0 | |||
|---|---|---|---|
| Quadrant | BADHDUFLAG | Total packets | Discarded packets |
| A | 0 | 13312 | 2 |
| B | 0 | 20923 | 2 |
| C | 0 | 16247 | 2 |
| D | 0 | 15527 | 2 |
| Quadrant | Total seconds | Saturated seconds | Saturation percentage |
|---|---|---|---|
| A | 6351 | 24 | 0.377893% |
| B | 6351 | 385 | 6.062037% |
| C | 6351 | 412 | 6.487167% |
| D | 6350 | 34 | 0.535433% |
Noise dominated data is calculated using 1-second bins in cleaned event files. If a bin has >2000 counts, and if more than 50% of those come from <1% of pixels, then it is considered to be noise-dominated and hence unusable.
| Quadrant | # 1 sec bins | Bins with >0 counts | Bins with >2000 counts | High rate bins dominated by noise | Noise dominated (total time) | Noise dominated (detector-on time) | Marked lightcurve |
|---|---|---|---|---|---|---|---|
| A | 7546 | 6352 | 0 | 0 | 0.00% | 0.00% | 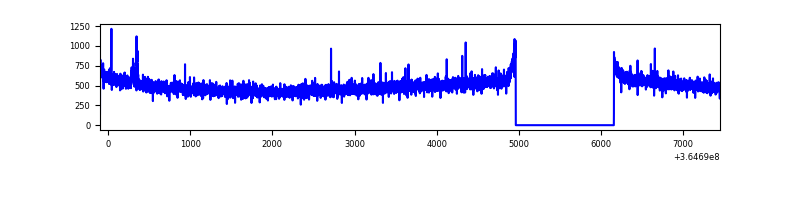 |
| B | 7546 | 6351 | 310 | 310 | 4.11% | 4.88% | 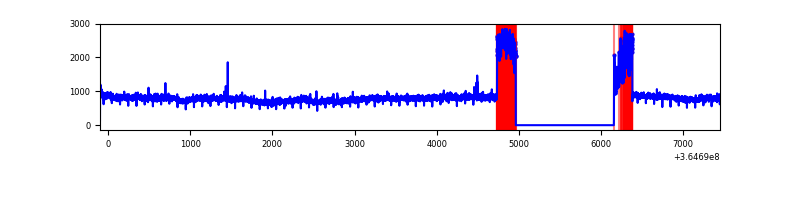 |
| C | 7546 | 6351 | 221 | 221 | 2.93% | 3.48% | 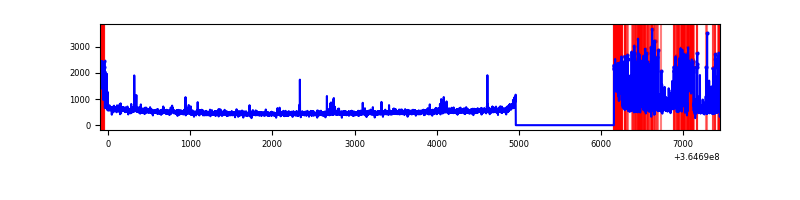 |
| D | 7545 | 6351 | 16 | 16 | 0.21% | 0.25% | 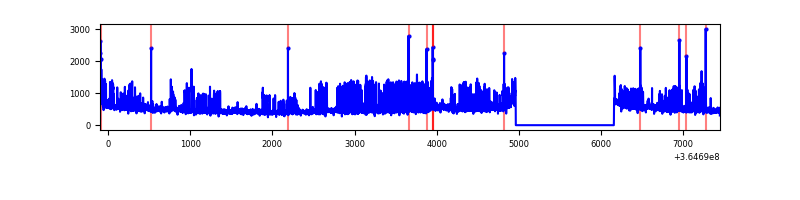 |
Top three noisy pixels from each quadrant. If the there are fewer than three noisy pixels in the level2.evt file, extra rows are filled as -1
| Pixel properties | Quadrant properties | ||||||
|---|---|---|---|---|---|---|---|
| Quadrant | DetID | PixID | Counts | Sigma | Mean | Median | Sigma |
| A | 0 | 230 | 12374 | 71.79 | 812 | 798 | 161.3 |
| A | 13 | 254 | 10061 | 57.44 | 812 | 798 | 161.3 |
| A | 3 | 137 | 7932 | 44.24 | 812 | 798 | 161.3 |
| B | 6 | 159 | 1755034 | 11888.76 | 777 | 759 | 147.6 |
| B | 12 | 1 | 714089 | 4834.25 | 777 | 759 | 147.6 |
| B | 0 | 190 | 23678 | 155.32 | 777 | 759 | 147.6 |
| C | 3 | 233 | 550651 | 3096.22 | 759 | 767 | 177.6 |
| C | 0 | 10 | 206404 | 1157.87 | 759 | 767 | 177.6 |
| C | 10 | 22 | 206070 | 1155.99 | 759 | 767 | 177.6 |
| D | 8 | 195 | 776421 | 4215.15 | 777 | 760 | 184.0 |
| D | 5 | 233 | 28573 | 151.14 | 777 | 760 | 184.0 |
| D | 2 | 234 | 24857 | 130.95 | 777 | 760 | 184.0 |
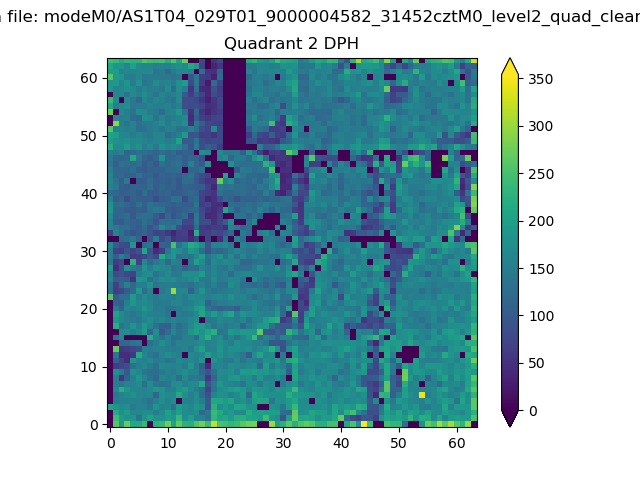
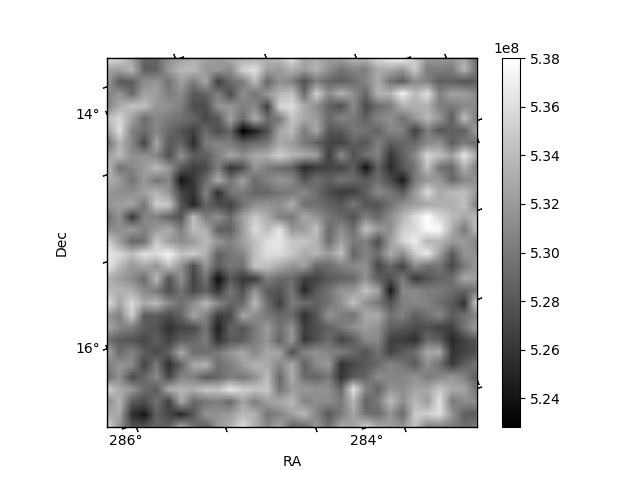
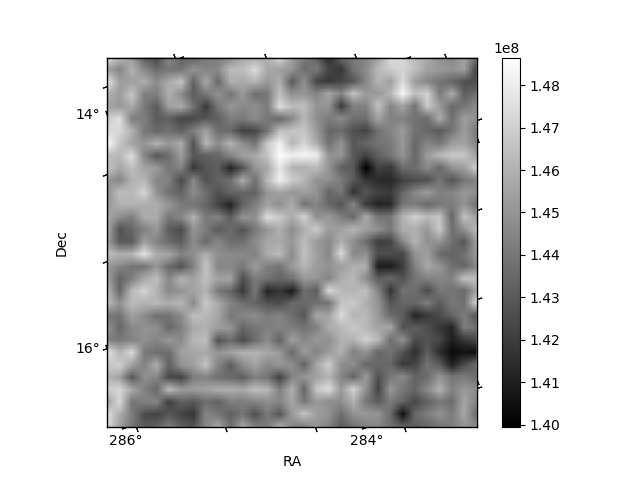
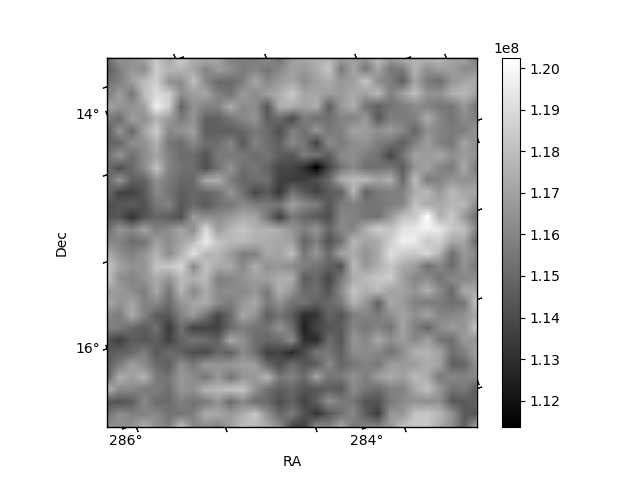
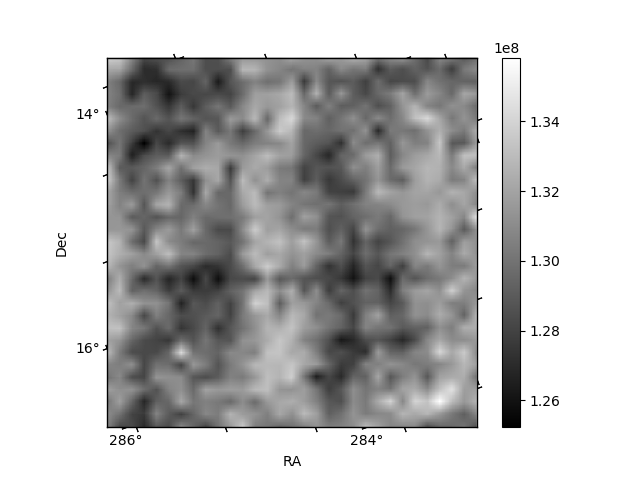
Histogram calculated using DETX and DETY for each event in the final _common_clean file
| Quadrant A | 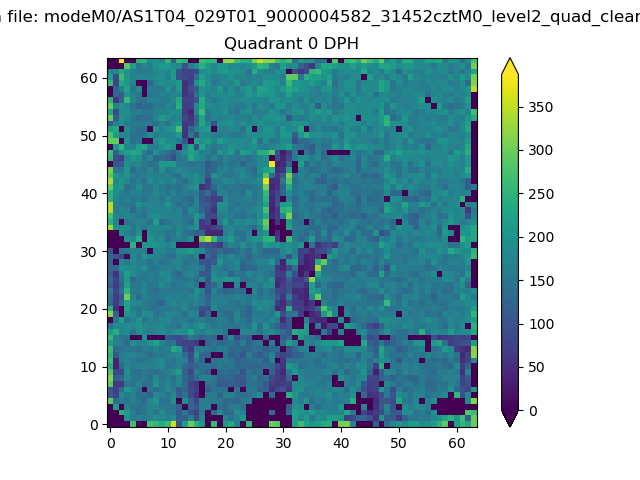 |
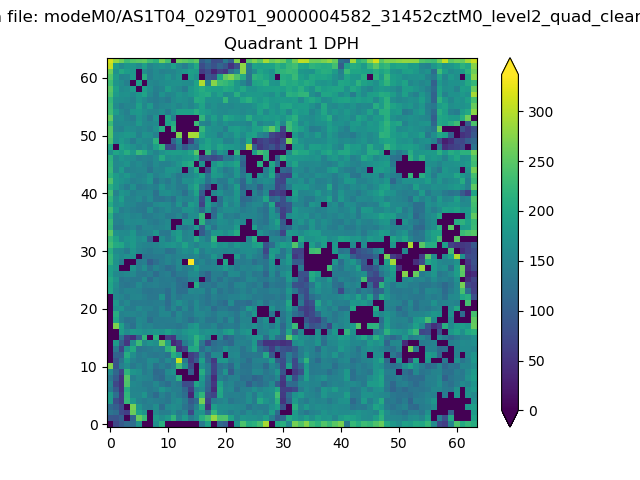 |
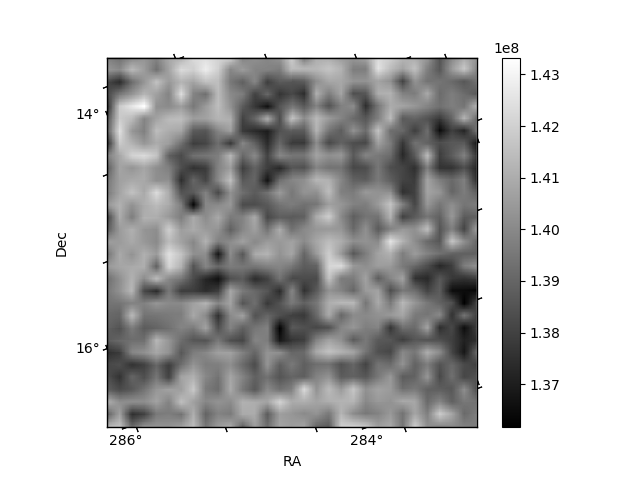
Quadrant B |
|---|---|---|---|
| Quadrant D | 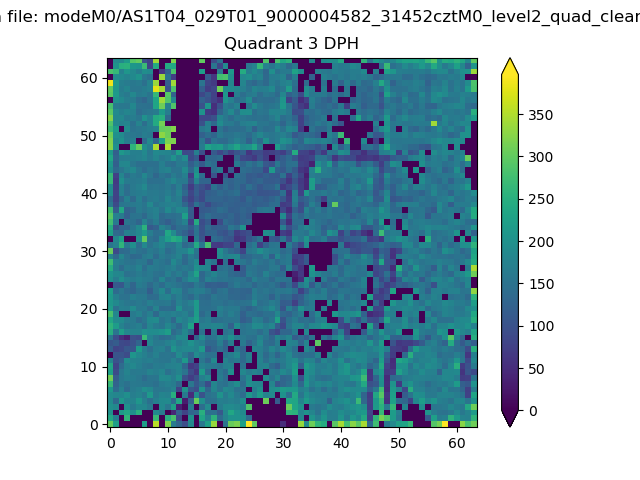 |
 |
Quadrant C |
| Plot type | Count rate plots | Images |
|---|---|---|
| Comparison with Poisson distribution Blue bars denote a histogram of data divided into 1 sec bins. Red curve is a Poisson curve with rate = median count rate of data. |
 |
 |
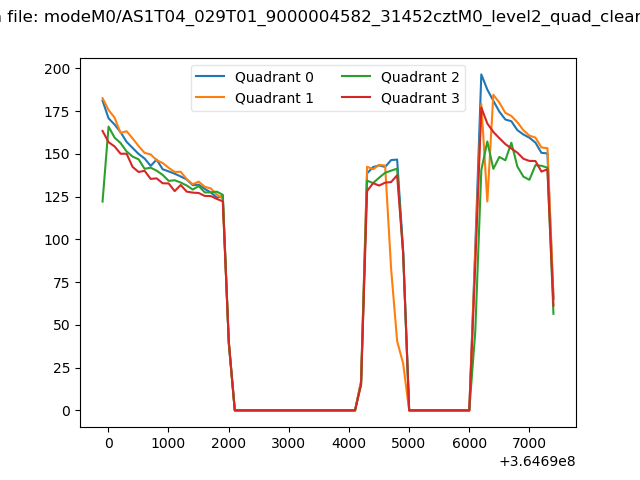
| Quadrant-wise count rates Data is divided into 100 sec bins |
 |
|
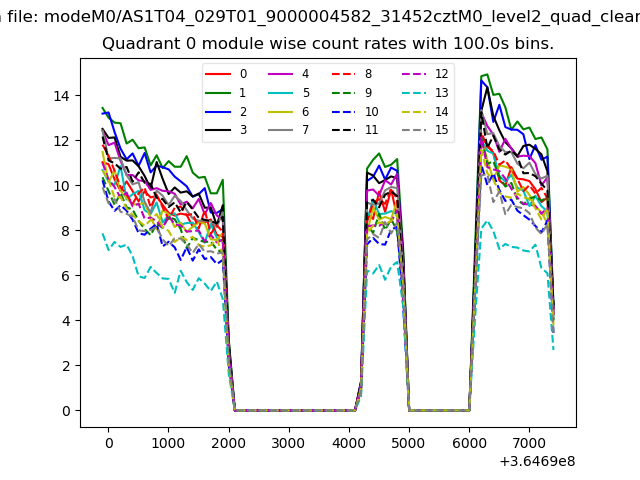
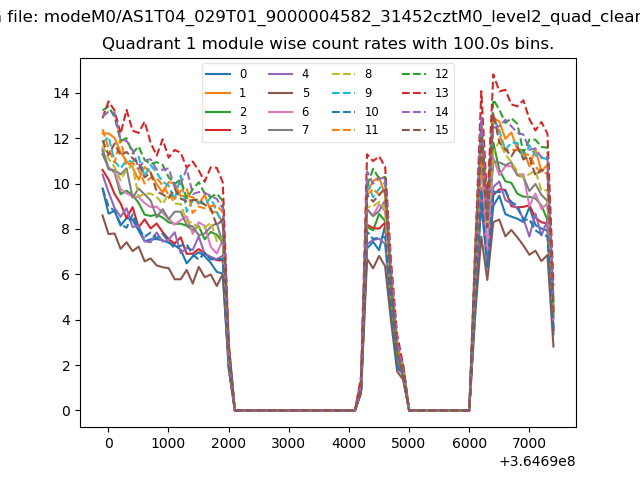
| Module-wise count rates for Quadrant A Data is divided into 100 sec bins |
 |
 |
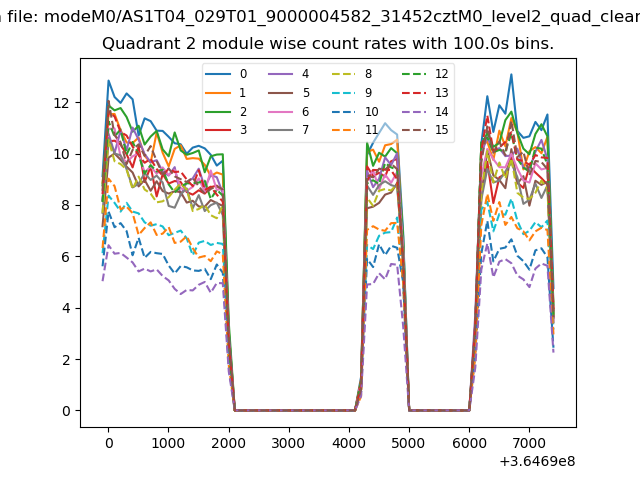
| Module-wise count rates for Quadrant B Data is divided into 100 sec bins |
 |
 |
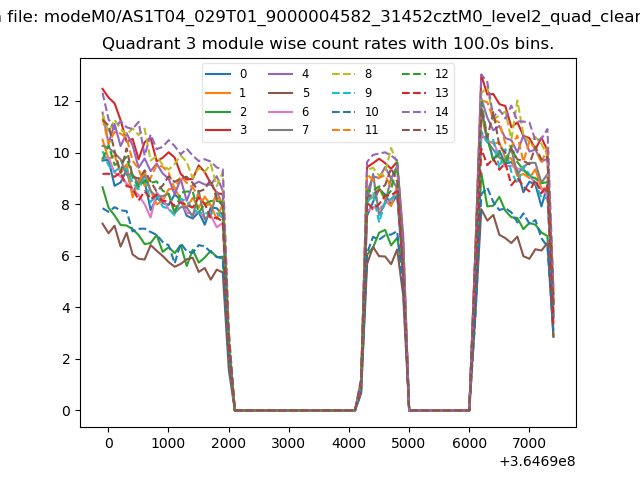
| Module-wise count rates for Quadrant C Data is divided into 100 sec bins |
 |
 |
| Module-wise count rates for Quadrant D Data is divided into 100 sec bins |
 |
 |
| Parameter | Plot |
|---|---|
| CZT HV Monitor | 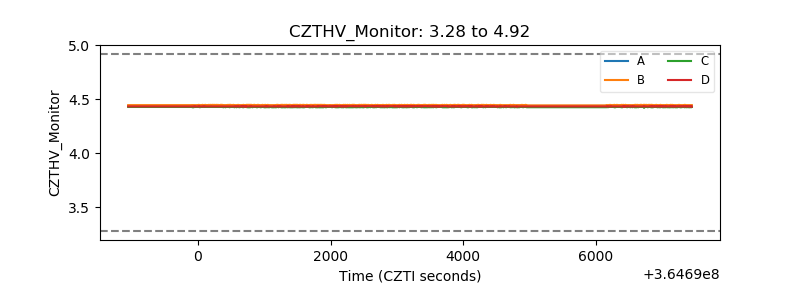 |
| D_VDD | 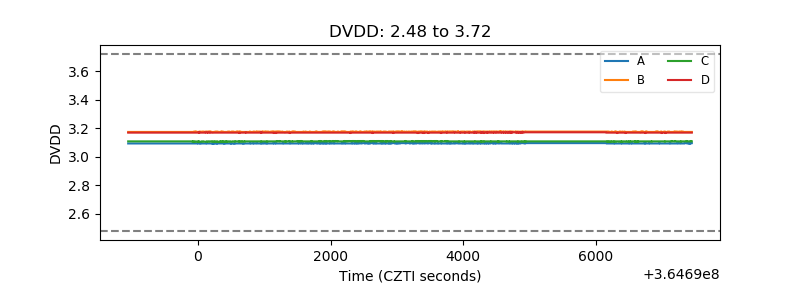 |
| Temperature 1 | 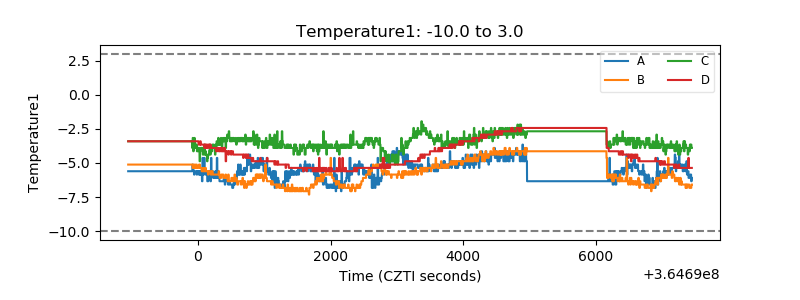 |
| Veto HV Monitor | 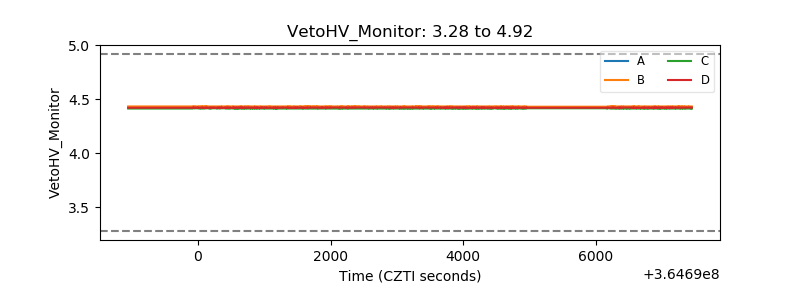 |
| Veto LLD | 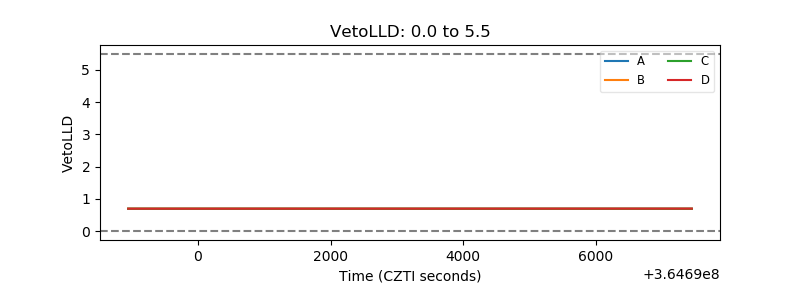 |
| Alpha Counter | 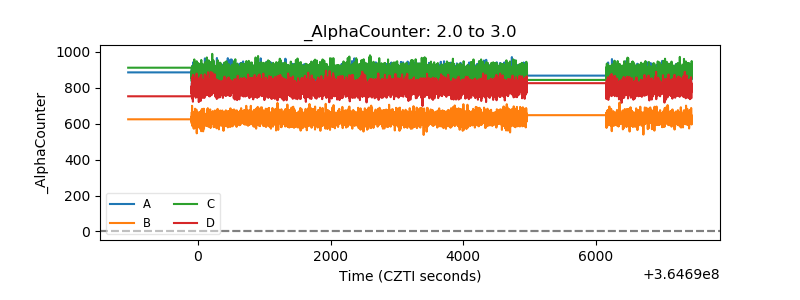 |
| _CPM_Rate | 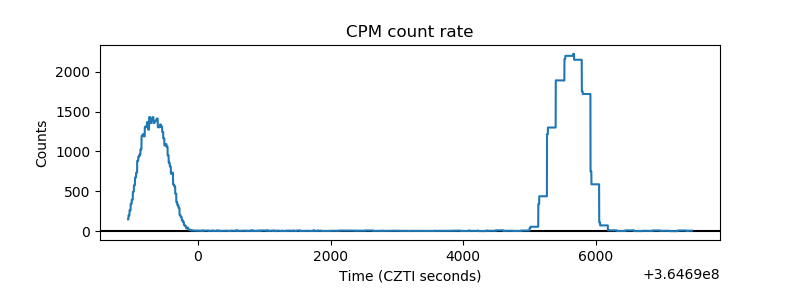 |
| CZT Counter | 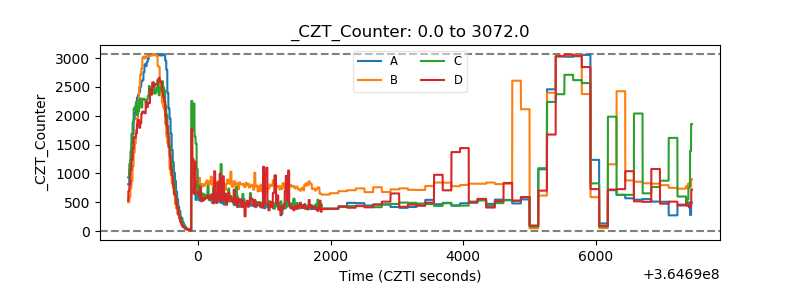 |
| +2.5 Volts monitor |  |
| +5 Volts monitor |  |
| _ROLL_ROT | 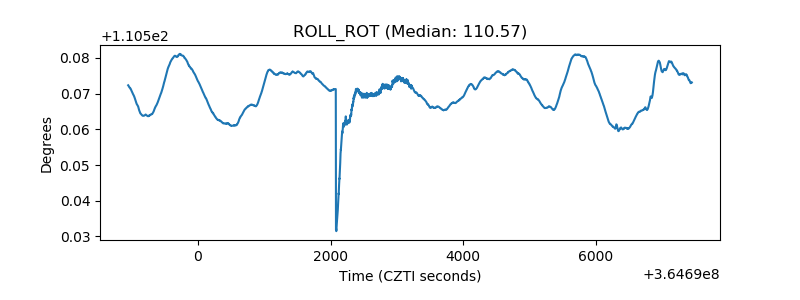 |
| _Roll_DEC | 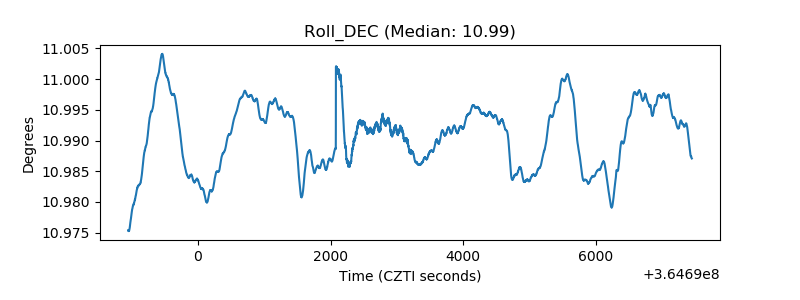 |
| _Roll_RA | 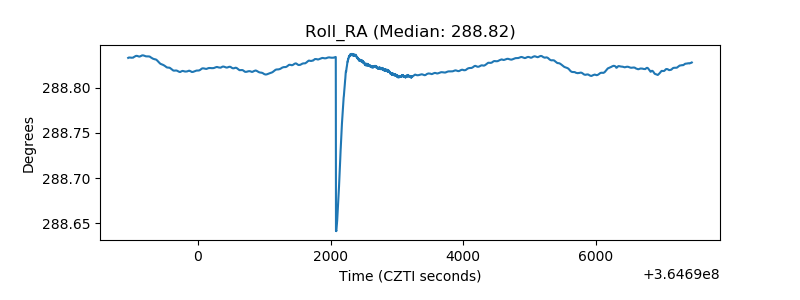 |
| Veto Counter | 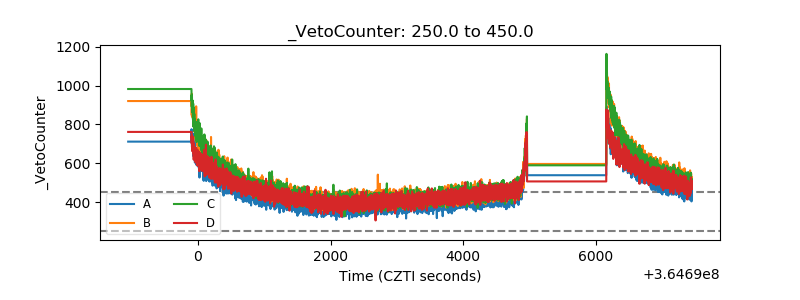 |