| Param | Original file | Final file |
|---|---|---|
| Filename | modeM0/AS1T04_029T01_9000004582_31453cztM0_level2.evt | modeM0/AS1T04_029T01_9000004582_31453cztM0_level2_quad_clean.evt |
| Size (bytes) | 577,566,720 | 96,419,520 |
| Size | 550.8 MB | 92.0 MB |
| Events in quadrant A | 3,207,647 | 651,731 |
| Events in quadrant B | 5,492,633 | 652,042 |
| Events in quadrant C | 4,618,808 | 584,091 |
| Events in quadrant D | 3,751,280 | 597,327 |
| Mode SS | |||
|---|---|---|---|
| Quadrant | BADHDUFLAG | Total packets | Discarded packets |
| A | 0 | 126 | 0 |
| B | 0 | 126 | 0 |
| C | 0 | 126 | 0 |
| D | 0 | 126 | 0 |
| Mode M9 | |||
|---|---|---|---|
| Quadrant | BADHDUFLAG | Total packets | Discarded packets |
| A | 0 | 21 | 0 |
| B | 0 | 22 | 0 |
| C | 0 | 22 | 0 |
| D | 0 | 22 | 0 |
| Mode M0 | |||
|---|---|---|---|
| Quadrant | BADHDUFLAG | Total packets | Discarded packets |
| A | 0 | 13222 | 2 |
| B | 0 | 20341 | 2 |
| C | 0 | 17637 | 2 |
| D | 0 | 15336 | 2 |
| Quadrant | Total seconds | Saturated seconds | Saturation percentage |
|---|---|---|---|
| A | 6229 | 21 | 0.337133% |
| B | 6229 | 238 | 3.820838% |
| C | 6229 | 517 | 8.299888% |
| D | 6229 | 26 | 0.417402% |
Noise dominated data is calculated using 1-second bins in cleaned event files. If a bin has >2000 counts, and if more than 50% of those come from <1% of pixels, then it is considered to be noise-dominated and hence unusable.
| Quadrant | # 1 sec bins | Bins with >0 counts | Bins with >2000 counts | High rate bins dominated by noise | Noise dominated (total time) | Noise dominated (detector-on time) | Marked lightcurve |
|---|---|---|---|---|---|---|---|
| A | 7524 | 6230 | 0 | 0 | 0.00% | 0.00% | 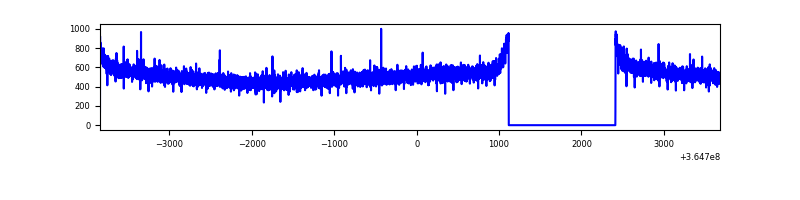 |
| B | 7524 | 6230 | 123 | 123 | 1.63% | 1.97% | 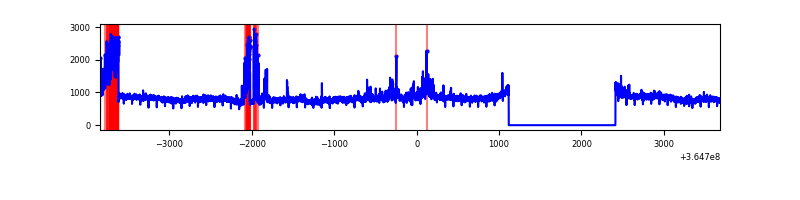 |
| C | 7524 | 6230 | 306 | 306 | 4.07% | 4.91% | 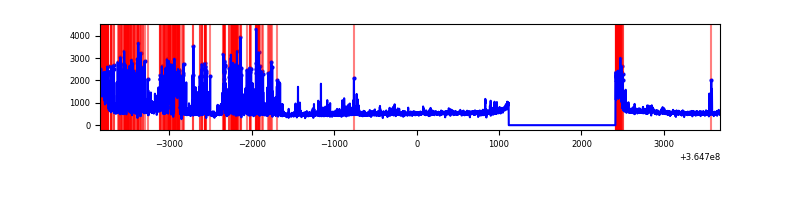 |
| D | 7524 | 6230 | 5 | 5 | 0.07% | 0.08% | 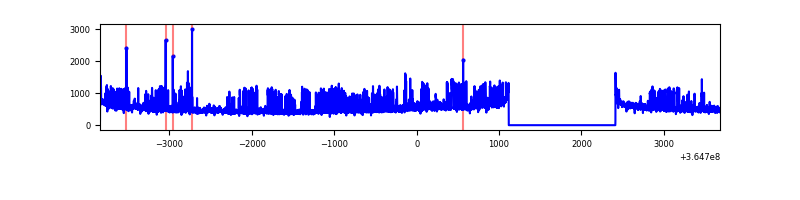 |
Top three noisy pixels from each quadrant. If the there are fewer than three noisy pixels in the level2.evt file, extra rows are filled as -1
| Pixel properties | Quadrant properties | ||||||
|---|---|---|---|---|---|---|---|
| Quadrant | DetID | PixID | Counts | Sigma | Mean | Median | Sigma |
| A | 13 | 254 | 10838 | 61.17 | 832 | 818 | 163.8 |
| A | 3 | 137 | 7692 | 41.97 | 832 | 818 | 163.8 |
| A | 0 | 226 | 7082 | 38.24 | 832 | 818 | 163.8 |
| B | 6 | 159 | 1750020 | 11337.27 | 819 | 801 | 154.3 |
| B | 12 | 1 | 468446 | 3030.96 | 819 | 801 | 154.3 |
| B | 4 | 80 | 34623 | 219.21 | 819 | 801 | 154.3 |
| C | 3 | 233 | 966907 | 5421.18 | 765 | 774 | 178.2 |
| C | 10 | 22 | 232587 | 1300.75 | 765 | 774 | 178.2 |
| C | 0 | 10 | 232506 | 1300.3 | 765 | 774 | 178.2 |
| D | 8 | 195 | 658988 | 3531.36 | 790 | 773 | 186.4 |
| D | 12 | 79 | 38251 | 201.07 | 790 | 773 | 186.4 |
| D | 10 | 203 | 32916 | 172.45 | 790 | 773 | 186.4 |
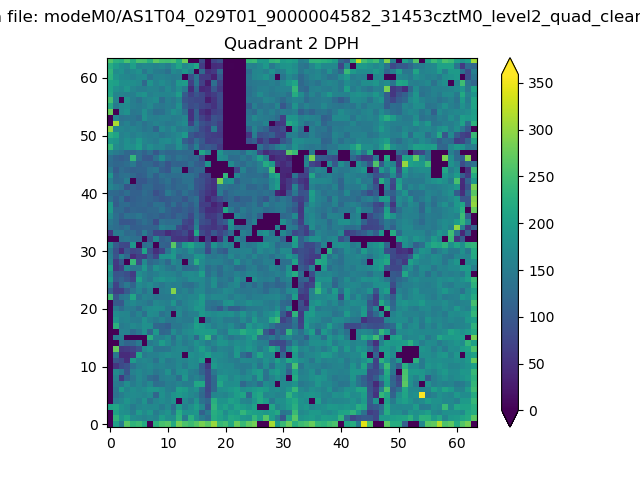
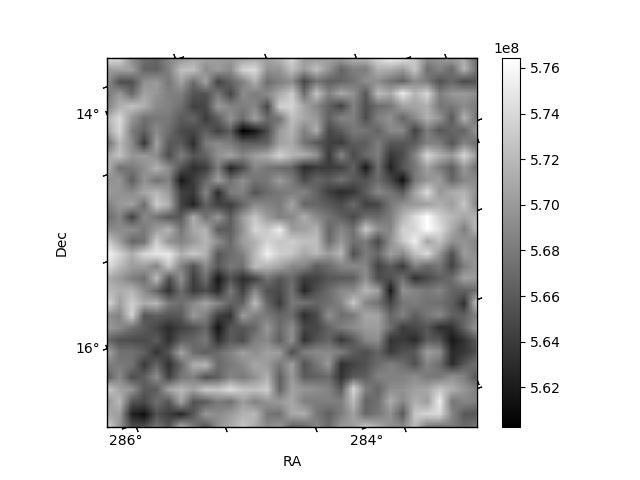
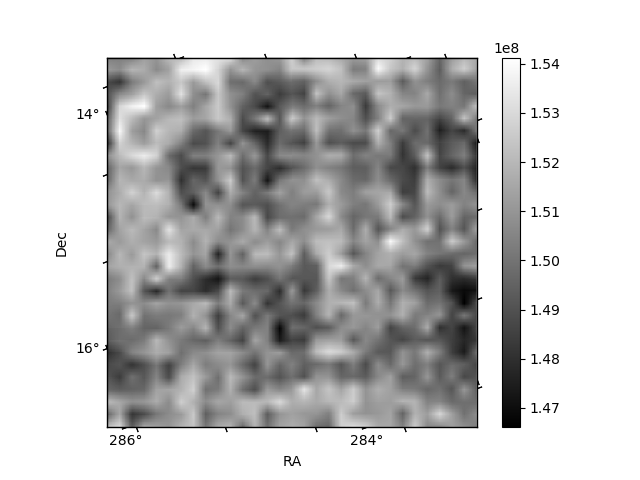
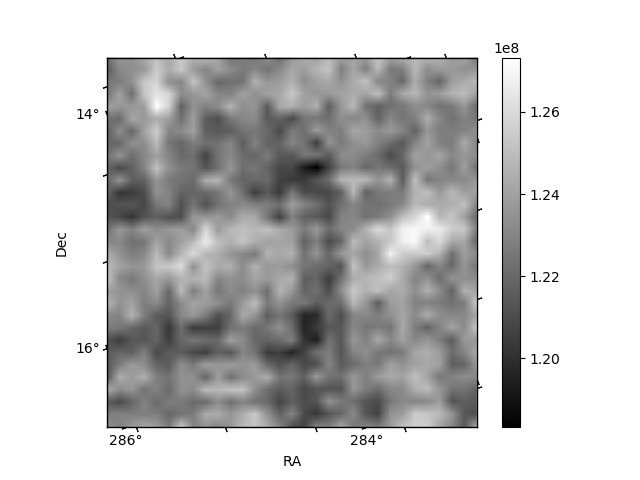
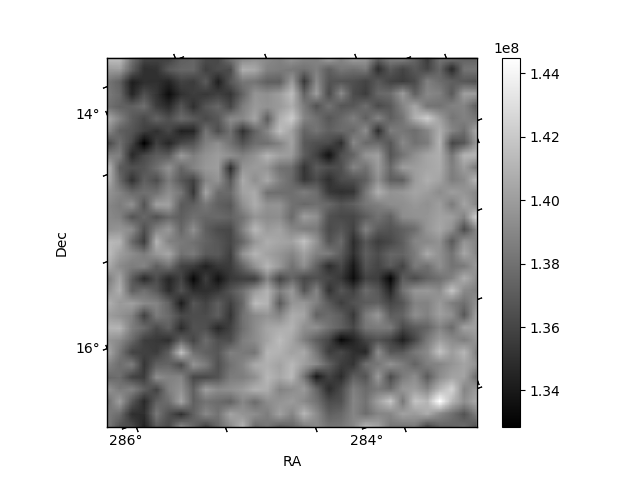
Histogram calculated using DETX and DETY for each event in the final _common_clean file
| Quadrant A | 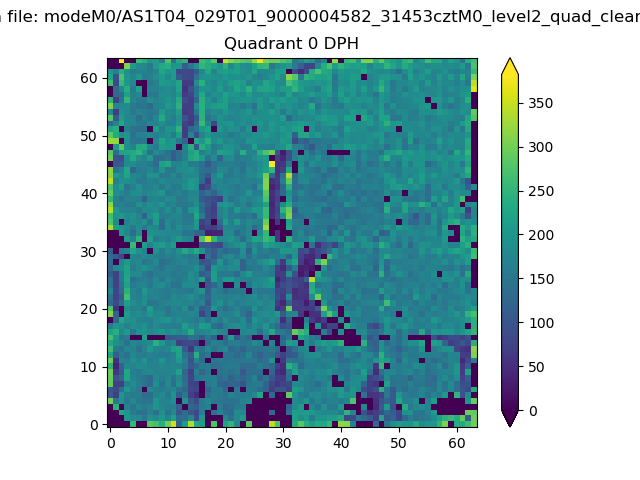 |
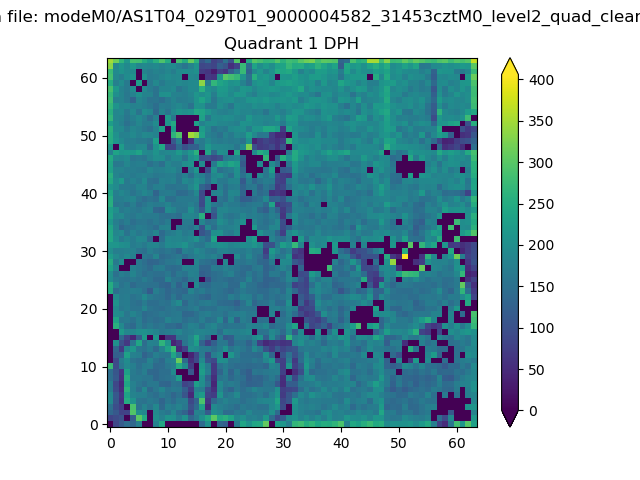 |
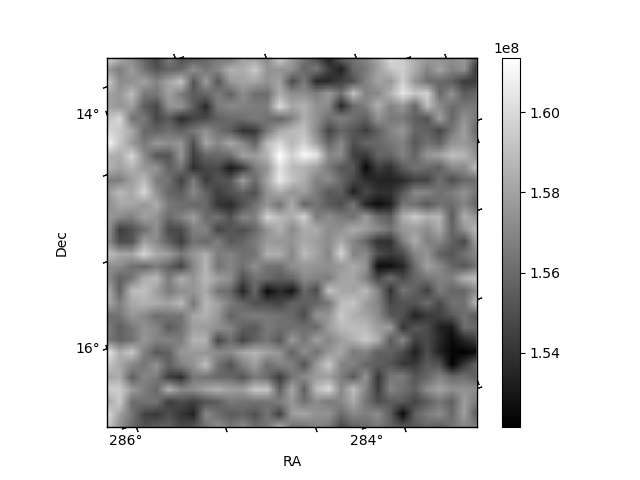
Quadrant B |
|---|---|---|---|
| Quadrant D | 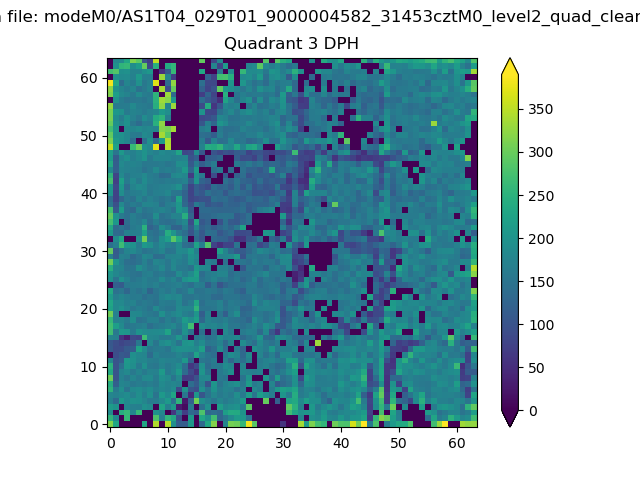 |
 |
Quadrant C |
| Plot type | Count rate plots | Images |
|---|---|---|
| Comparison with Poisson distribution Blue bars denote a histogram of data divided into 1 sec bins. Red curve is a Poisson curve with rate = median count rate of data. |
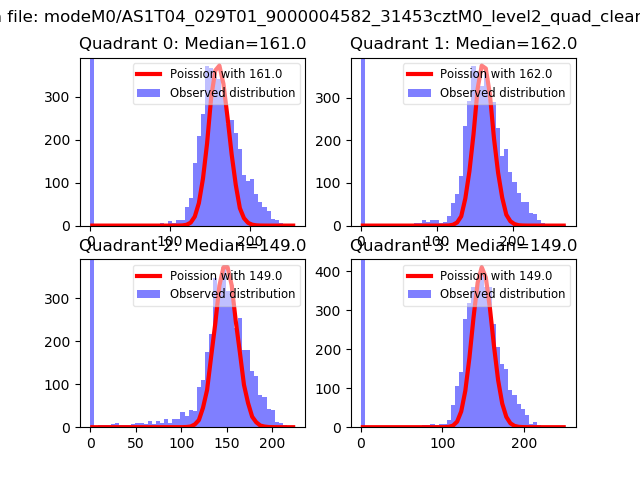 |
 |
| Quadrant-wise count rates Data is divided into 100 sec bins |
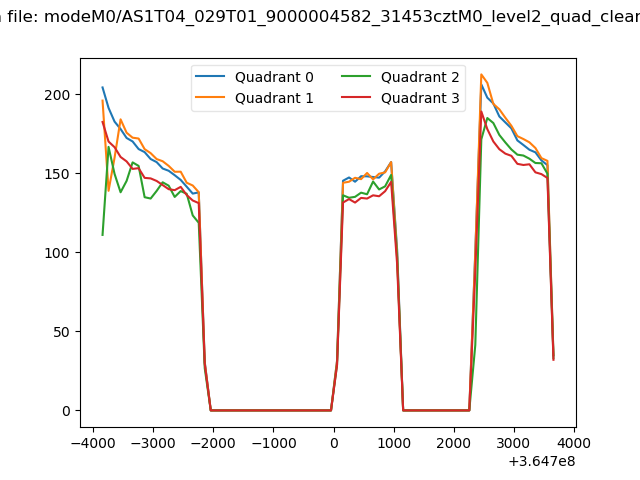 |
|
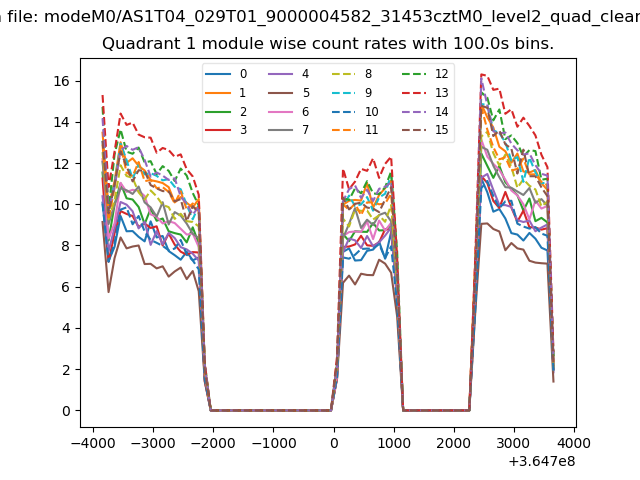
| Module-wise count rates for Quadrant A Data is divided into 100 sec bins |
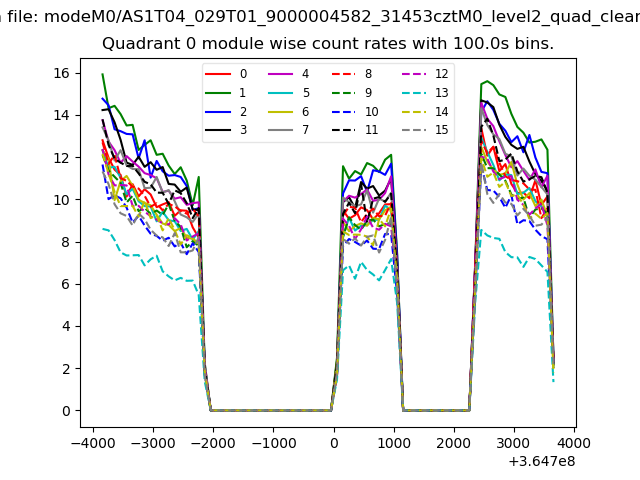 |
 |
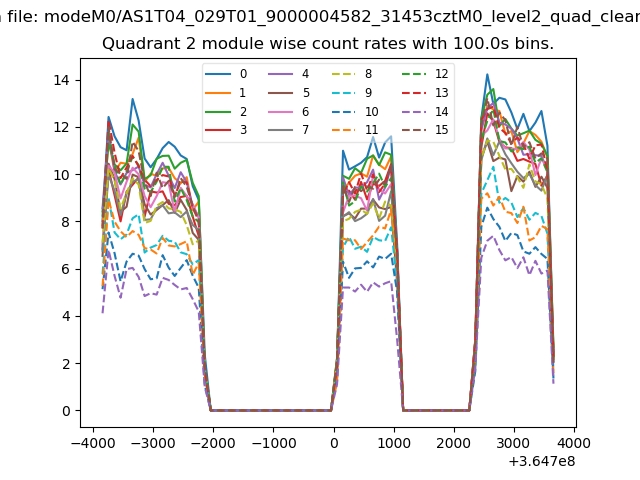
| Module-wise count rates for Quadrant B Data is divided into 100 sec bins |
 |
 |
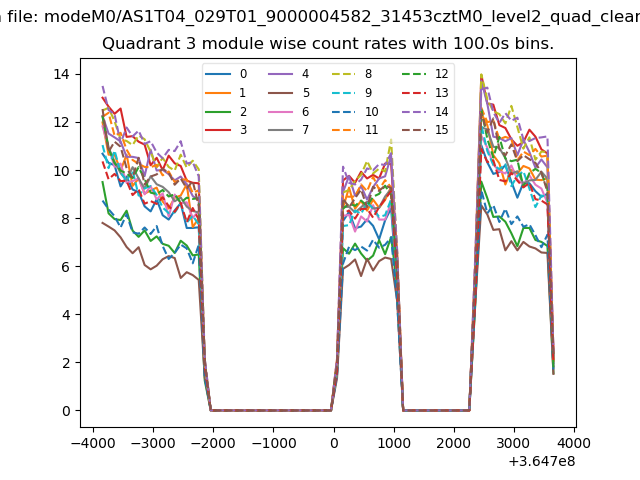
| Module-wise count rates for Quadrant C Data is divided into 100 sec bins |
 |
 |
| Module-wise count rates for Quadrant D Data is divided into 100 sec bins |
 |
 |
| Parameter | Plot |
|---|---|
| CZT HV Monitor |  |
| D_VDD | 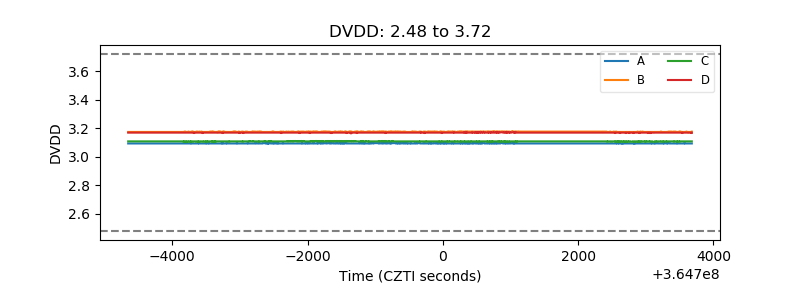 |
| Temperature 1 | 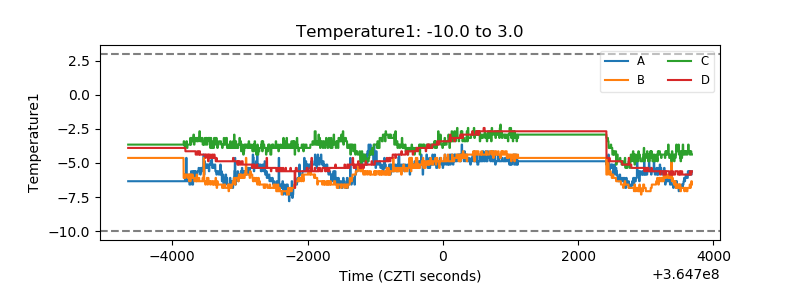 |
| Veto HV Monitor | 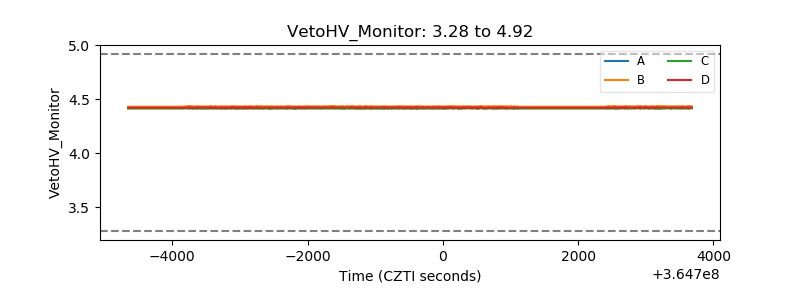 |
| Veto LLD | 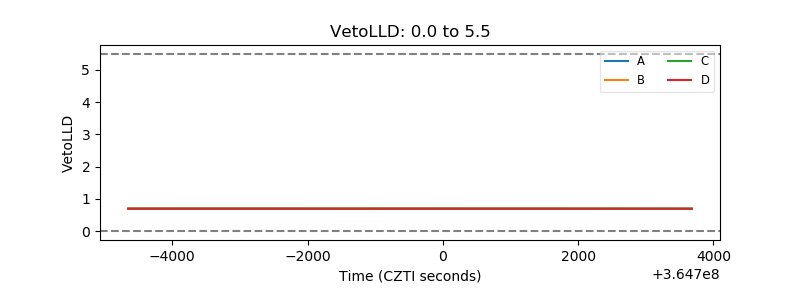 |
| Alpha Counter | 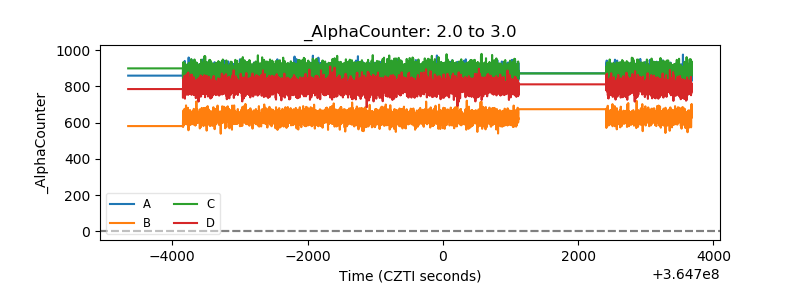 |
| _CPM_Rate |  |
| CZT Counter | 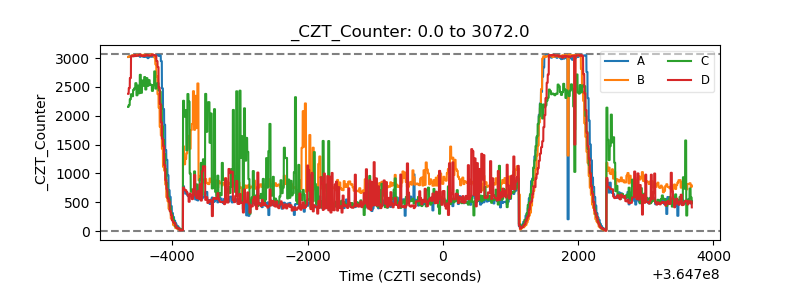 |
| +2.5 Volts monitor |  |
| +5 Volts monitor | 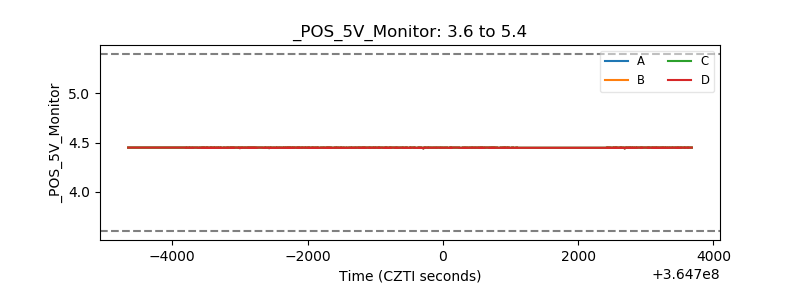 |
| _ROLL_ROT | 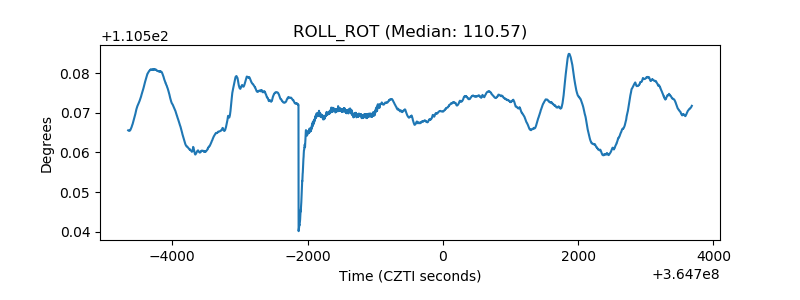 |
| _Roll_DEC | 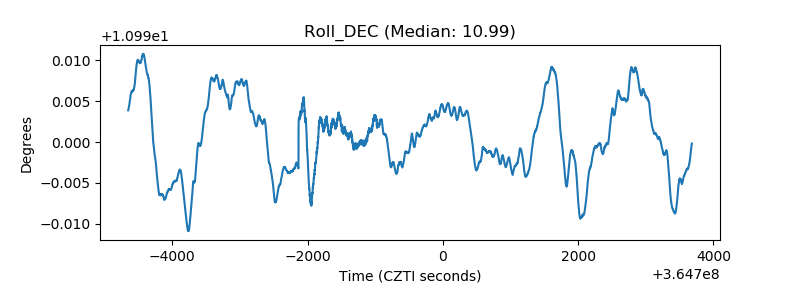 |
| _Roll_RA | 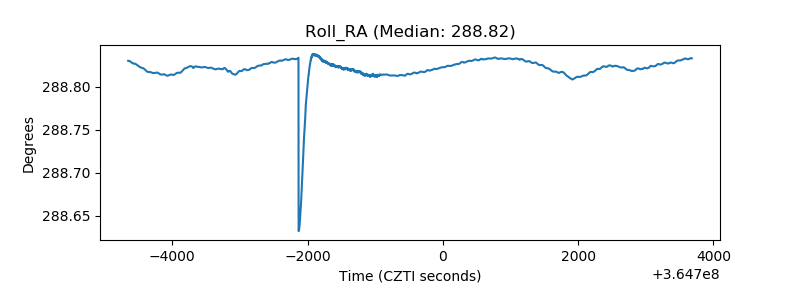 |
| Veto Counter | 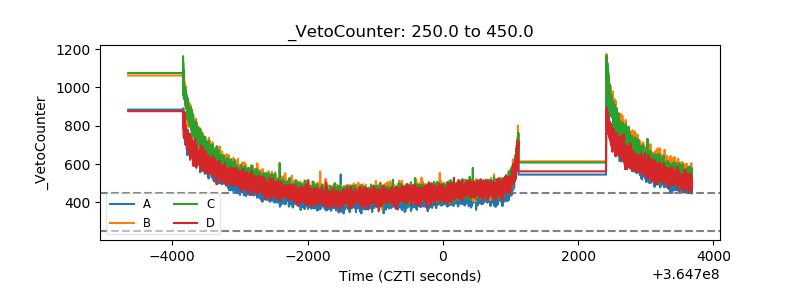 |