| Param | Original file | Final file |
|---|---|---|
| Filename | modeM0/AS1T04_029T01_9000004582_31456cztM0_level2.evt | modeM0/AS1T04_029T01_9000004582_31456cztM0_level2_quad_clean.evt |
| Size (bytes) | 1,360,267,200 | 194,120,640 |
| Size | 1.3 GB | 185.1 MB |
| Events in quadrant A | 8,218,951 | 1,237,057 |
| Events in quadrant B | 13,541,568 | 1,251,004 |
| Events in quadrant C | 9,711,056 | 1,154,732 |
| Events in quadrant D | 8,659,543 | 1,145,922 |
| Mode SS | |||
|---|---|---|---|
| Quadrant | BADHDUFLAG | Total packets | Discarded packets |
| A | 0 | 322 | 0 |
| B | 0 | 322 | 0 |
| C | 0 | 322 | 0 |
| D | 0 | 322 | 0 |
| Mode M9 | |||
|---|---|---|---|
| Quadrant | BADHDUFLAG | Total packets | Discarded packets |
| A | 0 | 39 | 0 |
| B | 0 | 39 | 0 |
| C | 0 | 39 | 0 |
| D | 0 | 39 | 0 |
| Mode M0 | |||
|---|---|---|---|
| Quadrant | BADHDUFLAG | Total packets | Discarded packets |
| A | 0 | 33226 | 3 |
| B | 0 | 50308 | 5 |
| C | 0 | 38257 | 3 |
| D | 0 | 35451 | 3 |
| Quadrant | Total seconds | Saturated seconds | Saturation percentage |
|---|---|---|---|
| A | 15809 | 89 | 0.562970% |
| B | 15808 | 451 | 2.852986% |
| C | 15808 | 520 | 3.289474% |
| D | 15809 | 51 | 0.322601% |
Noise dominated data is calculated using 1-second bins in cleaned event files. If a bin has >2000 counts, and if more than 50% of those come from <1% of pixels, then it is considered to be noise-dominated and hence unusable.
| Quadrant | # 1 sec bins | Bins with >0 counts | Bins with >2000 counts | High rate bins dominated by noise | Noise dominated (total time) | Noise dominated (detector-on time) | Marked lightcurve |
|---|---|---|---|---|---|---|---|
| A | 19744 | 15812 | 0 | 0 | 0.00% | 0.00% | 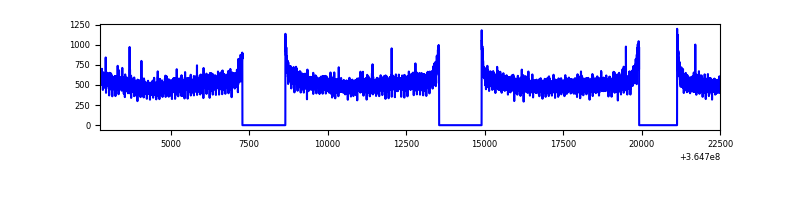 |
| B | 19743 | 15810 | 93 | 93 | 0.47% | 0.59% | 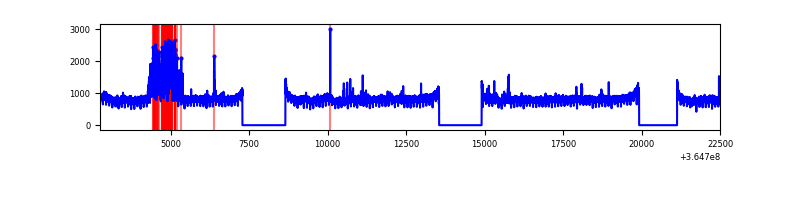 |
| C | 19743 | 15811 | 233 | 233 | 1.18% | 1.47% | 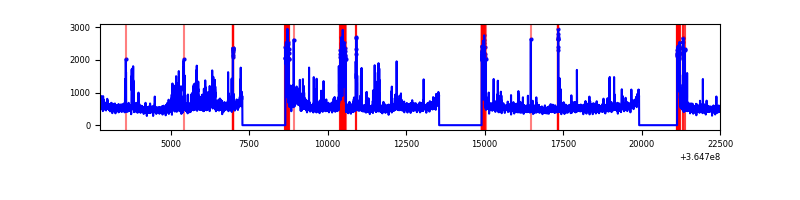 |
| D | 19744 | 15812 | 17 | 17 | 0.09% | 0.11% | 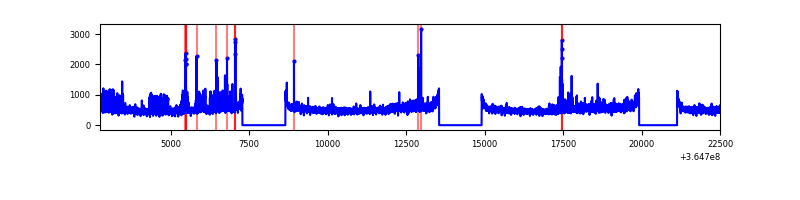 |
Top three noisy pixels from each quadrant. If the there are fewer than three noisy pixels in the level2.evt file, extra rows are filled as -1
| Pixel properties | Quadrant properties | ||||||
|---|---|---|---|---|---|---|---|
| Quadrant | DetID | PixID | Counts | Sigma | Mean | Median | Sigma |
| A | 13 | 254 | 26769 | 59.01 | 2132 | 2096 | 418.1 |
| A | 3 | 137 | 21050 | 45.33 | 2132 | 2096 | 418.1 |
| A | 0 | 226 | 18154 | 38.4 | 2132 | 2096 | 418.1 |
| B | 6 | 159 | 4461673 | 11321.36 | 2101 | 2051 | 393.9 |
| B | 12 | 1 | 698647 | 1768.4 | 2101 | 2051 | 393.9 |
| B | 0 | 190 | 65562 | 161.23 | 2101 | 2051 | 393.9 |
| C | 10 | 22 | 831581 | 1799.37 | 1992 | 2013 | 461.0 |
| C | 0 | 10 | 547407 | 1182.98 | 1992 | 2013 | 461.0 |
| C | 14 | 238 | 339152 | 731.27 | 1992 | 2013 | 461.0 |
| D | 8 | 195 | 881413 | 1872.38 | 2021 | 1973 | 469.7 |
| D | 5 | 233 | 105593 | 220.61 | 2021 | 1973 | 469.7 |
| D | 2 | 234 | 54161 | 111.11 | 2021 | 1973 | 469.7 |
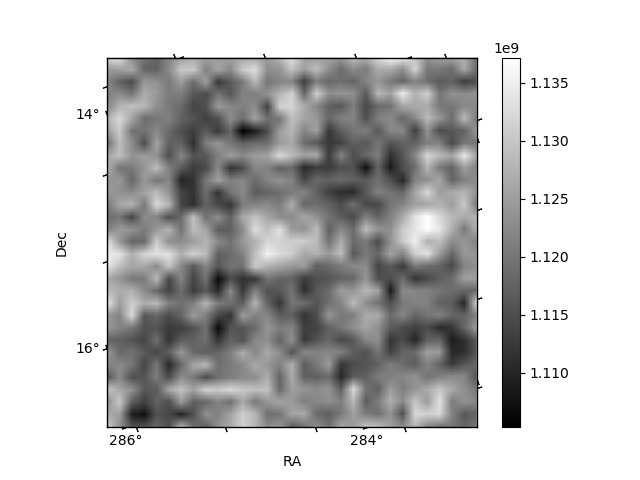
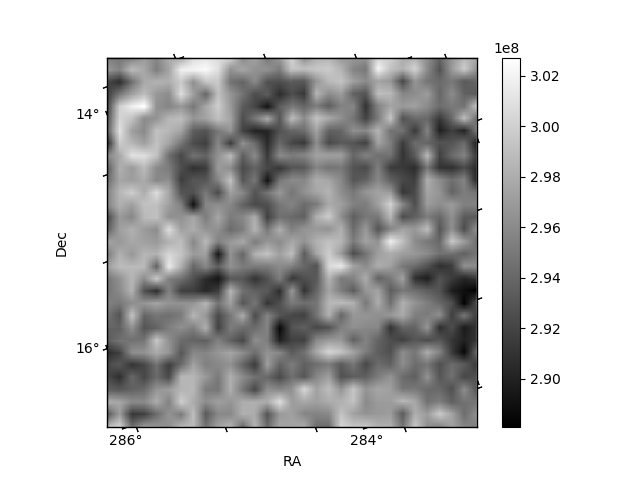
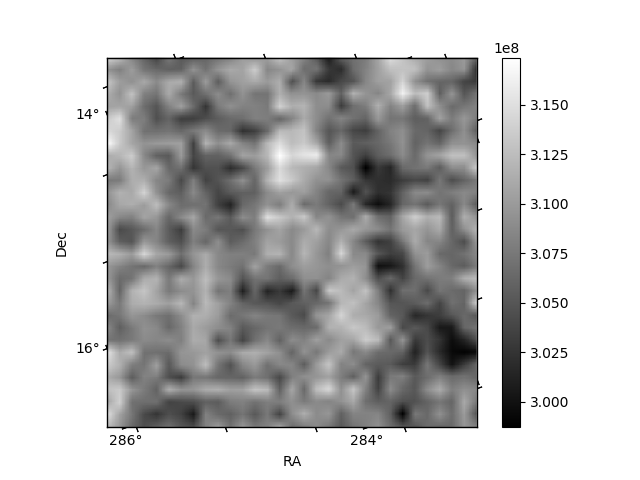
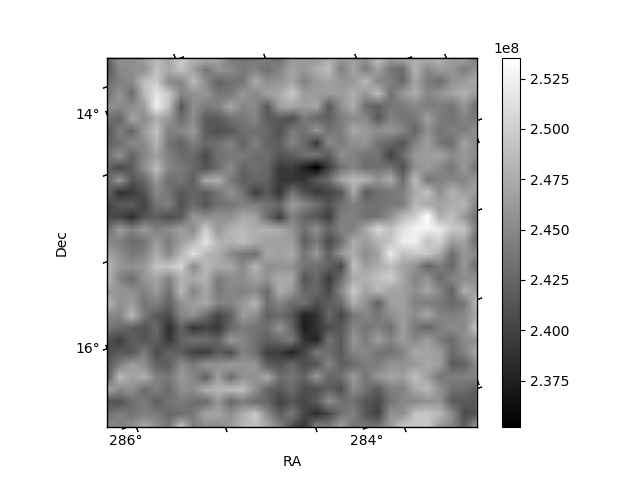
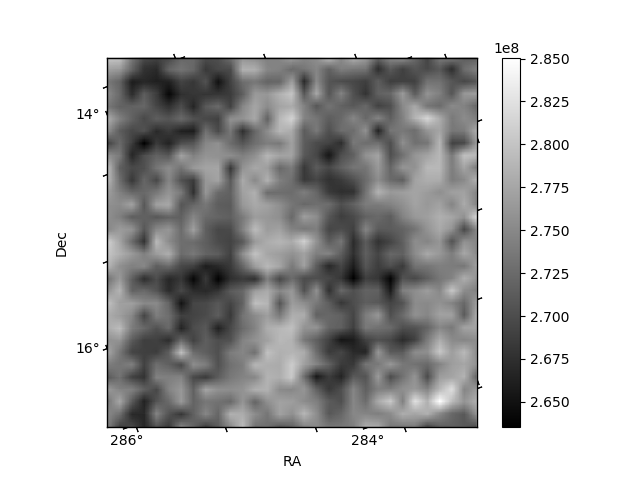
Histogram calculated using DETX and DETY for each event in the final _common_clean file
| Quadrant A | 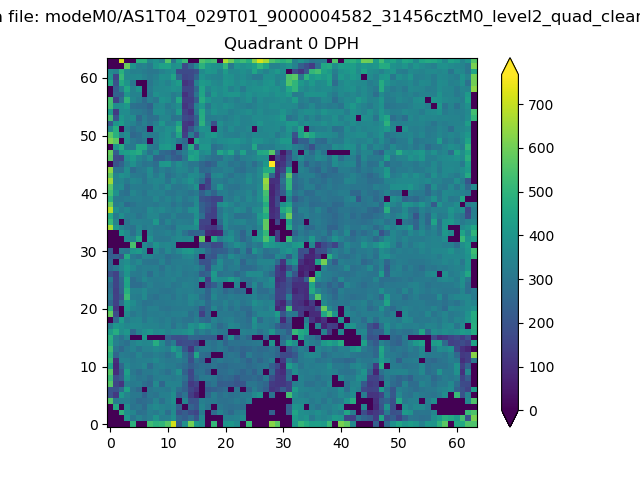 |
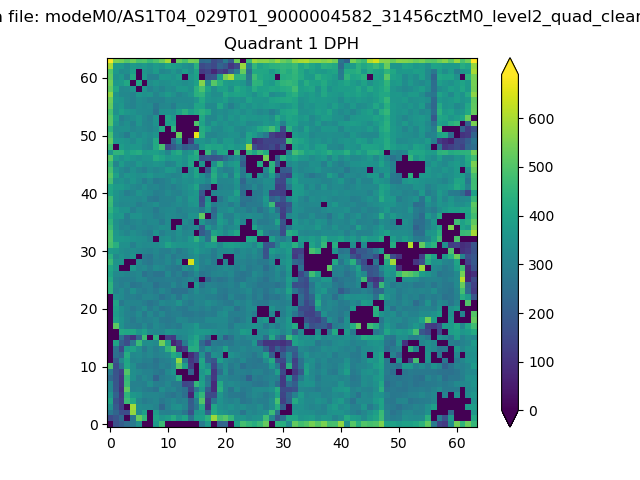 |
Quadrant B |
|---|---|---|---|
| Quadrant D | 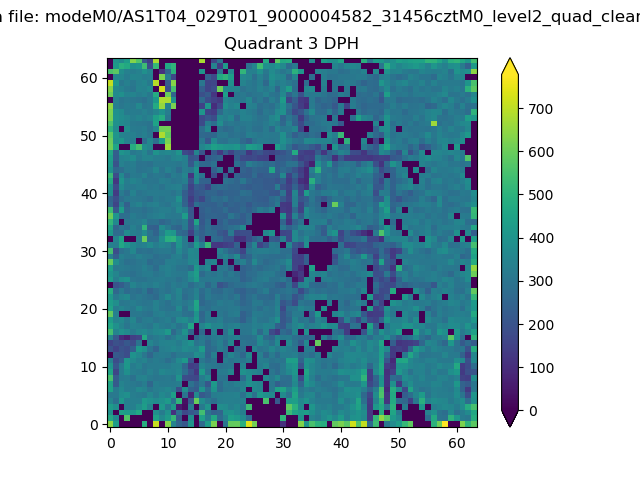 |
 |
Quadrant C |
| Plot type | Count rate plots | Images |
|---|---|---|
| Comparison with Poisson distribution Blue bars denote a histogram of data divided into 1 sec bins. Red curve is a Poisson curve with rate = median count rate of data. |
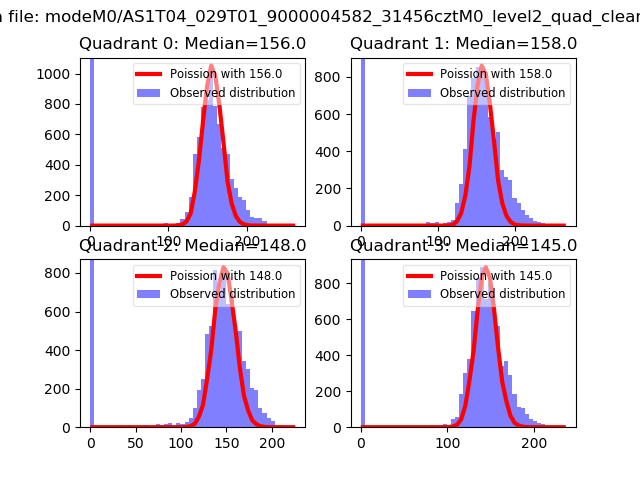 |
 |
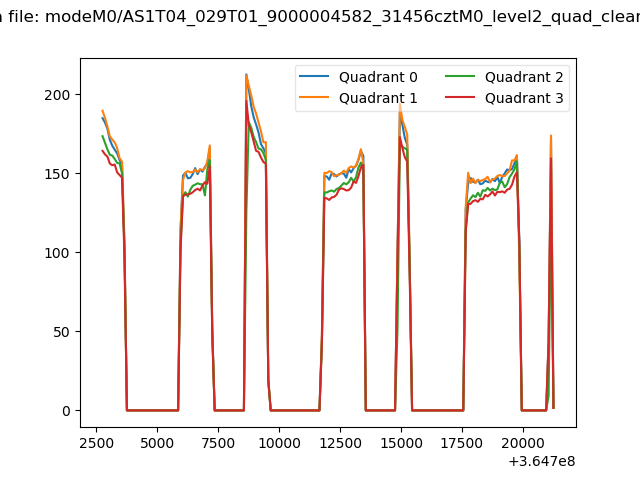
| Quadrant-wise count rates Data is divided into 100 sec bins |
 |
|
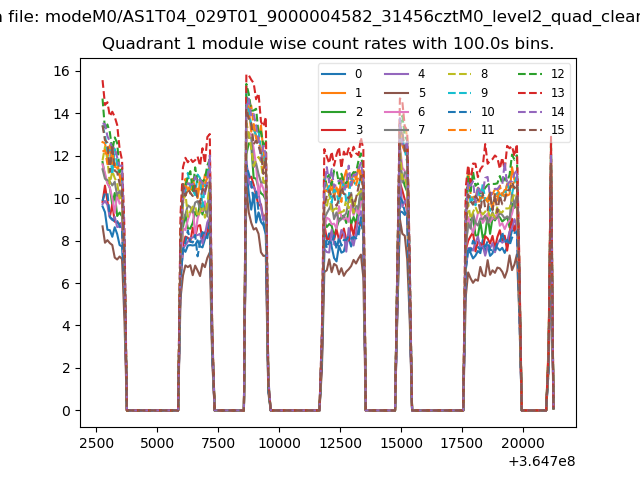
| Module-wise count rates for Quadrant A Data is divided into 100 sec bins |
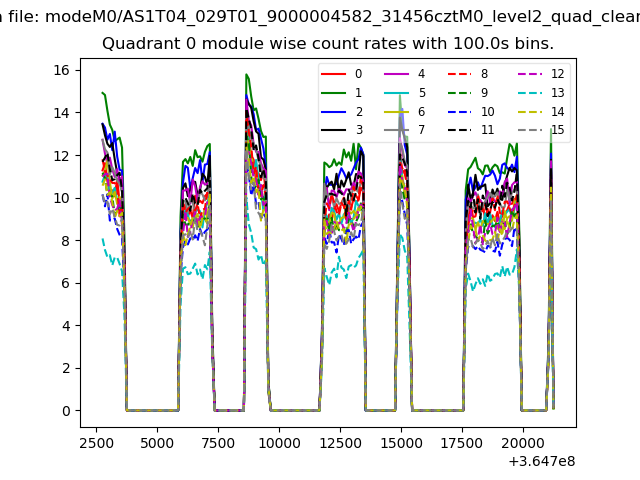 |
 |
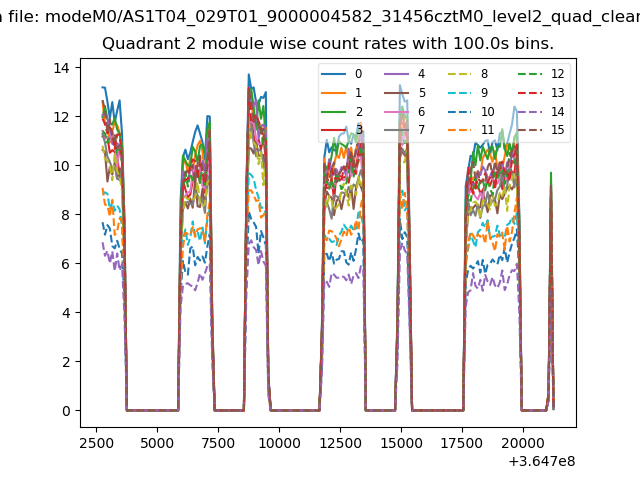
| Module-wise count rates for Quadrant B Data is divided into 100 sec bins |
 |
 |
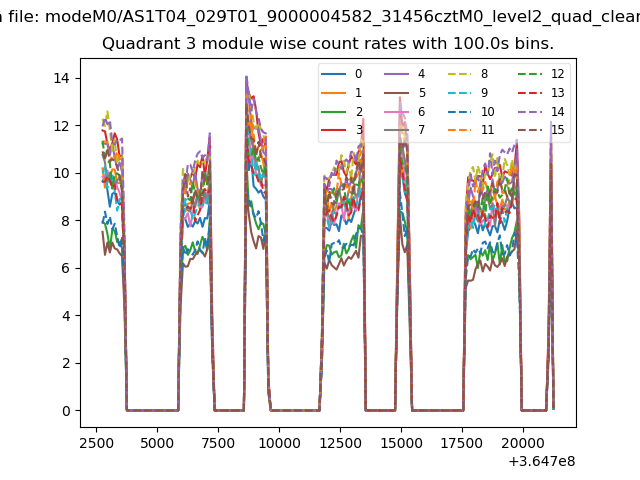
| Module-wise count rates for Quadrant C Data is divided into 100 sec bins |
 |
 |
| Module-wise count rates for Quadrant D Data is divided into 100 sec bins |
 |
 |
| Parameter | Plot |
|---|---|
| CZT HV Monitor | 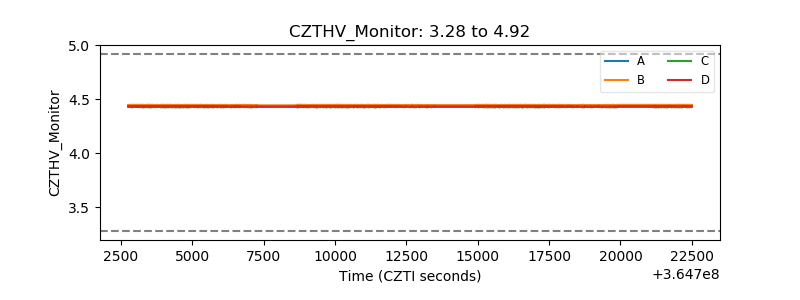 |
| D_VDD | 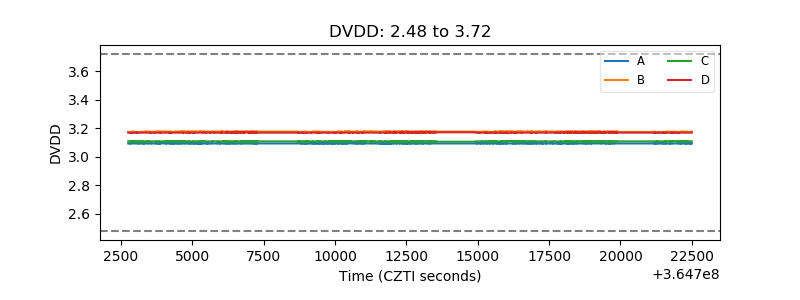 |
| Temperature 1 | 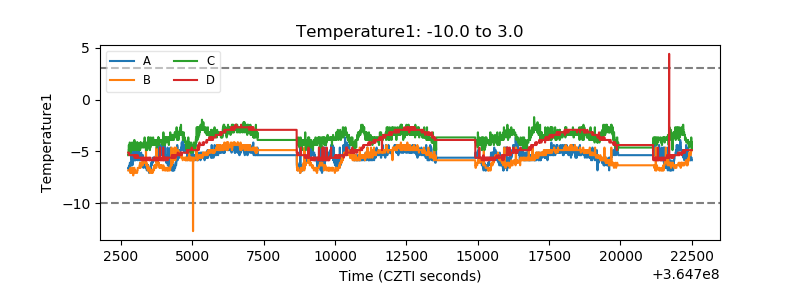 |
| Veto HV Monitor |  |
| Veto LLD | 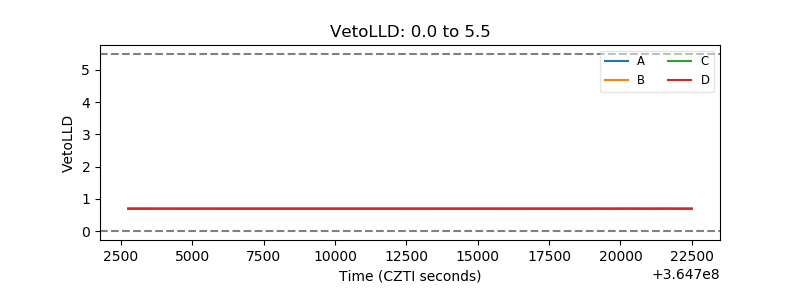 |
| Alpha Counter | 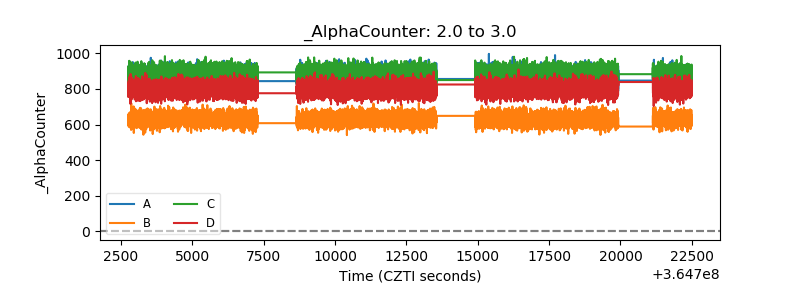 |
| _CPM_Rate | 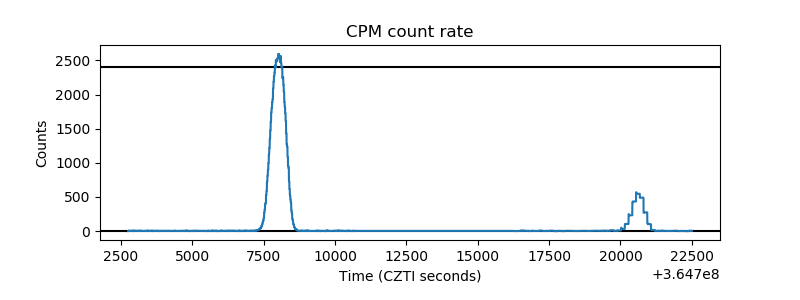 |
| CZT Counter |  |
| +2.5 Volts monitor |  |
| +5 Volts monitor | 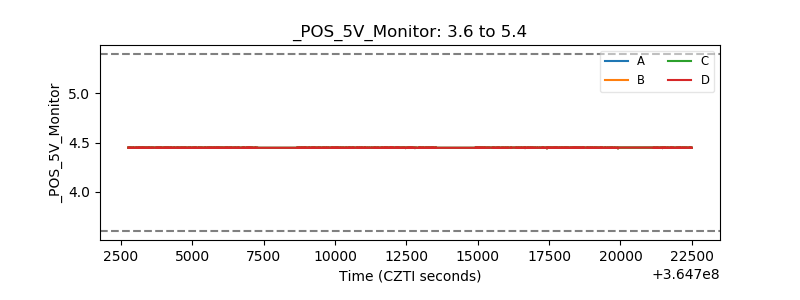 |
| _ROLL_ROT | 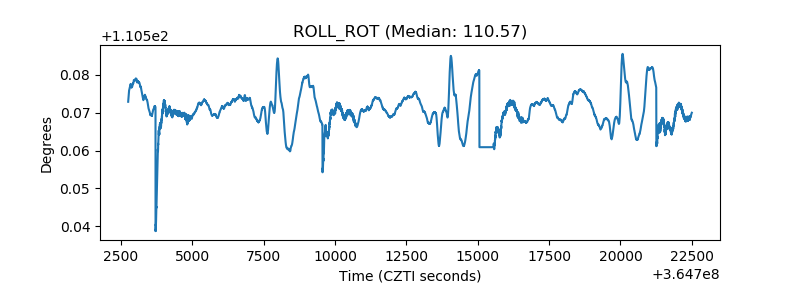 |
| _Roll_DEC | 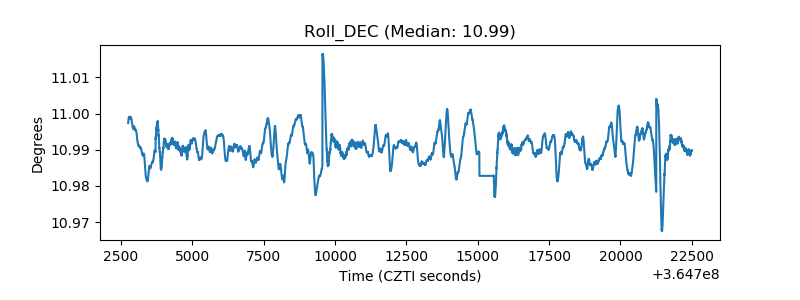 |
| _Roll_RA | 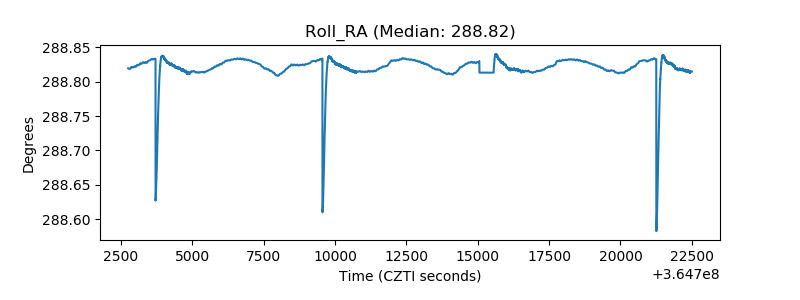 |
| Veto Counter | 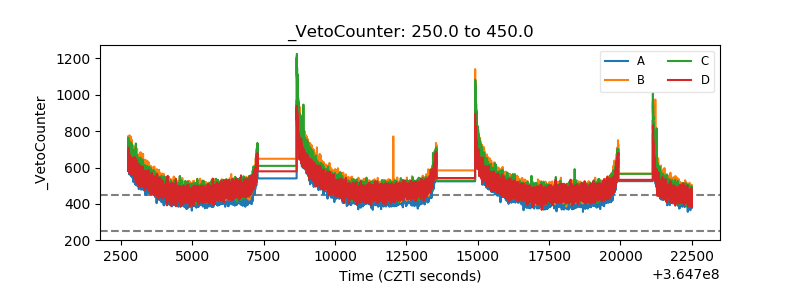 |