| Param | Original file | Final file |
|---|---|---|
| Filename | modeM0/AS1T04_029T01_9000004582_31457cztM0_level2.evt | modeM0/AS1T04_029T01_9000004582_31457cztM0_level2_quad_clean.evt |
| Size (bytes) | 552,012,480 | 72,861,120 |
| Size | 526.4 MB | 69.5 MB |
| Events in quadrant A | 3,412,083 | 446,805 |
| Events in quadrant B | 5,424,717 | 445,736 |
| Events in quadrant C | 3,737,250 | 422,057 |
| Events in quadrant D | 3,685,536 | 420,136 |
| Mode SS | |||
|---|---|---|---|
| Quadrant | BADHDUFLAG | Total packets | Discarded packets |
| A | 0 | 138 | 0 |
| B | 0 | 138 | 0 |
| C | 0 | 138 | 0 |
| D | 0 | 138 | 0 |
| Mode M9 | |||
|---|---|---|---|
| Quadrant | BADHDUFLAG | Total packets | Discarded packets |
| A | 0 | 8 | 0 |
| B | 0 | 8 | 0 |
| C | 0 | 8 | 0 |
| D | 0 | 8 | 0 |
| Mode M0 | |||
|---|---|---|---|
| Quadrant | BADHDUFLAG | Total packets | Discarded packets |
| A | 0 | 14139 | 2 |
| B | 0 | 20770 | 3 |
| C | 0 | 15001 | 2 |
| D | 0 | 15014 | 2 |
| Quadrant | Total seconds | Saturated seconds | Saturation percentage |
|---|---|---|---|
| A | 6757 | 153 | 2.264318% |
| B | 6757 | 250 | 3.699867% |
| C | 6757 | 277 | 4.099452% |
| D | 6757 | 115 | 1.701939% |
Noise dominated data is calculated using 1-second bins in cleaned event files. If a bin has >2000 counts, and if more than 50% of those come from <1% of pixels, then it is considered to be noise-dominated and hence unusable.
| Quadrant | # 1 sec bins | Bins with >0 counts | Bins with >2000 counts | High rate bins dominated by noise | Noise dominated (total time) | Noise dominated (detector-on time) | Marked lightcurve |
|---|---|---|---|---|---|---|---|
| A | 7557 | 6757 | 0 | 0 | 0.00% | 0.00% | 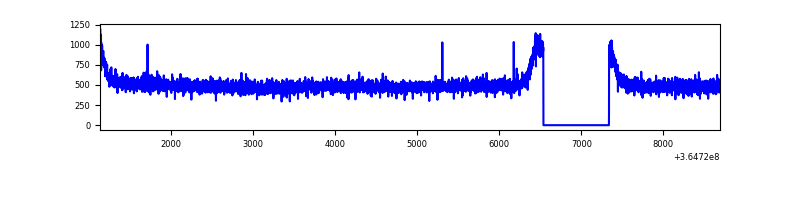 |
| B | 7557 | 6757 | 3 | 3 | 0.04% | 0.04% | 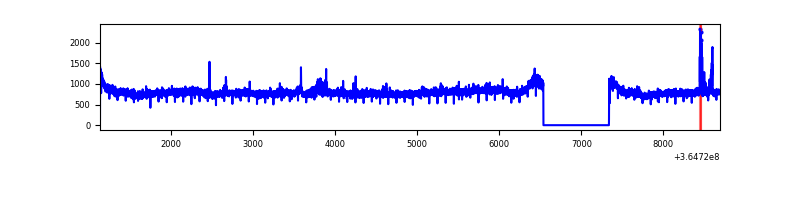 |
| C | 7557 | 6757 | 56 | 56 | 0.74% | 0.83% | 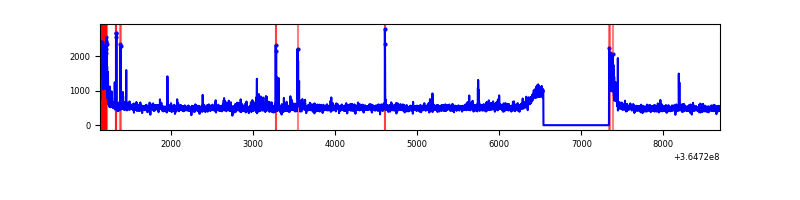 |
| D | 7557 | 6757 | 1 | 1 | 0.01% | 0.01% | 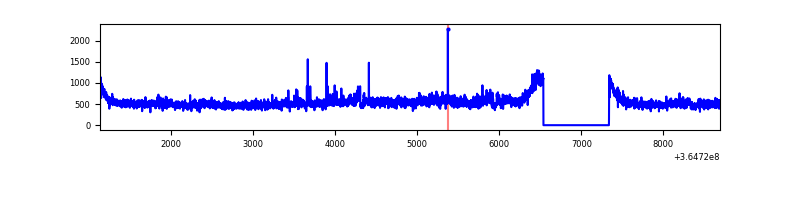 |
Top three noisy pixels from each quadrant. If the there are fewer than three noisy pixels in the level2.evt file, extra rows are filled as -1
| Pixel properties | Quadrant properties | ||||||
|---|---|---|---|---|---|---|---|
| Quadrant | DetID | PixID | Counts | Sigma | Mean | Median | Sigma |
| A | 13 | 254 | 11180 | 58.03 | 884 | 867 | 177.7 |
| A | 3 | 137 | 9175 | 46.74 | 884 | 867 | 177.7 |
| A | 0 | 226 | 7487 | 37.25 | 884 | 867 | 177.7 |
| B | 6 | 159 | 1911474 | 11387.35 | 868 | 847 | 167.8 |
| B | 12 | 1 | 40828 | 238.29 | 868 | 847 | 167.8 |
| B | 0 | 190 | 39464 | 230.16 | 868 | 847 | 167.8 |
| C | 0 | 10 | 263415 | 1333.87 | 832 | 840 | 196.9 |
| C | 14 | 238 | 134162 | 677.27 | 832 | 840 | 196.9 |
| C | 3 | 233 | 48802 | 243.64 | 832 | 840 | 196.9 |
| D | 8 | 195 | 446414 | 2230.79 | 850 | 829 | 199.7 |
| D | 2 | 234 | 23638 | 114.19 | 850 | 829 | 199.7 |
| D | 5 | 233 | 22706 | 109.53 | 850 | 829 | 199.7 |
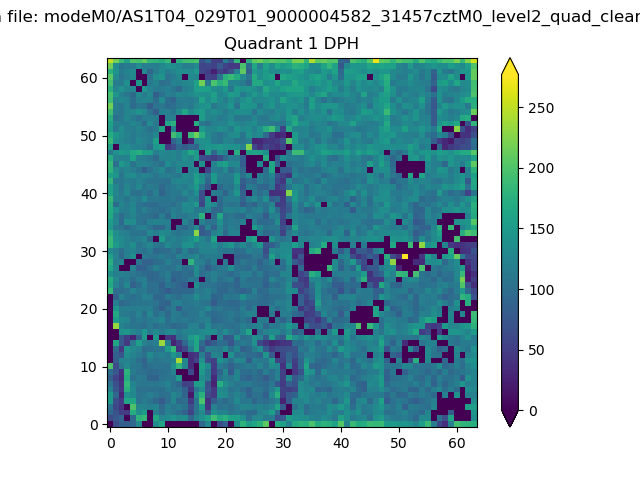
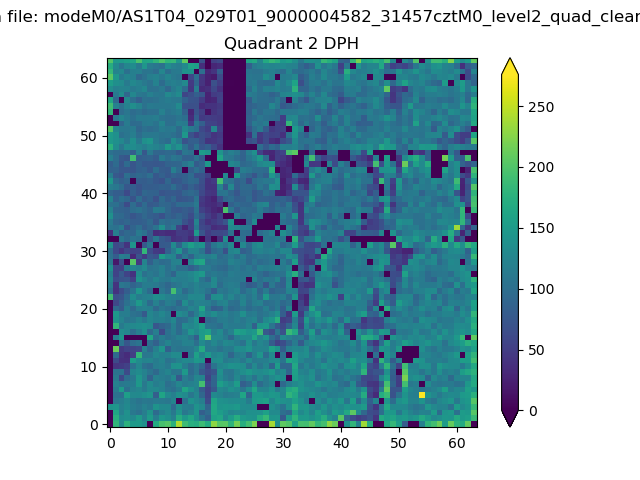
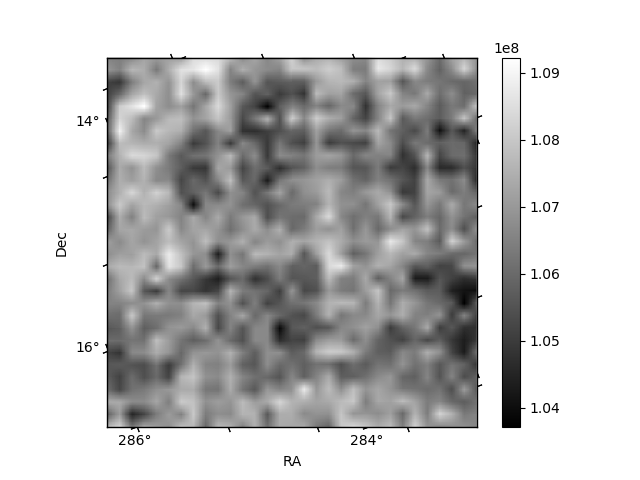
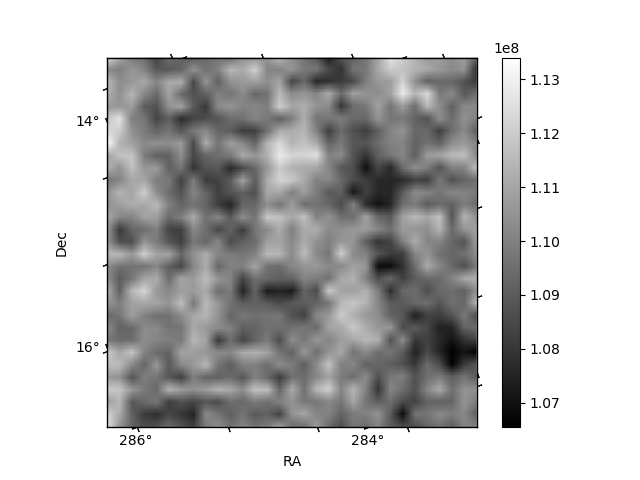
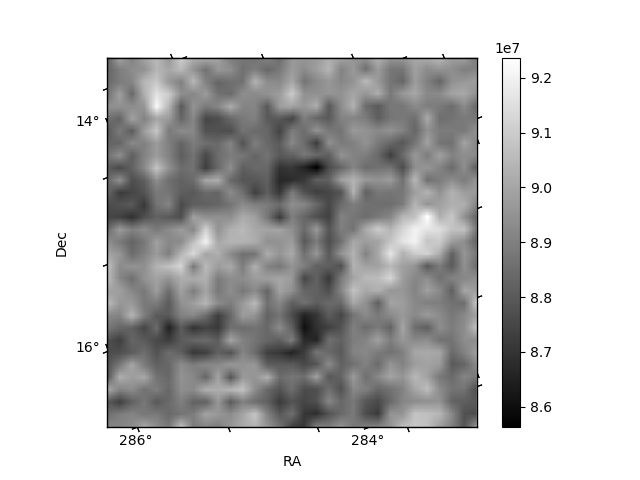
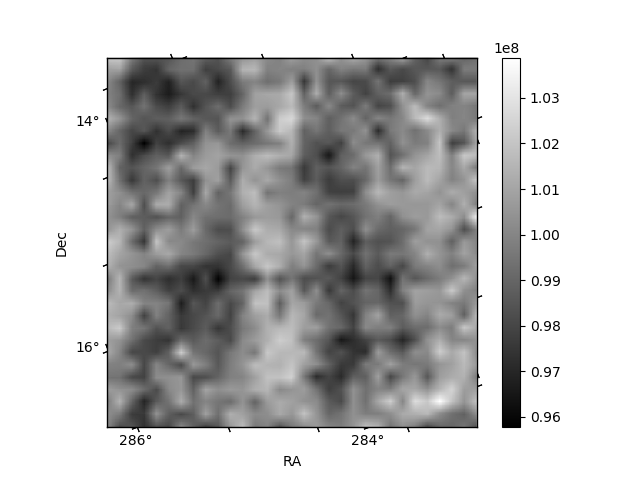
Histogram calculated using DETX and DETY for each event in the final _common_clean file
| Quadrant A |  |
 |
Quadrant B |
|---|---|---|---|
| Quadrant D |  |
 |
Quadrant C |
| Plot type | Count rate plots | Images |
|---|---|---|
| Comparison with Poisson distribution Blue bars denote a histogram of data divided into 1 sec bins. Red curve is a Poisson curve with rate = median count rate of data. |
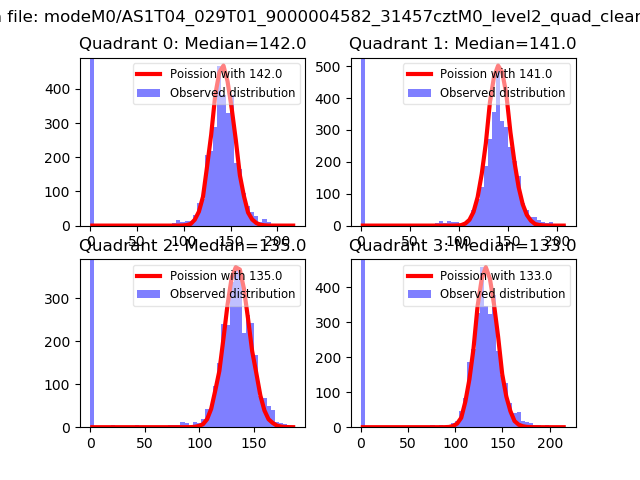 |
 |
| Quadrant-wise count rates Data is divided into 100 sec bins |
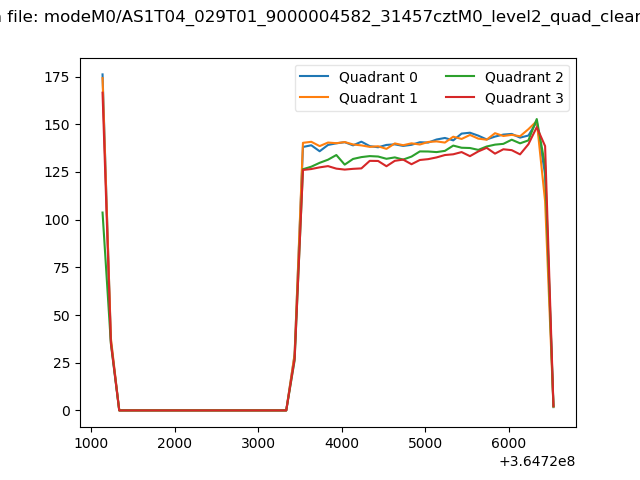 |
|
| Module-wise count rates for Quadrant A Data is divided into 100 sec bins |
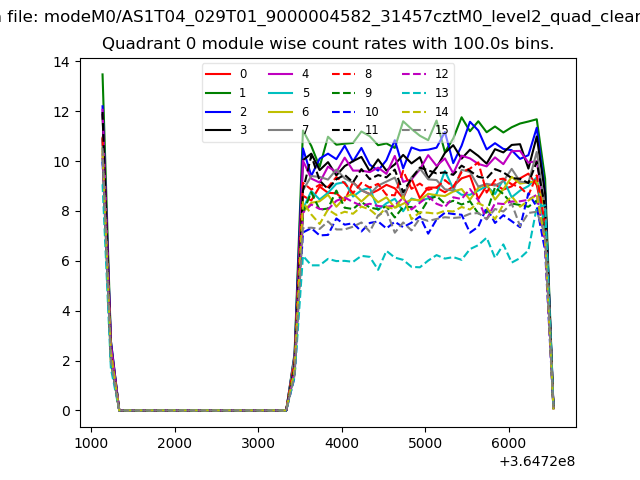 |
 |
| Module-wise count rates for Quadrant B Data is divided into 100 sec bins |
 |
 |
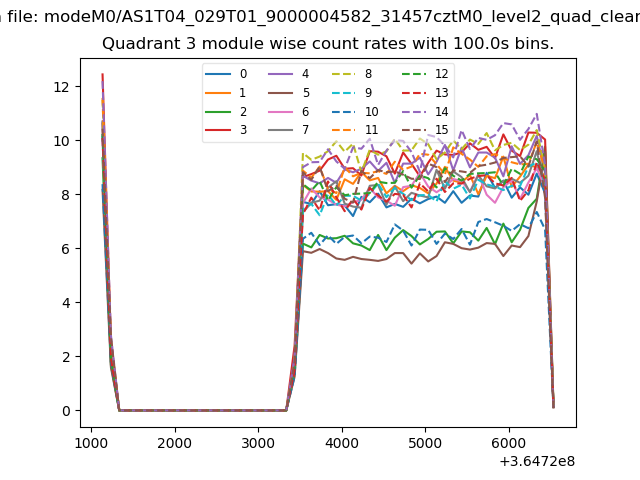
| Module-wise count rates for Quadrant C Data is divided into 100 sec bins |
 |
 |
| Module-wise count rates for Quadrant D Data is divided into 100 sec bins |
 |
 |
| Parameter | Plot |
|---|---|
| CZT HV Monitor |  |
| D_VDD | 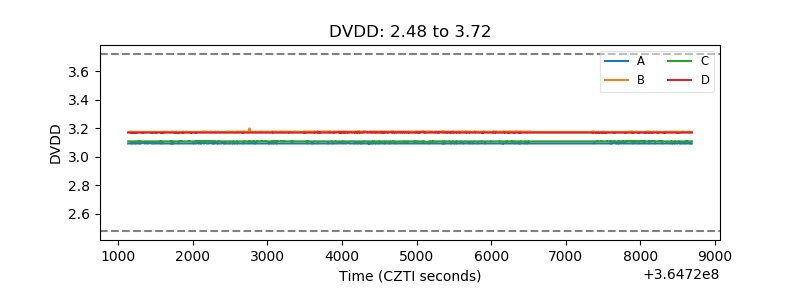 |
| Temperature 1 | 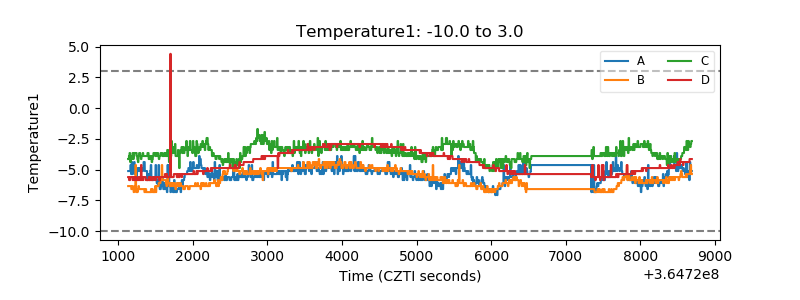 |
| Veto HV Monitor | 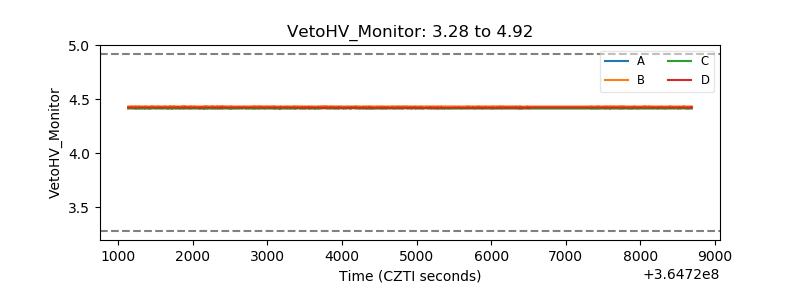 |
| Veto LLD | 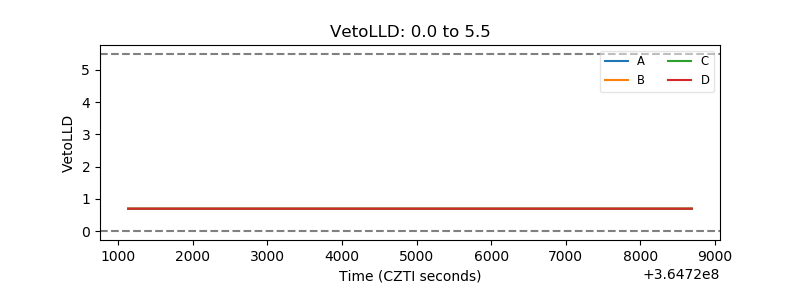 |
| Alpha Counter | 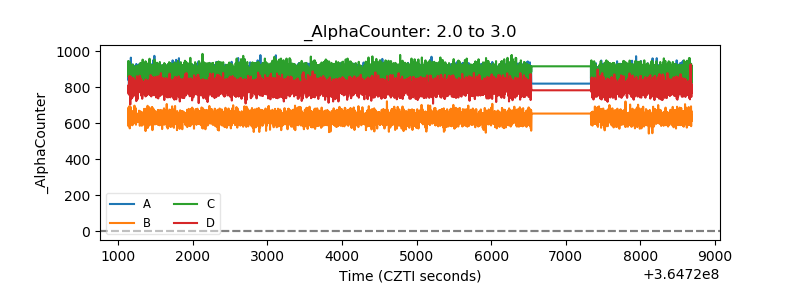 |
| _CPM_Rate | 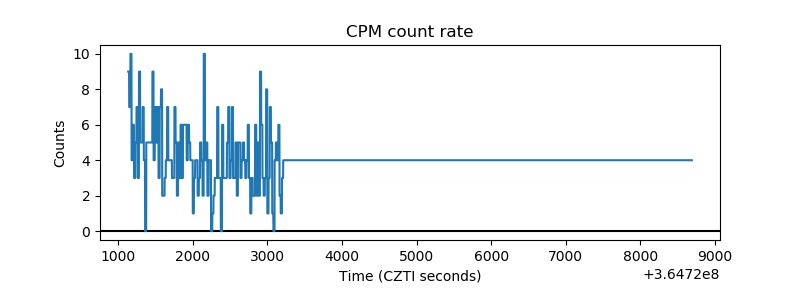 |
| CZT Counter | 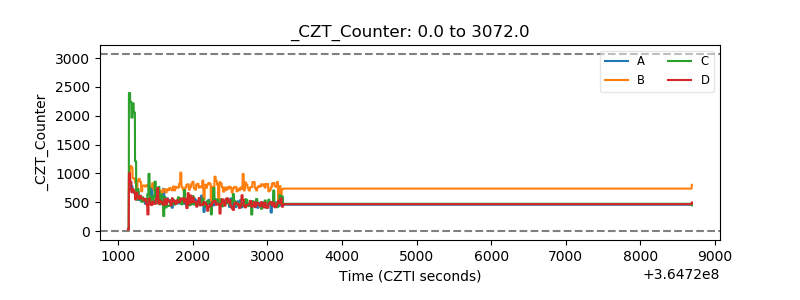 |
| +2.5 Volts monitor |  |
| +5 Volts monitor | 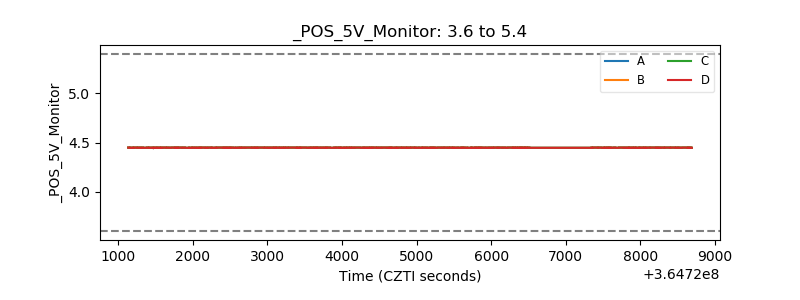 |
| _ROLL_ROT | 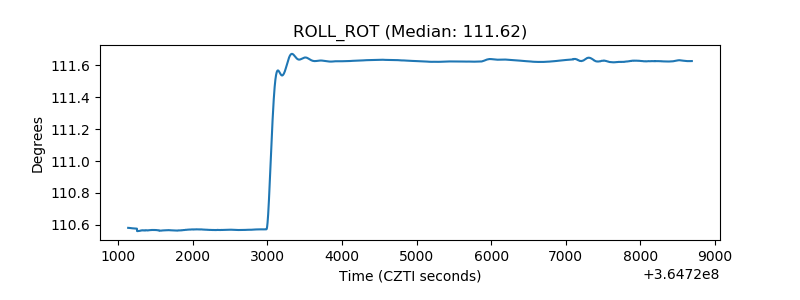 |
| _Roll_DEC | 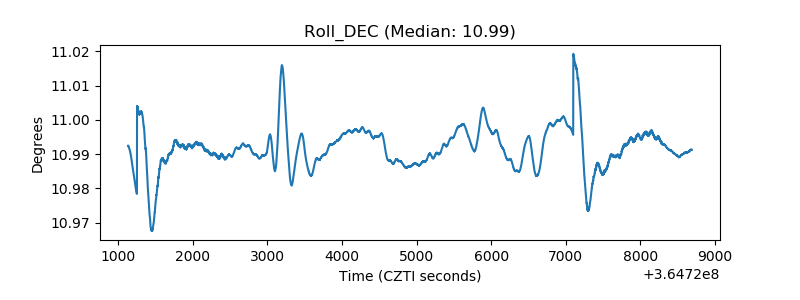 |
| _Roll_RA | 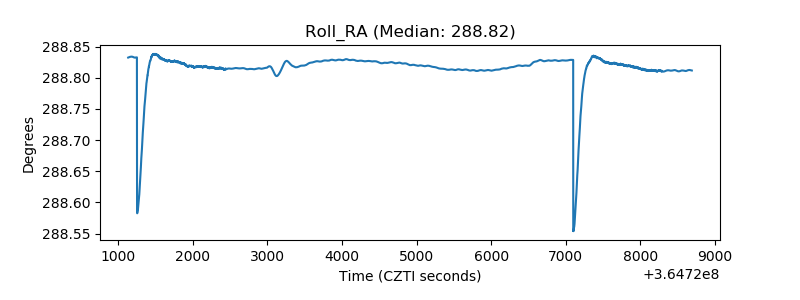 |
| Veto Counter | 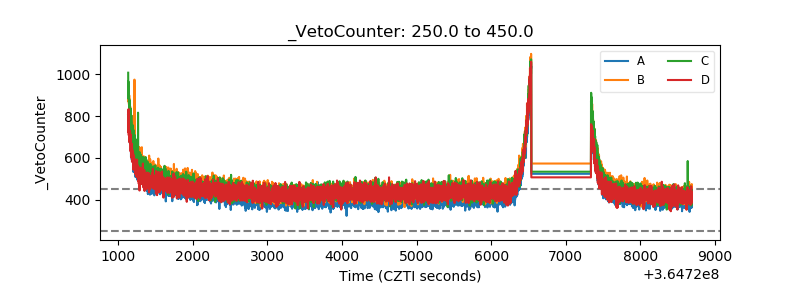 |